In Japan's super-aged society, the increasing proportion of people requiring nursing care is partly attributed to falls caused by a decline in walking ability. Early detection of walking ability deterioration can potentially reduce the risk of falls. Although individuals tend to perform better in laboratory settings than in daily life, this finding highlights the importance of monitoring walking in daily living, which has not been sufficiently explored. This study aimed to develop shoes to evaluate the walking ability in daily life by focusing on balance, which is a key indicator of walking deterioration. Balance ability is divided into static balance, which maintains stability, and dynamic balance, which adjusts posture under unstable conditions; dynamic balance is crucial for walking. Common dynamic balance evaluation methods, such as the one-leg stand test, timed up-and-go test, and Berg balance scale (BBS), often suffer from ceiling effects, which make it challenging to accurately assess differences in balance ability among individuals with moderate or high abilities. To address this, we employed the index of postural stability (IPS) and the modified IPS, which correlate with the BBS and are unaffected by ceiling effects. These indices require specialized equipment such as stabilometers; thus, simpler and more efficient evaluation methods are desirable. We propose estimating the dynamic balance ability by analyzing walking motion using shoes equipped with force sensors to measure the plantar pressure. We developed and validated a compact, lightweight plantar pressure measurement device suitable for shoe integration. We used the device to measure the plantar pressure while walking and to estimate the dynamic balance ability.Finally, a 20-m walking experiment was conducted using the device. Machine learning methods were employed to estimate the dynamic balance ability by processing the plantar pressure data obtained during walking. The model using 16 plantar pressure data points showed the highest estimation accuracy, suggesting the potential of this system for evaluating walking ability in daily life.
In Japan’s a super-aged society, the proportion of individuals requiring long- term care is high. One of the primary factors contributing to this is a decline in walking ability, which results from falls, fractures, frailty, and joint diseases (Cabinet Office, Government of Japan, 2021). Daily assessment of walking ability can facilitate early fall prevention and is expected to improve the quality of life in older adults.
Walking ability is typically measured in controlled environments, such as laboratories equipped with specialized measurement devices such as motion capture systems. However, daily use of specialized environments is challenging. Additionally, previous research has shown that individuals tend to exhibit superior walking performance in laboratory settings than in their
Dynamic Balance Ability Estimation Method Using Plantar Pressure Measurement 97
daily lives (Shah, 2020). Therefore, monitoring the walking ability in daily life is crucial.
In a previous study, we developed a shoe that measures walking data in daily. However, it is difficult to directly assess the walking ability using raw walking data. Thus, we aimed to establish a method for assessing the daily walking ability by linking the walking data with the walking ability using machine learning techniques.
Various kinematic indicators are used to evaluate declines in walking ability. Among these, we focused on the deterioration of the dynamic balance ability, which is a key factor contributing to falls. This study aimed to estimate the dynamic balance ability using a compact and lightweight force-sensor- based plantar pressure measurement device that could be integrated into a shoe for walking ability assessment in daily life. To achieve this, we applied machine learning techniques to analyze the data obtained from the plantar pressure measurement device.
EXPERIMENTS TO CREATE TRAINING DATASETS This experiment was approved by the Ethics Committee for Human Research of Saitama University, a national university corporation (approval no. R6-E-15), and informed consent was obtained from all the participants. Since the experiment required the use of a 27-cm plantar pressure measurement device, participants were selected based on their shoe sizes within 27 ± 1 cm. The study was conducted with ten healthy male participants (24.3 ± 3.0 years old). The average shoe size of the participants was 26.8 ± 0.4 cm.
Measurement of Dynamic Balance Ability As dynamic balance ability indices for the correct labels of the training dataset, we used the index of postural stability (IPS) (Mochizuki, 2000) and modified IPS (MIPS) (Suzuki, 2015), which are measured on a soft surface with the eyes closed. These evaluation indices were designed to prevent ceiling effects, ensuring that individuals with higher abilities did not consistently achieve the maximum scores.
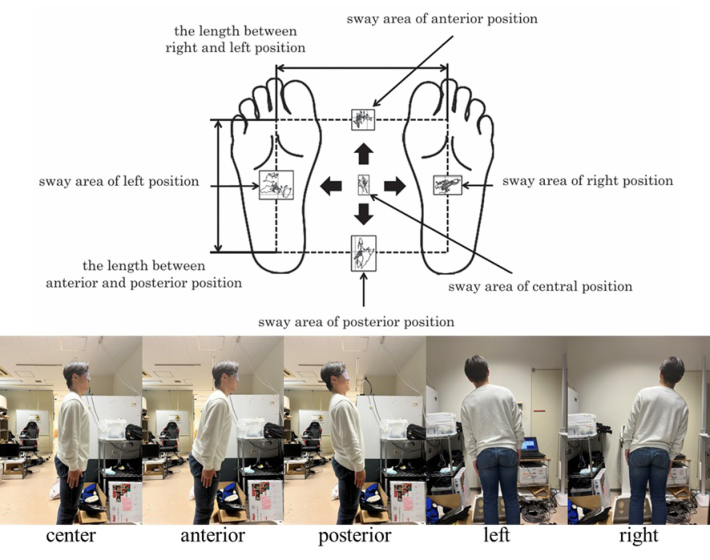
The IPS measurement procedure was as follows: the participants stood in a slightly open stance with the medial sides of their feet parallel and 10-cm apart. The subjects performed center-of-pressure (COP) shifts in the anterior, posterior, left, and right directions on a force plate. Initially, they faced forward and stood still in the position where their posture was the most stable. No visual reference points were used and both arms were relaxed. To measure COP sway in the center of the base of support, data collection began after the initial transient body sway subsided. The COP sway was recorded for 10 s. The participants then shifted their COP forward within the range where they could maintain a stable stance, and another 10-s COP sway measurement was obtained. Similar measurements were obtained for the posterior, right, and left directions. The measurement order was as follows.
Follows: center, anterior, posterior, left, and right. During the measurements, the participants were instructed to maintain a static posture and avoid excessive COP movements, heel lifting, or one-foot lifting.
The total measurement time was 75 s. The first 5-s after the start of each measurement as well as the 5-s during COP shifting were excluded from the analysis because of transient body sway. Equation 1 shows the IPS formula and Figure 1 shows a conceptual diagram of the measurement.
Equation reproduced from the original PDF.
The MIPS measurement procedure followed the same steps as the IPS, but was conducted on a soft mat placed on the force plate while the participant wore an eye mask.
All IPS and MIPS measurements were conducted with the participants wearing socks. Prior to the experiment, the participants received a thorough explanation of the measurement procedures and practiced the trials to ensure proper execution.
Measurement of Foot Pressure Data During Walking We measured the foot pressure data during walking as the input data for the training dataset. Foot pressure data were acquired at a sampling frequency of 100 Hz and transmitted to a PC via Bluetooth.
The experiment was conducted under three walking conditions: a subjectively comfortable walking cadence, slow walking cadence reduced by 20% from the comfortable cadence, and fast-walking cadence increased
Figure 1: Conceptual diagram of IPS measurement.
Dynamic Balance Ability Estimation Method Using Plantar Pressure Measurement 99
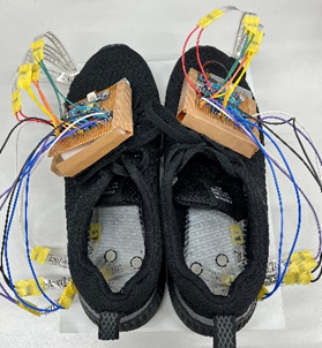
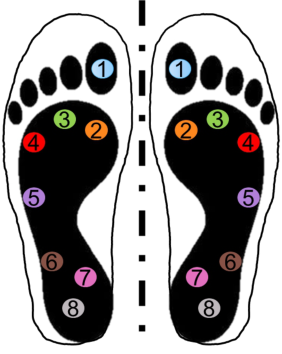
by 20% from comfortable cadence. The participants wore shoes equipped with a foot pressure measurement system, as shown in Figure 2, and walked 20-m under the specified conditions. The measurement locations of the foot pressure sensors are shown in Figure 3. The participants were instructed to start walking from the designated starting position and stop at a point beyond the endpoint.
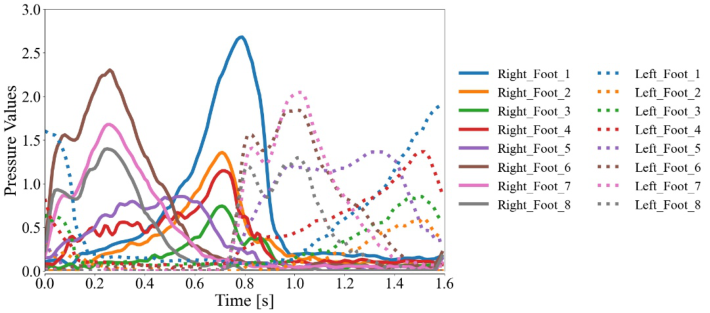
Figure 4 presents an example of foot pressure data for one walking cycle at the measurement locations. The validity of the measurement system was confirmed as initial contact and toe-off were detected at the heel (sensor No. 8) and thumb (sensor No. 1) of both the left and right feet.
Figure 2: Foot pressure measurement device.Figure 3: Sensor position.Figure 4: Example of plantar pressure data for one cycle of walking.
CONSTRUCTION OF DYNAMIC BALANCE ABILITY ESTIMATION MODELS Dataset for Dynamic Balance Ability Estimation
A low-pass filter with a cut-off frequency of 25 Hz was applied to the foot pressure data for noise removal. The foot pressure data were normalized to each participant’s body weight, and the left and right foot data were combined and treated as a single time-series dataset. One walking cycle was defined as the period from initial contact of the right foot to its next contact of the right foot. The first and last walking cycles, corresponding to the acceleration and deceleration phases, respectively, were excluded from the dataset.
Zero padding was applied to align the time axes of the input tensors. Each input data sample comprised time, features, and five walking cycles. For data augmentation, each walking cycle was shifted by one cycle to extract additional samples, which resulted in 275 data samples.
To achieve high-accuracy estimation of the dynamic balance ability from foot pressure data during walking, we created datasets under three conditions to evaluate the impact of different input features on model training: (1) foot pressure data from 16 sensor locations, (2) COP data calculated from 16 foot pressure data points, and (3) total pressure data for each foot derived from 16 foot pressure data points.
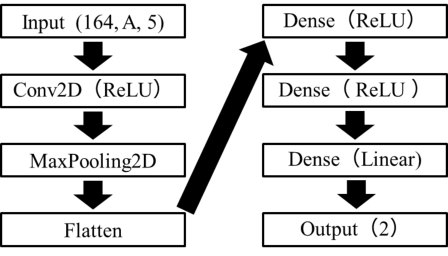
Learning Model The proposed model is a regression model based on a convolutional neural network comprising convolutional, pooling, and fully connected layers to estimate dynamic balance ability (Figure 5). The kernel size of the convolutional layers was set to 20 × A (A is the number of features), and the number of kernels was set to 128. ReLU was used as the activation function for the convolutional and fully connected layers, and a linear function was applied to the output layer. MaxPooling was used for pooling layers.
Dynamic Balance Ability Estimation Method Using Plantar Pressure Measurement 101
The loss function was set to the mean squared error, optimization algorithm was Adam, batch size was 32, and number of epochs was 300. To adjust the learning rate based on the loss transition, ReduceLROnPlateau was employed by varying the learning rate from 0.01 0.0001. The ReduceLROnPlateau monitors the behavior of the loss function and decreases the learning rate when the loss does not improve. In the proposed model, the loss was evaluated every 20 epochs; if no improvement was observed, the learning rate was reduced to 20% of the original value.
Because the available data for verifying the accuracy of the estimation model were limited, stratified k-fold cross-validation, which helps reduce bias in the target variable, was applied for training and validation. Five-fold cross- validation was performed. The MAE and coefficient of determination (R2) were used as evaluation metrics for the test data.
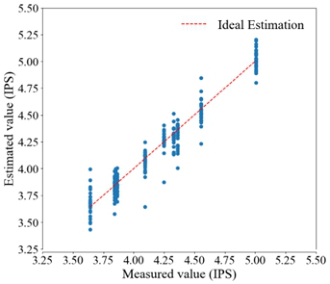
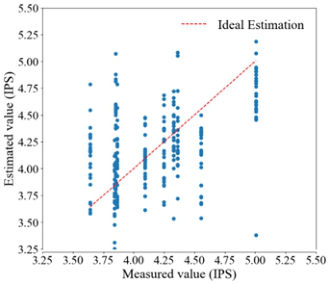
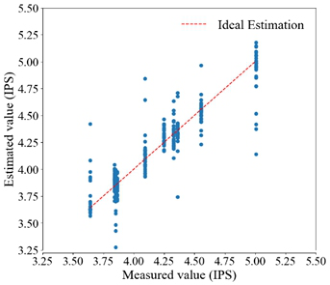
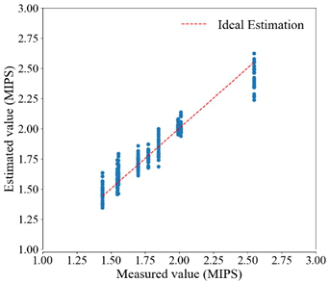
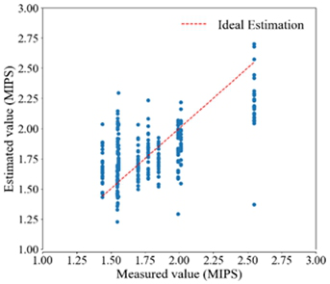
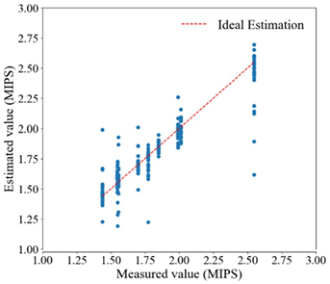
Learning Results For all the models, both the training and validation losses converged to low values. Figures 6, 7, and 8 show the IPS estimation results when the test data were input into each model. Figures 9, 10, and 11 show the MIPS estimation results when the test data were input into each model.
Figure 5: Schematic of the machine learning model.Figure 6: Estimated value of IPS for models created by 16 plantar pressures.Figure 7: Estimated value of IPS for models created by COP.Figure 8: Estimated value of IPS for models created by total pressure of each foot.Figure 9: Estimated value of MIPS for models created by 16 plantar pressures.Table 1: Evaluation of test data.
Table available in the original PDF paper.
MAE R2 16 plantar pressures 0.143 0.698 COP 0.664 -8.34
Continued
Dynamic Balance Ability Estimation Method Using Plantar Pressure Measurement 103
Table 1: Continued
Table available in the original PDF paper.
MAE R2 0.276 -0.124
Total pressure of each foot
Table 1 presents the MAE and R2 values for each test data model. It can be observed from Table 1 that the model created using foot pressure data from 16 sensor locations achieved the lowest MAE and highest R2 value, confirming its relatively high estimation accuracy. In contrast, the other two models exhibited lower accuracies.
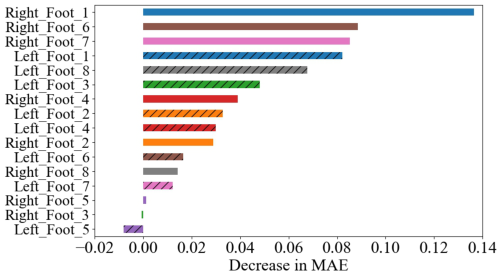
ASSESSING THE VALIDITY OF LEARNING The validity of the training program was also evaluated. The permutation feature importance (PFI) was calculated to assess the importance of the 16 foot pressure sensor locations in learning. The PFI indicates the importance of each feature in the predictive model. It quantifies the increase in estimation error when the values of a feature are shuffled. Features that cause a higher increase in error are considered more important.
PFI Results
Figure 12 illustrates the importance of the 16 foot pressure sensor locations during the learning process. In the model trained using foot pressure data from 16 sensor locations, the thumb (sensor 1) was found to have the highest importance in the estimation. Additionally, the heel regions (sensors 6, 7, and 8) played a significant role. In contrast, the lateral arch region (sensor 5) exhibited a low importance.
DISCUSSION
Dynamic Balance Ability Estimation Models The model constructed using the plantar pressure data from 16 locations exhibited the highest estimation accuracy, as shown in Table 1. This finding suggests that the spatial distribution of plantar pressure is crucial for estimating the dynamic balance ability. Therefore, further subdivision of the plantar regions for analysis may improve the estimation accuracy.
In contrast, the model built using COP data, which represents the pressure centroid, demonstrated lower accuracy owing to the lack of spatial distribution information, as indicated in Table 1. This suggests that relying solely on temporal features, which may not sufficiently capture nonlinear movement, is insufficient. Incorporating the overall pattern of the COP trajectories within a gait cycle as an input to the model may enhance the estimation accuracy.
Similarly, the model constructed using the total pressure data for each foot exhibited limited effectiveness owing to the absence of localized pressure distribution information. Because simply summing the total pressure fails to capture meaningful features, introducing characteristics such as anterior- posterior pressure ratios and left-right asymmetry may serve as useful
indicators of center-of-mass shifts and stability during ground contact, potentially improving the estimation accuracy.
Figure 10: Estimated value of MIPS for models created by COP.Figure 11: Estimated value of MIPS for models created by total pressure of each foot.Figure 12: PFI scores for each position of plantar pressure.
Dynamic Balance Ability Estimation Method Using Plantar Pressure Measurement 105
Assessing the Validity of the Learning Model The PFI results indicated that the thumb region (position 1) was the most important. Because the thumb contributes to propulsion generation during push-off and facilitates efficient center-of-mass movement, it is likely associated with dynamic balance ability.
Additionally, the heel regions (positions 6, 7, and 8) play a crucial role in ensuring stability during ground contact, suggesting a strong relationship with the dynamic balance ability. In contrast, the lateral arch (position 5) had a minimal direct impact on the dynamic balance ability in the healthy individuals analyzed in this study. However, it is necessary to consider data focusing on pathological conditions or abnormal gait patterns, where their influence may become more pronounced.
Regardless of the specific plantar pressure locations, the PFI results showed only a slight decrease in the estimation accuracy, indicating that the entire plantar surface contributes to supporting the body. This suggests that all regions are involved in dynamic balance ability.
CONCLUSION
In this study, we aimed to evaluate the walking ability in daily life by measuring the foot pressure during walking using a foot pressure measurement system and estimating the dynamic balance ability. The model created using 16 foot pressure data points achieved the highest estimation accuracy for dynamic balance, suggesting its potential for evaluating the walking ability in daily life.
REFERENCES
Cabinet Office, Government of Japan. (2021) Annual Report on the Ageing Society: 2021 Edition (Full Report). Website: https://www.stat.go.jp/data/topics/ topi1420.html. Mochizuki, H., and Minejima, T. (2000). Reliability and validity of postural stability
assessment indices using a stabilometers, Physical Therapy Volume 27, No. 6. Shah, V. V., McNames, J. and Mancini, M. (2020). Laboratory versus daily life gait characteristics in patients with multiple sclerosis, Parkinson’s disease, and matched controls, Journal of NeuroEngineering and Rehabilitation Volume 17, No. 1. Suzuki, Y., Nakata, Y., Kato, H., Tanabe, Y., Iwabuchi, S. and Ishikawa, K. (2015).
Association between age and dynamic balance capability assessed by use of force plates, Japanese Journal of Physical Fitness and Sports Medicine Volume 64, No. 4.
LISTED IN THE AHFE DIGITAL BOOKSTORE CATALOGUE
Explore the complete digital volume
Affective and Pleasurable Design
Read this individual research paper free through the original publisher, or explore the full digital proceedings book.
ISBN 978-1-964867-40-3
Explore this ISBN in the AHFE Bookstore ↗Listed in the July 2026 bookstore catalogue; search by ISBN to confirm current availability · Digital book purchase optional