Alan Zheng, Carlos Gonzalez (2025). Climate Change Pulse: A RAG-Driven Interactive Platform for Exploring Disaster-Linked Climate Sentiment on Social Media. In: Artificial Intelligence and Social Computing. AHFE Open Access, vol. 163, pp. 232–240. https://doi.org/10.54941/ahfe1006274
Public engagement with climate change tends to peak during extreme-weather events and dissipate soon thereafter, yet the quantitative relationships among spatial proximity, temporal context, and ideological stance remain under-explored. We present Climate Change Pulse (https://climatechangepulse.org), an open-access web platform that unifies a geovisual dashboard of 15 million climate-related tweets with 9094 EM-DAT disaster records and augments the interface with an agentic Retrieval-Augmented Generation (RAG) chatbot. The system allows users to pose natural-language questions (e.g., “What was climate-change sentiment around the 2021 German floods?”) and receive answers drawn dynamically from two in-memory SQLite databases.Research Questions: RQ1. How does spatial proximity to a disaster correlate with the polarity of climate-related tweets?RQ2. How do sentiment trends differ across stance categories (believer, neutral, denier) in the days surrounding an event?RQ3. Can an agentic RAG loop provide reliable conversational access to large, tabular climate datasets?System Architecture:A large-language model (LLM) receives database schemas plus the user prompt, generates SQL queries, and validates them through a three-retry error-feedback loop. A timeline widget enables year-by-year navigation, while selecting a disaster overlays the associated tweet cluster and surfaces embedded tweets for qualitative inspection.Experimental Design:Tweets were analysed in three concentric distance bands (≤ 500 km, 500–1 000 km, ≥ 1 000 km) and three temporal windows (1, 3, and 7 days before/after impact) for 730 climate-relevant disasters between 2006 and 2019. Sentiment and stance labels were taken from the publicly released Climate-Change-Twitter Dataset. Qualitative heat-maps and mean-sentiment plots were generated to visualise proximity and stance effects. The RAG component was exercised with a battery of representative user queries to confirm syntactic correctness and conversational fallback behaviour.Findings:Tweets originating in the ≤ 500 km band consistently expressed more negative sentiment than those posted at greater distances, supporting the intuition that proximity amplifies emotional response.Across all temporal windows, denier tweets were markedly more negative than believer or neutral tweets; the neutral category displayed the most stable sentiment.The agentic RAG loop successfully returned validated SQL and, when faced with an unanswerable request, provided an explanatory fallback, illustrating its suitability for interactive exploration.Contributions:Interactive AI for social computing: First integration of geovisual disaster analytics with a RAG chatbot, enabling conversational interrogation of multimillion-record climate corpora.Empirical insight: Qualitative evidence linking disaster proximity, ideological stance, and sentiment dynamics across thirteen years of Twitter data.Open science: Source code, processed datasets, and prompt templates released under an MIT licence to facilitate replication and extension (https://github.com/CCOh125/climatechangepulse.github.io).Future WorkOngoing efforts include real-time ingestion of live disaster feeds, fine-tuning domain-specific language models for richer affective nuance, and controlled user studies to assess decision-support value in crisis-communication contexts.
Climate change is an urgent global crisis driven by human activity, intensifying disasters like floods, droughts, hurricanes, and heatwaves, causing extreme temperatures, rising seas, and irreversible damage. The IPCC predicts warming could reach 3.2
C by 2100 (National Research Council, 2011; Thunberg, 2023). Events like Hurricane Sandy ($8 billion climate- related damages) and Europe’s 2003 heatwave (70,000 deaths) highlight these risks (Okuyama, 2007). Limiting warming below 2
C could save millions of lives in the U.S. alone.
Technology offers tools like data analysis to understand people’s views on critical issues (Hao et al., 2011; Li et al., 2022). For instance, how does proximity to climate disasters influence people’s emotions or sentiments, and what can social media data from platforms like X (formerly Twitter) reveal?
Climate Change Pulse: A RAG-Driven Interactive Platform 233
Answering these questions helps educate the public and shape better policies (Kim et al., 2016).
Current tweets indicate promising areas for further exploration. Unlike structured surveys, social media encourages personal and spontaneous expression, capturing deeper emotional reactions. Social media platforms also tend to attract younger, more diverse users. According to Pew Research Center (2023), “a third of teens use at least one of five major platforms almost constantly,” underscoring the value of social media data for richer insights.
We developed Climate Change Pulse (climatechangepulse.org) visualizes climate disasters on a global map, linked to relevant tweets. Users can explore disasters by year and view tweets within a selected radius, like 1000 miles from an event. Our research examines the relationship between disasters and public sentiment, utilizing data from the “Climate Change Twitter Dataset” (Effrosynidis et al., 2022). This dataset contains over 15 million climate-related tweets spanning 13 years, capturing variables such as stance, sentiment, gender, and disaster types.
Extending our prior work (Zheng & Gonzalez, 2025), this paper introduces an interactive, conversational RAG system providing validated access to extensive climate datasets. Our enhanced platform addresses previous limitations by emphasizing detailed stance and temporal analysis, user interaction, decision-making support, and human-centered design.
RELATED WORK
El Barachi et al. (2021) employed Bi-directional LSTM models primarily for data collection and sentiment classification of climate-related tweets. In contrast, our project analyzes pre-labeled datasets, allowing deeper insights without data collection constraints. Lu et al. (2015) visualized geographic sentiment trends during disasters but did not incorporate user interactivity or ideological stance analysis. We extend their approach through an accessible interface that highlights differences between climate change deniers and believers. Mouronte-López and Subirán (2022) utilized sentiment (VADER, TextBlob) and topic modeling (LDA) to analyze climate-related Twitter conversations, noting generally negative sentiment. Our system enhances their findings by integrating interactive geovisual analytics to examine spatial and temporal sentiment shifts associated with disasters.
Inspired by Singh et al.’s survey of agentic RAG frameworks (2025), we transitioned from traditional document-based methods to a dynamic, iterative approach that generates SQL queries against large tabular datasets. Drawing lessons from existing methods, our work moved beyond the limitations of traditional RAG and fixed data collection by adopting an agentic RAG framework for dynamically generating SQL queries on our static, tabular disaster and tweet data. This strategic shift makes use of the iterative nature and multi-domain capabilities of agentic systems, enabling a more interactive and behavior-focused conversational chatbot than approaches centered on basic sentiment classification or static visualizations.
234 Zheng and Gonzalez
CHALLENGES AND DESIGN CONSIDERATIONS World Map Interface Integration
A key challenge was integrating the dataset with the interactive world map. Country names in our datasets didn’t always match those in the map’s dropdown, causing pairing issues. Data formatting inconsistencies, especially dates, required standardization for JavaScript compatibility. Additionally, maintaining a dynamic map—regularly updating disaster icons—posed technical difficulties. Elon Musk’s acquisition of Twitter further complicated matters, as direct access to tweet content became unavailable.
Twitter Data Accessibility Another issue was structuring and ensuring the completeness of Twitter and disaster data. Missing latitude, longitude, or date information prevented proper visualization. Preprocessing was necessary—parsing dates, grouping records, and filtering invalid entries—but excessive filtering risked losing significant data. We needed strategies to identify and correct these gaps to retain as much usable data as possible.
RAG Architecture When deciding on the architecture of our LLM, we explored different methods, such as large-context windows and fine-tuned LLMs. We opted for a RAG-based solution using LangChain framework, instructing the model to act as a “data analyst” to interact with the dataset. Due to the complexity of the task and the limitations of accessible data, training and fine-tuning a model seemed less promising compared to the RAG-based solution, where all we need to do is instruct the LLM to generate queries to index our data. We also considered the advantages and drawbacks between an in-memory pandas dataframe versus an out-of-memory SQLite database. Due to the limitations of available cloud-computing resources and the performance differences for this specific task, designing an LLM to generate SQL queries made more sense for the task of retrieving data efficiently and accurately. The LangChain framework provided essential components for document loading, text splitting, embeddings, and chain orchestration, enabling seamless integration between the conversational interface and our structured datasets.
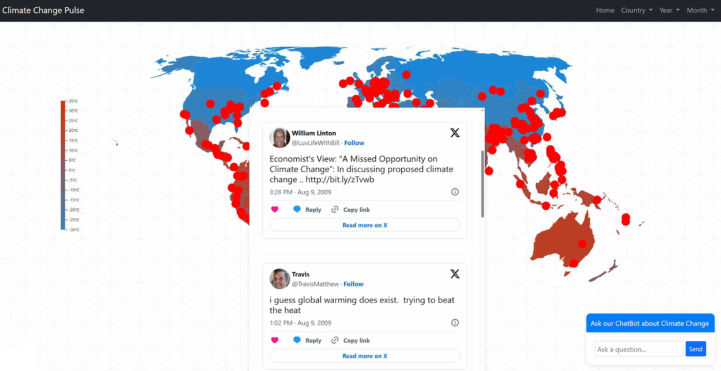
SYSTEM OVERVIEW The web application features an interactive map visualization combined with a conversational chatbot. Users can select different years to view variations in tweet sentiment and disaster severity globally. Clicking on a disaster displays relevant tweets based on proximity and timing, and users can further interact by asking context-specific questions. See Figure 1 for an example of the interactive map UI.
Tweets and disasters were organized by attributes such as year and country, using map objects to efficiently index tweets by ID. We addressed missing geospatial data by leveraging the Google Maps API, filling in latitude and
Climate Change Pulse: A RAG-Driven Interactive Platform 235
longitude coordinates based on disaster locations, and excluding tweets lacking sufficient location data.
We employed Pandas for detailed data analysis and visualization, exploring sentiment patterns in relation to disaster severity. The interface aims to help users visually assess whether proximity to disasters correlates with changes in climate-related sentiment.
Interactive Map Interface The web interface visually represents countries by temperature—cooler in blue and hotter in red—and marks disasters with flickering red dots. Hovering provides disaster details, including death tolls, while clicking opens a scrolling tweet window. Tweets are embedded via the embedTweets function, configured to hide replies, images, polls, and center-aligned in a light theme.
Figure 1: Climate change puluse main interactive map visualization UI.
Geospatial Data Processing Due to incomplete geospatial disaster data, we used Google Maps API to retrieve and average missing coordinates based on disaster locations. Special characters were handled through proper encoding. The corrected coordinates were then reintegrated into our dataset.
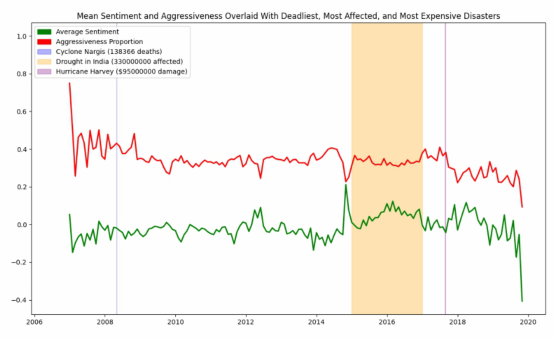
Data Analysis and Visualization Our analysis aimed to determine whether disasters prompt increased regional climate discussions. We used exploratory methods, aggregating and filtering data to highlight trends. Matplotlib was employed to create visualizations, overlaying mean sentiment and aggressiveness scores with key disaster events, emphasizing peak disaster occurrences by severity and impact.
236 Zheng and Gonzalez
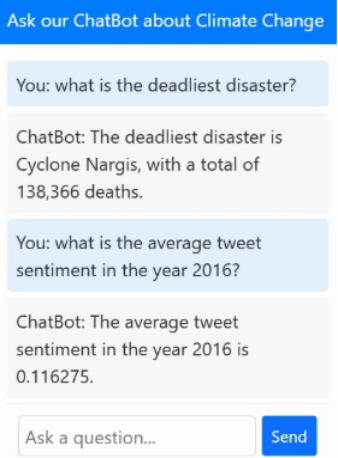
Agentic RAG System The AI feature is a contextually-aware RAG-based system, where the user can ask questions about the datasets and receive accurate up-to-date information about the data. See Figure 2 for an example. We first load the databases in-memory using SQLite, retrieving the column names and rows from the original source files, and loading them into two separate databases. The program checks the database to determine which one is appropriate to use, given some user query, to then generate a SQL query. Next, the system validates the SQL expression, retrying if it is invalid or cannot be parsed. We provide error handling for instances such as these, ensuring the LLM can revise its mistakes upon future iteration. The LLM is presented with metadata from the databases, such as the column names, data types, and granularity to ensure accurate retrieval of information. We ultimately are looking at the use case of LLMs to query and interact with large databases, exploring the possibilities of LLMs assisting distributed systems to answer users’ questions via an agentic framework.
Figure 2: Example of a user and chatbot conversation with agentic RAG feature.
We ask the LLM to generate a SQL query based on the user’s query and dataset of choice. We call the answer_with_table function which takes in the user query and returns a SQL expression that retrieves the information required to answer the user query. The LLM could fail to retrieve information because of errors, due to a nonsensical query received from the user (e.g., ‘Please tell me about my finances.’), or a fault from the LLM (e.g., We index from a column which does not exist in the database). We consider these scenarios by feeding the LLM error feedback and modify the prompt to attempt to generate a new query. The retry_count variable keeps track
Climate Change Pulse: A RAG-Driven Interactive Platform 237
of the number of attempts so they do not exceed max_retries. This process continues until we either successfully retrieve information from the database or until we fall back to some error. The LLM prompts the user with updated information about their query, with the client receiving a textual response.
EXPERIMENT ANALYSIS: SENTIMENT, PROXIMITY, & STANCE In the experiment, we aimed to explore how distance and time windows around natural disasters influence public sentiment on climate change as expressed on Twitter. Using the Climate Change Twitter Dataset (Effrosynidis et al., 2022), which includes over 15 million tweets related to climate change, we filtered tweets based on proximity and time relative to disasters and calculated average sentiment scores through descriptive analysis. Control data is sourced from the same dataset, ensuring consistency in tweet sentiment, stance, and disaster context.
This setup allows us to observe how sentiment varies with proximity and time relative to disasters. For example, do tweets closer to disasters show stronger negative sentiment? Does sentiment become more negative as time progresses after a disaster? See Figure 3 for an example. To test the impact of distance and time windows, the experiment systematically varies these parameters. Distance thresholds are set at 500 km, 1000 km, and 2000 km, while time windows are defined as 1, 3, and 7 days before and after a disaster. These ranges are chosen to reflect realistic geographical and temporal scopes of disaster impact.
Figure 3: Line plot of Twitter sentiment and aggressiveness data and disasters of interest.
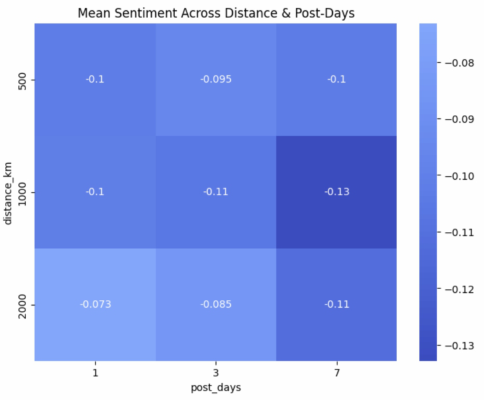
The analysis reveals several key insights about the relationship between disasters and public sentiment on Twitter. First, sentiment becomes more negative as the distance threshold increases, suggesting that tweets closer to disaster locations reflect stronger emotional responses. This aligns with the expectation that proximity to a disaster intensifies public concern and emotional expression. See Figure 4 for details.
238 Zheng and Gonzalez
Second, the time window significantly influences sentiment. Pre-event sentiment becomes more negative as the number of days before a disaster increases, potentially reflecting growing anxiety or anticipation. Post-event sentiment also trends more negatively over time, possibly due to prolonged discussions or the accumulation of negative news.
Figure 4: Correlation matrix of the mean sentiment across distance (km) and days post- disaster.
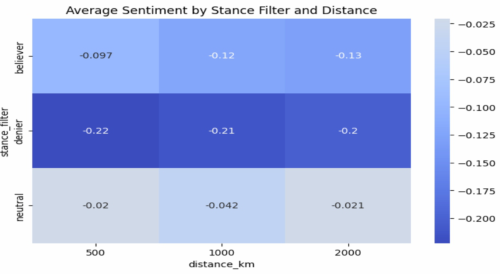
A surprising finding is the stark contrast in sentiment between different stances. Deniers exhibit the most negative sentiment, which may reflect frustration or skepticism toward climate change discourse. Believers, while also negative, show less extreme sentiment, possibly indicating a more measured or concerned tone. Neutral users, as expected, exhibit the least negative sentiment, suggesting a lack of strong emotional investment (see Figure 5).
Figure 5: Correlation matrix of the average sentiment by stance and distance.
Climate Change Pulse: A RAG-Driven Interactive Platform 239
The biggest effect on results appears to be the combination of distance and stance. Tweets closer to disasters from deniers show the most negative sentiment, while neutral users remain relatively unaffected. This suggests that emotional responses to disasters are not only influenced by proximity but also by individuals’ pre-existing beliefs about climate change.
Overall, the experiment highlights the importance of carefully selecting distance and time parameters to capture meaningful sentiment patterns. It also underscores the role of stance in shaping public discourse around disasters, offering valuable insights for targeted communication strategies.
Our most significant findings showed that tweets closer to disasters tend to have stronger negative sentiments, highlighting the emotional impact of proximity. Sentiment also became more negative as time progressed after a disaster, reflecting prolonged concern. Interestingly, climate change deniers exhibited the most negative sentiment, even more than believers, which was unexpected. This suggests emotional responses are influenced by both proximity to disasters and pre-existing beliefs. The experiment revealed complex interactions between distance, time, and user stance through exploratory data analysis.
DISCUSSION & CONCLUSION The integration of an agentic RAG chatbot with geovisual disaster analytics contributes to AI-driven social computing. By enabling conversational, validated access to large-scale climate and disaster datasets, the platform helps decision-makers, communicators, and the public explore links between disasters, sentiment, and stance. Its interactive interface lowers barriers for non-technical users, supports future real-time crisis communication, and aligns with human factors principles by emphasizing usability, accessibility, and actionable insight.
A potential limitation in the analysis is the selection of distance and time windows around disasters. If the chosen thresholds (e.g., 500 km, 1000 km, or 2000 km) are too narrow or too broad, they might miss key sentiment patterns or dilute meaningful insights. Future work should include formal statistical validation to confirm these observed patterns and their significance. Also we have not yet conducted formal usability testing or statistical validation of our findings. Many tweets lack geospatial data, limiting coverage, and embedded tweet functionality may miss older or deleted posts. Current sentiment analysis also falls short in capturing emotional nuance and context.
Future work will include usability studies, statistical validation, real- time data ingestion, domain-specific language model fine-tuning, and impact assessments on public engagement and policy-making.
In summary, Climate Change Pulse bridges climate discourse and real- world disaster impact through interactive AI and data visualization. By mapping tweets alongside disasters and enabling conversational analysis, the platform reveals how proximity and stance shape public sentiment— offering valuable support for crisis communication and policy insight in a human-centered framework.
240 Zheng and Gonzalez
ACKNOWLEDGMENT
The authors would like to thank Effrosynidis et al. for providing the Climate Change Twitter Dataset that made this research possible. We also acknowledge the open-source community for the various tools and libraries used in this project. We thank Professor Yu Sun for his advice and guidance throughout the project.
REFERENCES
Effrosynidis, D., Karasakalidis, A. I., Sylaios, G., & Arampatzis, A. (2022). The climate change Twitter dataset. Expert Systems with Applications, 204, 117541. El Barachi, M., AlKhatib, M., Mathew, S., & Oroumchian, F. (2021). A novel
sentiment analysis framework for monitoring the evolving public opinion in real-time: Case study on climate change. Journal of Cleaner Production, 312, 127820. Hao, M., Rohrdantz, C., Janetzko, H., Dayal, U., Keim, D. A., Haug, L., & Hsu, M. C. (2011). Visual sentiment analysis on Twitter data streams. 2011 IEEE Conference on Visual Analytics Science and Technology (VAST), 277–278. IEEE. Kim, E. H. J., Jeong, Y. K., Kim, Y., Kang, K. Y. and Song, M. (2016). Topic-based
content and sentiment analysis of Ebola virus on Twitter and in the news. Journal of Information Science, 42(6), 763–781. Li, N., Yang, J., Ren, L., Qin, G. and Li, K. (2022). Review on visualization technology in simulation training system for major natural disasters. Natural Hazards, 112(3), 1851–1882. Lu, Y., Hu, X., Wang, F., Kumar, S., Liu, H., & Maciejewski, R. (2015). Visualizing
social media sentiment in disaster scenarios. Proceedings of the 24th International Conference on World Wide Web Companion (WWW ‘15 Companion), 1211– 1216. Mouronte-López, M. L. and Subirán, M. (2022). What do twitter users think about climate change? Characterization of twitter interactions considering geographical, gender, and account typologies perspectives. Weather, Climate, and Society, 14(4), 1039–1064. National Research Council (2011). Advancing the science of climate change.
National Academies Press. Okuyama, Y. (2007). Economic modeling for disaster impact analysis: Past, present, and future. Economic Systems Research, 19(2), 115–124. Pew Research Center. (2023, December 11). Teens, Social Media and Technology
2023. Singh, A., Ehtesham, A., & Kumar, A. (2025). Agentic retrieval-augmented generation: A survey on agentic RAG. arXiv preprint arXiv:2501.09136. Thunberg, G. (2023). The Climate Book. New York, NY, USA: Penguin Press. Zheng, A., & Gonzalez, C. (2025). Climate Change Pulse: AI-Driven Social Media
Sentiment Analysis for Disaster Impact. Proceedings of the 6th International Conference on NLP & Information Retrieval (NLPI, 2025).
LISTED IN THE AHFE DIGITAL BOOKSTORE CATALOGUE
Explore the complete digital volume
Artificial Intelligence and Social Computing
Read this individual research paper free through the original publisher, or explore the full digital proceedings book.
ISBN 978-1-964867-39-7
Explore this ISBN in the AHFE Bookstore ↗Listed in the July 2026 bookstore catalogue; search by ISBN to confirm current availability · Digital book purchase optional