Hisako Kobayashi, Hiroyoshi Kiku, Ryo Sawada (2024). Fundamental Study on Requirements for Old RC Piers to Continue to be used without Seismic reinforcement. In: Sustainable Construction in the Era of the Fourth Industrial Revolution. AHFE Open Access, vol. 149, pp. 103–110. https://doi.org/10.54941/ahfe1005279
Many older RC piers in Japan have stepped section (referred to as the cut-off section) where the amount of longitudinal reinforcement decreases in response to cross-sectional forces. In such piers, the cover concrete may delaminate at the cut-off section during a major earthquake.When damage progresses at the cut-off section of the axial rebar, RC piers are deformed so that they bend above the cut-off section. RC piers damaged at the cut-of section have inferior deformation performance compared to those damaged at base. Therefore, it is now a common design practice to avoid damage at the cut-off section of piers.In the current Japanese design method, the anchorage length of steel bars anchored in the middle of piers should be about 50φ, or axial steel bars should not be anchored in the middle of piers. In the case of existing piers where these design methods are not applied, the cut-off section are reinforced by wrapping steel plates or other materials. In this study, cyclic positive and negative loading tests were conducted on pier specimens with cut-off section, and dynamic response analysis was conducted for each soil type based on the test results.The analysis results showed that non-linear response spectrum were obtained for different yielding positions, and that response seismic yielding coefficient could be generally evaluated. This shows that for a given natural period and seismic yielding coefficient, it is possible for piers to withstand a large earthquake even if they yield at cut-off section.
In RC piers, the amount of axial rebar reinforcement is sometimes reduced in the middle of the pier to accommodate the cross-sectional forces. The portion where the amount of axial rebar is reduced is called the “cut-off section”. Generally, piers with cut-off section are designed so that damage does not occur at cut-off section but at the base of the pier.
In Japan, the 1978 Miyagi-Ken-Oki Earthquake damaged the pier level in a railroad structure, and as a lesson learned, the 1983 Building Design
Standard established a regulation on the anchorage length of tensile steel bars. Piers with cut-off section based on the pre-1983 design method have been reinforced to prevent them from being damaged at cut-off section.
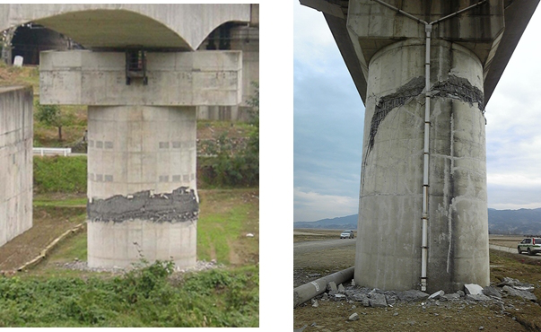
Figure 1: Damage to RC piers after earthquake.
However, it is difficult to carry out many seismic reinforcement works at once because piers located in rivers tend to be constructed during drought periods and there are many temporary structures, and economic and time constraints tend to be severe.
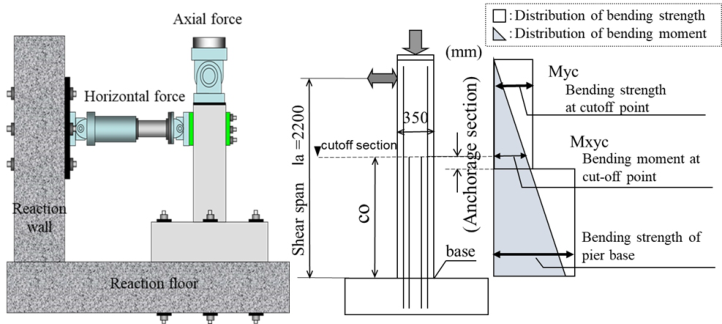
The authors considered that early restoration might be possible if the dam- age at cut-off section was relatively minor, so they constructed a pier specimen that induces damage at cut-off section and conducted static positive-negative horizontal cyclic loading tests (see Figure 2).
Figure 2: Static cyclic loading test and specimen Images.
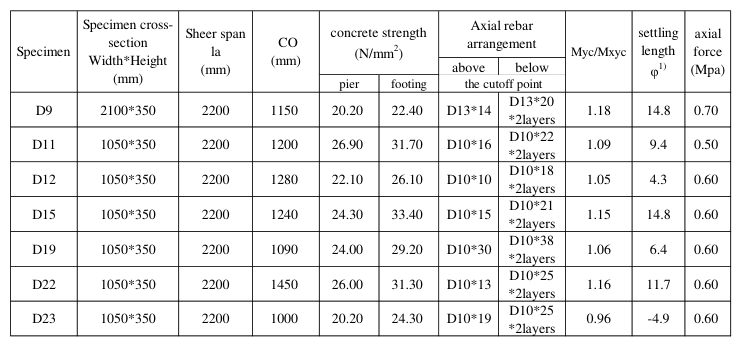
Table 1 shows the specimen specifications for the static cyclic loading tests. The specimens were set to have a high flexural shear strength ratio of 1.8
Fundamental Study on Requirements for Old RC Piers to Continue 105
or higher to ensure a certain degree of deformation performance even after damage at cut-off section (Ishibashi et al., 2000).
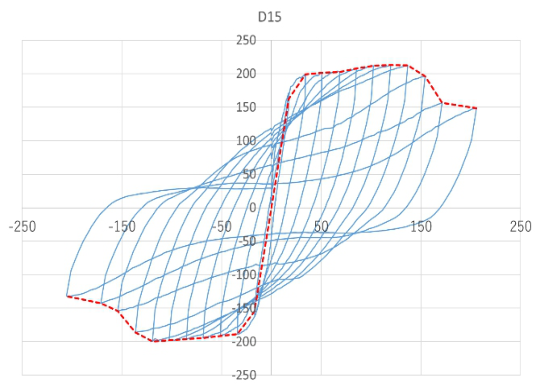
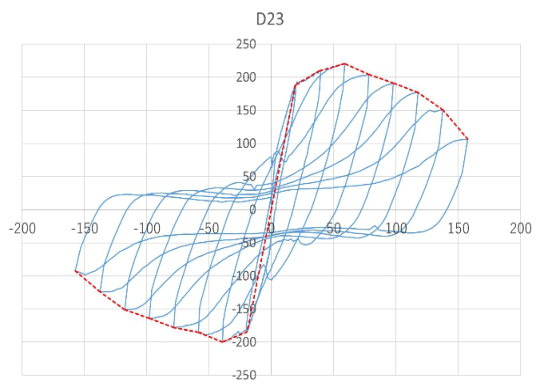
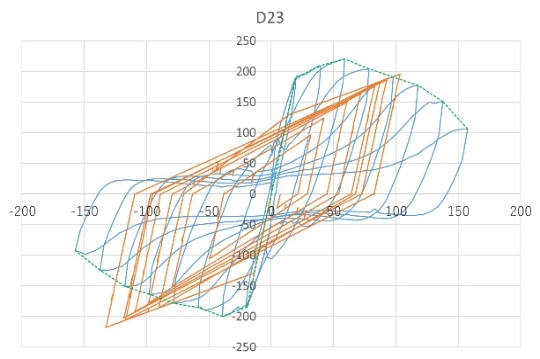
DYNAMIC RESPONSE ANALYSIS BASED ON TEST RESULTS From the cyclic loading tests, two yielding patterns were obtained: one yield- ing at cut-off section and the other yielding at base. Figure 3 shows the load- displacement relationship of the specimen that yielded at base, and Figure 4 shows the load-displacement relationship of the specimen that yielded at cut-off sections. Figure 3 and Figure 4 were considered to approximate the Clough and bilinear models, respectively, based on their envelopes.
Table 1. Specimen specifications.
1) Diameter of axial rebar (mm)
Figure 3: Load-displacement relationships (Type-1 Yield at base).Figure 4: Load-displacement relationships (Type-2 Yield at cut-off section).
The specimen yielding at base holds the maximum load for a certain period of time, whereas the specimen yielding at cut-off section holds the maximum load for a shorter period of time and the load drops faster.
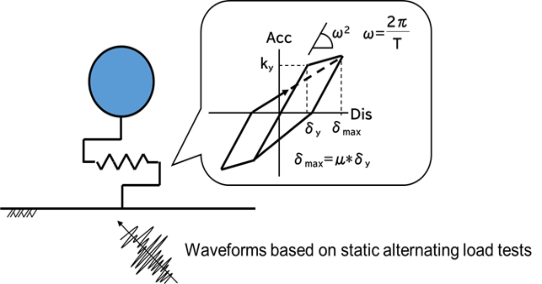
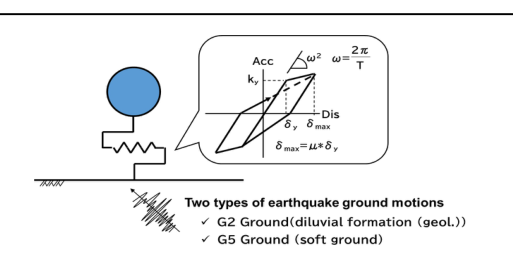
Therefore, for the two yielding patterns, the average values of the speci- men’s yield seismic intensity, damping constant, natural period, and ratio of the second slope to the initial slope were taken, and the response analysis with seismic waves was conducted using the Clough model and the bilinear model (see Figure 5).
Figure 5: 1-DOF elasto-plasticresponse analysis.
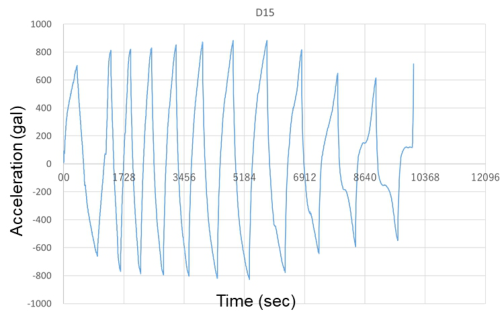
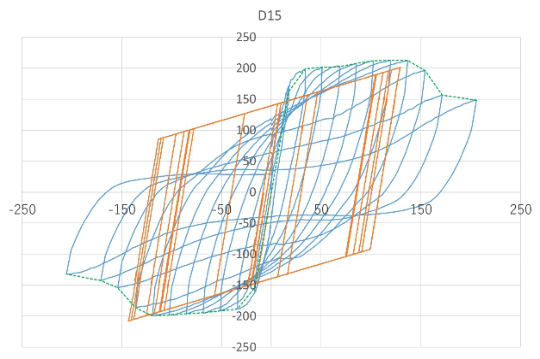
First, a dynamic analysis was conducted using the calculated acceleration and time of the static cyclic loading test of the specimen as time history wave- forms for analysis. (MLIT Railway Bureau, 2012) An example of a waveform is shown in Figure 6. The load-displacement relationship obtained from the experiment and the results of the analysis are shown in Figure 7 and Figure 8.
Fundamental Study on Requirements for Old RC Piers to Continue 107
Figure 6: Time history waveform for analysis (Specimen D15).Figure 7: Load-displacement relationships (Type-1 Yield at base).Figure 8: Load-displacement relationships (Type-2 Yield at cut-off section).Figure 9: 1-DOF elasto-plasticresponse analysis.Table 2. Test and analysis results.
Next, response analysis due to seismic motion was conducted (see Figure9). The analysis was a one-mass dynamic analysis for two types of ground surface design earthquake motion: diluvial formation and soft ground. The seismic waves used in the analysis were the surface design seismic motions for each ground type used in seismic design of railroad structures in Japan. The seismic waves used in this study were set as those with the highest intensity.
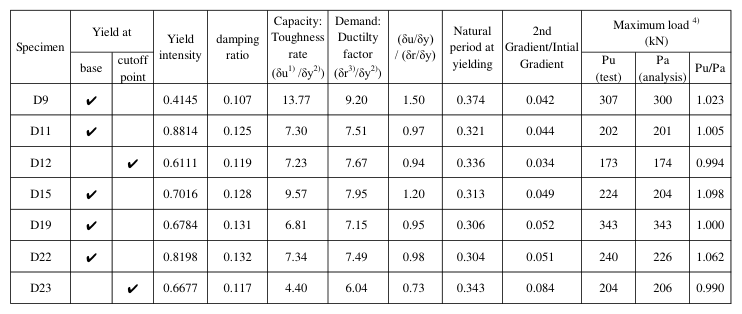
Table 2 shows the test and analysis results. Seismic design in Japan determines the following. Ductility factor µ < toughness rate: safe, no collapse. Ductility factor µ > toughness rate: dangerous, will collapse.
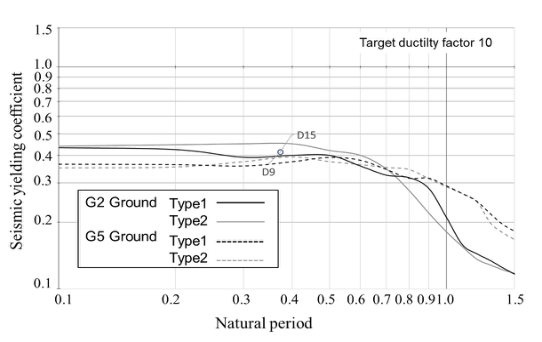
NON-LINEAR RESPONSE SPECTRUM BY GROUND TYPE Non-linear response spectrum for the two yielding patterns (Type 1: yield at base, Type 2: yield at cut-off section) obtained from the analysis are shown in figure 10. Figure 10 shows shows the results of the analysis with a target ductility factor of 10 (µ10). For D9 and D15, ductility factor is lower than the experimental toughness rate when the target ductility factor is set to 10 (see Table 2). For the other specimens, ductility factor exceeds the toughness rate.
Fundamental Study on Requirements for Old RC Piers to Continue 109
Figure 10: Non-linear response spectrum µ10.
Target ductility factor is set at 10 because the seismic design of railroad structures in Japan currently aims for a target ductility factor of 10. In other words, a target ductility factor of 10 is considered to be an index that can withstand a large-scale earthquake.
The points shown in Figure 10 are test specimens D9 and D15. The two points are close in natural period and almost overlap, but they are almost on the line of G2 ground of Type 1. From this, it can be read that D9 and D15 almost satisfy the target ductility factor of 10 in G2 soil.
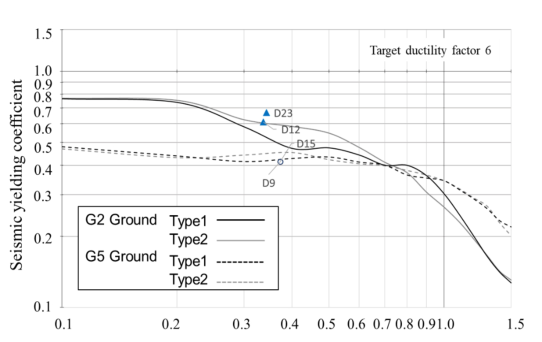
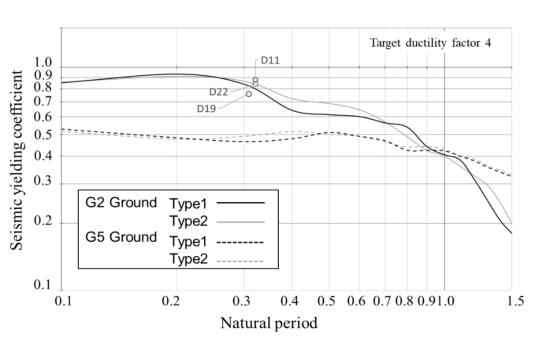
Figure 11 shows non-linear response spectrum when the target ductility factor is set to 6 (µ6). Type 1 and Type 2 specimens are indicated by ⃝and ▲, respectively. When the target ductility factor is set to 6, D12 overlaps the line of G2 ground of Type 2. Although D12 is a specimen yielded at cut-off section, the results of this analysis suggest that it may not collapse even in a large-scale earthquake if the target ductility factor is set to 6.
From the nonlinear response spectrum with target ductility factor of 10, the yield seismic intensity is lower in G2 Ground with natural periods of 0.1 to 0.6 than in Type 2 soils. In other words, to meet the target ductility factor of 10, the non-linear response spectrum must be higher at the cut section than at the root yielding of the piers. On the other hand, when the natural period exceeds 0.8, the yield seismic intensity is reversed.
G5 ground can be brought closer to the G2 ground by surface ground improvement. If the seismic performance can be diagnosed by non-linear response spectrum, the seismic reinforcement method by surface ground improvement can be applied instead of seismic reinforcement of piers.
In Japan, large-scale earthquakes have been occurring frequently in recent years, and the standards for seismic reinforcement have become stricter. As a result, railroad companies have many structures that require seismic rein- forcement, and since it is not possible to perform seismic reinforcement work all at once, reinforcement is prioritized.
Although this is a basic study, we intend to conduct further research because if all piers that yield at cut-off section no longer need to be seis- mically reinforced, it will help to reduce manpower and costs, as well as to realize decarbonization. The present analysis was based on a limited natural period and number of specimens. Future studies should take into account the results of a wider range of tests and actual structures.
REFERENCES
Ishibashi, T. Tsuyoshi, T. Kobayashi, K and Kobayashi, M. (2000). “An Experimental Study on Damage Levels and Repairing Effects of Reinforced Concrete Columns Subjected to Reversal Cyclic Loading with Large Deformations”. Journal of JSCE, Vol. 47, No. 648, pp. 55–69. MLIT (Ministry of Land, Infrastructure, Transport and Tourism) Railway Bureau
(2012), “Non-linear Response Spectrum of Bridges and Viaducts”, Railway Technical Research Institute (Ed.), Design Standards for Railway Structures and Commentary (Earthquake-resistant design), pp. 362–373.
LISTED IN THE AHFE DIGITAL BOOKSTORE CATALOGUE
Explore the complete digital volume
Sustainable Construction in the Era of the Fourth Industrial Revolution
Read this individual research paper free through the original publisher, or explore the full digital proceedings book.
ISBN 978-1-964867-25-0
Explore this ISBN in the AHFE Bookstore ↗Listed in the July 2026 bookstore catalogue; search by ISBN to confirm current availability · Digital book purchase optional