Rakesh Gudipudi, Sandra Nguyen, Doina Bein, Sudarshan Kurwadkar (2023). Improving Internet Advertising Using Click – Through Rate Prediction. In: Human Factors in Software and Systems Engineering. AHFE Open Access, vol. 94, pp. 75–85. https://doi.org/10.54941/ahfe1003772
Online advertising is a billion-dollar industry, with many companies choosing online websites and various social media platforms to promote their products. The primary concerns in online marketing are to optimize the performance of a digital advert, reach the right audience, and maximize revenue, which can be achieved by predicting the accurate probability of a given ad being clicked, called the Click-Through Rate. It is assumed that a high CTR depicts the ad reaching its target customers while a low CTR shows that it is not reaching its desired audience, which may constitute a low return on investment (ROI). We propose a data-science-driven approach to help businesses improve their internet advertising campaigns which involves building various machine learning models to accurately predict the CTR and selecting the best-performing model. To build our classification models, we use the Avazu dataset, publicly available on the Kaggle website. Having insights on this metric will allow companies to compete in real-time bidding, gauge how relevant their keywords are in search engine querying, and mitigate an unexpected loss in spending budget. The authors in this paper strive to use modern machine learning tools and techniques to improve the performance of predicting Click-Through Rate (CTR) in online advertisements and bring change to the industry.
Today, online advertising is a multi-billion-dollar business that uses the Internet platform to send promotional and marketing messages to the global and continuously growing corpus of Internet users—each with their speci- fic interests and preferences when interacting with companies. The digital advertising market produces most of the search engine revenue (Ma et al., 2013) as users search for a particular product or a piece of information on the engine. The search engine delivers accurate and relevant advertisements based on keyword searches. The revenue is generated every time a consumer clicks on the ads displayed on the search engine results page (SERP). The sea- rch engine typically implements the Pay-Per-Click model, which means that a publisher can only be paid when the ad is clicked. The expected revenue is calculated as (cost * click-probability). Comparably, websites and mobile
applications, including social media applications, depend on this kind of customer interaction to make a profit.
Digital marketers face numerous challenges (Team Linchpin, 2023) with yet another year of high inflation rates, falling consumer and business con- fidence, and an imminent recession caused by the pandemic. This economic downturn means bad news for new and existing tech giants and digital adver- tisers specializing in search engine optimization (SEO), content marketing, and social media. For example, Snapchat, a popular multimedia mobile app, in a letter to investors in late July 2022 (Snap Inc, 2023), pointed out the increased competition for advertising dollars, warning that the digital ad space is suffering as brands cut budgets in response to declining consumer demand. At the same time, Microsoft, the world’s largest computer softw- are vendor, announced in its quarterly results (Microsoft Corp, 2022) that it took a revenue hit of $100 million for LinkedIn and Microsoft search and news advertising during the fiscal fourth quarter. Even small busines- ses partnered with Internet for Growth, an initiative to help businesses scale to meet demands, have made headlines for urging the Federal Trade Com- mission (FTC) to stop imposing new regulations on the digital economy. In a letter (Internet for Growth, 2022), they emphasize their reliance on data- driven digital advertising to reach and attract customers and express their worry that the new regulations will increase unwarranted expenditures.
According to Magma’s Global Ad Forecast (MAGMA, 2022), 2023 will not be the year of recovery for ad budgets. It predicts advertising revenues will grow to $833 billion in 2023, or about 5% compared to 7% in the pre- vious year. Companies cannot afford to waste time and money on poorly targeted ads in a competitive yet uncertain market, with paid ads on the rise. They must learn to effectively reach their target audience on various features, including demographic, location, and intent, and advertise to users who have previously interacted with its products but have not yet converted (also known as “retargeting”). Likewise, a focus on creating engaging con- tent that follows current trends—short-form videos, live-streaming content, and Instagram/Facebook stories—is a must. The critical question is: How can companies gather the necessary, personalized data insights to accomplish these goals?
Click-Through Rate (CTR) is a new and upcoming technology that most companies are interested in learning about consumer behavior (Wang, 2020). This particular area is seeking more attention because it might be the best approach, especially for companies looking to initiate cost-cutting measures (Wang, 2020). The CTR is the ratio of the number of clicks an advertisement receives to its total impressions. An impression is defined as the showing of the advertisement, which is typically counted each time an ad appears on a search result page. We consider an advertisement to be effective if it has a high ratio of clicks to its respective number of views. When users browse the Inter- net, advertisements crowd users’ screens for a specific time. However, only a handful will actually appeal to and be helpful to the users. Companies profit only when a customer opens the advertisement and goes through it. Thus, an ad reaching the right target audience is crucial to effective advertising.
Improve Internet Advertising Using Click–Through Rate Prediction 77
Our work focuses on selecting the minimum characteristics amongst the high dimension of data and estimating the CTR using machine-learning tech- niques such as random forest and logistic regression. We will utilize an advertising publisher’s data and statistics to determine whether a user clicks on an advertisement.
BACKGROUND
The Pay-Per-Click model means that a publisher can only be paid when the ad is clicked. The expected revenue is calculated as (cost * click-probability). Let’s say a popular search engine has an offer from two popular advertisers:
$2.00 will be paid when the ad is clicked. Assume the probability of being clicked is 20%.
$4.00 will be paid when the ad is clicked. Assume the possibility of being clicked is 5%.
Most likely, choosing the first offer will lead the publisher to profits because the expected revenue is higher for the first ad when compared to the second one.
Companies like Google Advertising have adopted a logistic regression model to predict the CTR, whereas other companies use a gradient-boosting decision tree. Here, selecting the features is an essential factor (Shunde et al, 2023). For example, the main factors considered while predicting are user information, time characteristics, search keywords, and advertisers. Still, there is a need to add more realistic factors that may help models to predict accurately. Introducing cross factors is necessary because it will help combine multiple predictor variables (Lian and Ge, 2020), with each predictor varia- ble will have its importance. Not all features contain helpful information for predicting the target (Agarwal et al., 2015). So, choosing factors of various importance is crucial while building the model (Xu et al., 2019). We aim to develop a model containing different realistic elements to predict high CTR values. We also include many complex machine learning algorithms such as SVM, Logistic Regression, Naïve Bayes, and Gradient Boosting. Based on the results from these algorithms, we chose one with appropriate performance and better prediction.
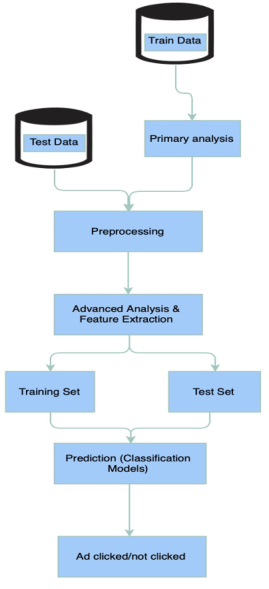
SYSTEM ARCHITECTURE AND TOOLS The system architecture is shown in Figure 1. To build our models, we use the Avazu dataset, publicly available on the Kaggle website, and containing over ten days of advertisement data (between 10/21/2014 to 10/30/2014) with details of the customers, ad details, and the application used. It primarily includes the specifics of advertising that the publishers track and the user’s activity log. Many data characteristics are anonymous for security and pri- vacy concerns. Clicked data is around 17%, while unclicked data is about 83%, clearly showing that the dataset is unbalanced. Since the dataset is huge, we selected randomly and evenly sorted one million records based on the clicked and not clicked data. We used 70% of this data to train the model and 30% to test the model’s performance. Information about which
Figure 1: System architecture diagram.
advertisements were clicked and which were not is said to be sampled using undisclosed techniques.
The dataset has around 23 features, of which ‘Click’ is the target feature. Except for the target attribute ‘Click,’ which will be unique, other features can be divided into Ad specific, Device specific, and Anonymous categories. This binary categorization allowed us to attribute values between 1 and 0. Where 1 refers to the customers who did and 0 to those who did not click on the ad. The other eight categorical features were kept anonymous for privacy concerns; they are hashed to unique values, making it easier to reduce the dimensional space of the dataset in question.
Categorical features must be converted into a numerical format to be used in sklearn. One method of doing so is a hash function, which converts an arbitrary input into an integer output. It returns the same output for a given input every time. We can use the hash function as follows. First, we establish a lambda function, which is a function that takes some set of elements and applies the function f(x) to every element of the set. It is written as lambda x, followed by a colon, followed by the function f(x), which we define as the hash function. We apply this function over every element within our Data Frame using the apply method, which takes in a lambda function and an axis to operate over, just like we saw in the last lesson, with the axis being 0 or 1. For example, here, we can apply the hash function to every row of the
Improve Internet Advertising Using Click–Through Rate Prediction 79
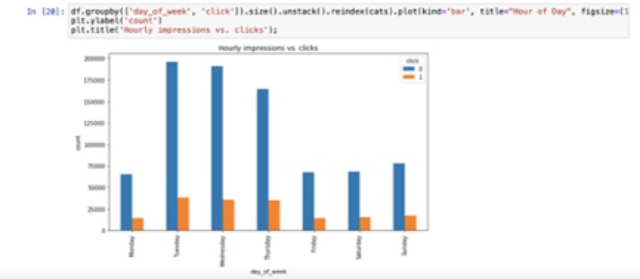
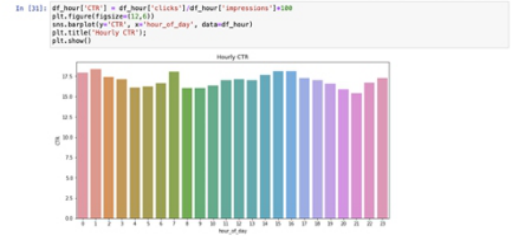
Figure 2: Distribution of clicks per day.Figure 3: Hourly CTR is calculated and plotted.
site_id column. As seen on the left-hand side, the original format for each x is a string, and the right-hand side has the converted numerical result.
The number of clicks obtained each day of the week is shown in Fig. 2. Hourly CTR is plotted in Fig. 3.
FEATURE EXTRACTION Standardization is the process of ensuring that the data fit the assumptions the model has about the features. If a feature has a much larger variance than other features, it may dominate the other features within the model, which is undesirable. In the context of CTR prediction, imagine you have several count features, like the ones you created in the previous exercise. If one of them has a much larger range of values, say device id count, due to one spam user continually clicking the model, it will heavily weigh that count over others. Even though the best approach might consider all count features equally, this will happen.
Among the several methods to standardize features, the most popular is log normalization, which reduces the variance of features. It should only be applied to features with very high variance relative to other features. One can use the var method to check the variances of columns in a data frame. The output shows the variance for each column. Since the output is an array, it is possible to run standard python methods like mean () and median () to get
the average and median variance. To use log normalization, one can take a particular column and apply numpy’s log () function to all column elements, as shown here with the column device_id_count. As a result, the values of that column will have a reduced range of values and hence a reduced variance. The larger the feature’s original variance, the larger the variance reduction due to the log function’s mathematical properties.
MACHINE LEARNING There are two main models: classification models, used when the target vari- able is categorical (such as yes/no), and regression models, used when the target variable is continuous (such as price). We used a classification model since our target variable is categorical (click yes or no). We trained the model on various machine learning algorithms and chose the best one, which gives an accurate prediction.
Logistic Regression is widely used for classification problems. When a par- ticular problem has only two possible outcomes, then we have Binary Logistic Regression. In Binary Logistic Regression, the sigmoid function includes all the inputs passed through an activation function, which maps them to any value between 0 and 1. The value 0.5 is used as a probability threshold value to classify binary classes. If the threshold value is < 0.5, we classify it as class 0; if it is > 0.5, it is determined to be class 1. A decision tree has nodes (represented by the circles and boxes) being the features and branches (the lines connecting them) as decisions based on which features best separate the data. When applied to CTR prediction, building such a model can provide a heuristic for understanding why a particular ad is more likely to be clicked by a specific user, because of a user’s device, location, and the placement of the ad.
The random forest regressor is a widely used machine learning model to forecast. Random Forests are an ensemble method that utilizes bagging to create individual decision trees that are then aggregated (Zhang et al, 2017). It has the character of both bagging and a random subspace method. Each tree in the forest is built from a bootstrap sample of the dataset, which is an additional source of diversity (Jie-Hao et al, 2017). As an integrated model, it exhibits high predictive accuracy and low variance while being easy to learn and optimize. Therefore, it performs well in prediction tasks..
ANALYZING THE OUTCOMES The outcome is the critical assessment of ROI on ad spending. Typically, impressions are charged in the cost per 1000, so let’s denote that price as a constant, c. We assume each click (through downstream effects of a chance to purchase a product) has some return r. Then the total return on clicks is given as tp * r. The associated cost is (tp + fp) * c. Therefore, we want tp * r > (tp + fp) * c and can look at the ratio of the two quantities as an ROI on ad spend.
In some experiments, the receiver operating characteristic curve (ROC) is used to evaluate the outcomes, whereas, in others, the log loss is used.
Improve Internet Advertising Using Click–Through Rate Prediction 81
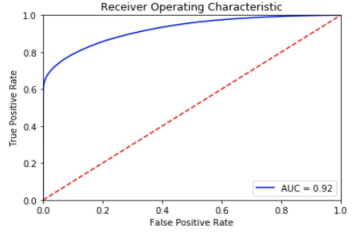
The ROC Curve is an indicator at all feasible ranges from 0 (low) to 1(high) plotted between the false positive (FP) and true positive (TP) rates. The area under the ROC curve is a performance metric for all reasonable limits. If the dataset has imbalances, the research employs the log loss approach to quan- tify the prediction’s accuracy. The log loss measure additionally considers the prediction’s probability into account as a target feature.
For CTR prediction, true positives are when the model accurately predicts a click, and false positives are when the model predicts a click but no click. Our research and model building will help determine the ad’s bidding rates and the space allocation based on the network traffic.
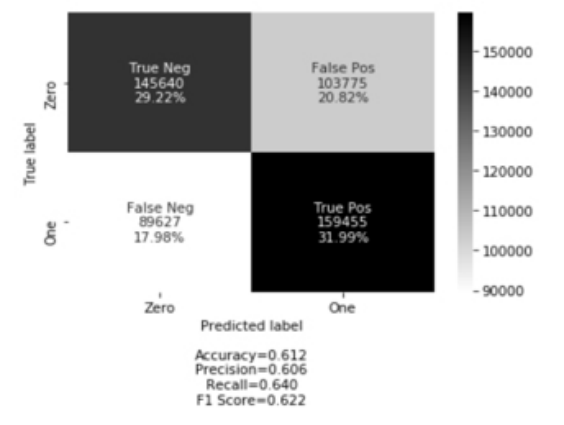
RESULTS AND ANALYSIS A confusion matrix shows the model’s accuracy while working on unseen data. The size of a confusion matrix depends on the number of classes pre- sent in the dataset. For binary classification, a confusion matrix has four cells: ‘True positives,’ ‘True Negatives,’ ‘False Positives,’ and ‘False Negative.’ The True negatives and True positives cells are used to compute the model accuracy.
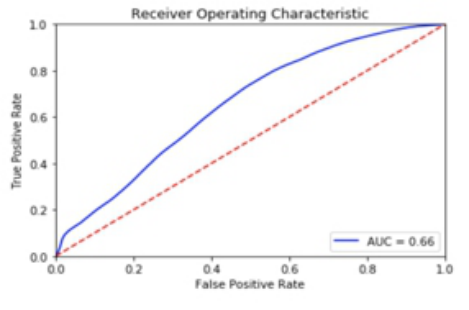
We show the results of the Logistic Regression in Fig. 4 and the computed ROC-AUC Curve of Logistic Regression in Fig. 5.
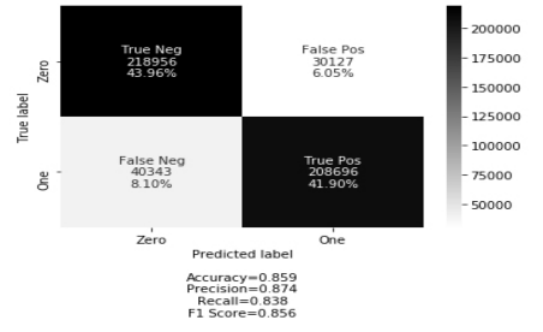
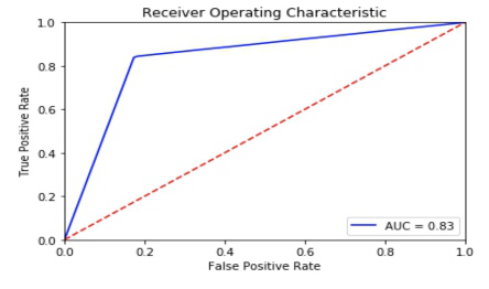
We show the results of the decision tree in Fig. 6 and the computed ROC- AUC curve of the decision tree in Fig. 7.
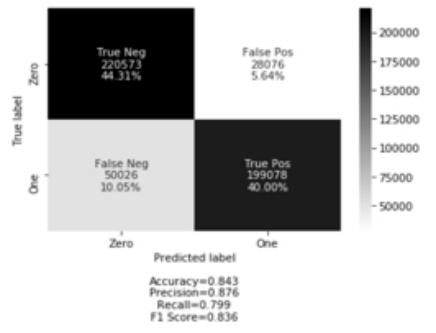
We show the results the Random Forest in Fig. 8 and the computed ROC- AUC Curve of the Random Forest in Fig. 9.
Figure 4: Results of logistic regression.Figure 5: ROC-AUC curve of logistic regression.Figure 6: Confusion matrix of decision tree.Figure 7: ROC-AUC curve of decision tree.
Improve Internet Advertising Using Click–Through Rate Prediction 83
Figure 8: Confusion matrix of random forest.Figure 9: ROC-AUC curve of decision tree.
CONCLUSION AND FUTURE WORK A disadvantage of working with CTR prediction is the lack of data. Because of privacy concerns of various customers and the sensitivity of the data, there are not many public datasets available. Companies with access to the data are not ready to make it public since their teams use them to build insights. Pro- gress can be achieved in this field when more data is made public. However, we can look toward a future where this would be possible. A revolutionized way of creating a digital identity, along with unlimited data distribution—a reality brought forth by none other than Web 3.0, the third generation of the Internet.
In 2021, cryptocurrency enthusiasts, large tech companies, and venture capitalist firms proposed the idea of data decentralization, emphasizing the data ownership rights to consumers. This approach is contrary to the existing web 2.0 monopolized mainly by large social media and tech companies. Web 3.0 uses blockchains, cryptocurrencies, and NFTs to distribute ownership amongst its users, grant equal access, allow a new way of spending/sending money online through NFTs, and stray away from trusted third parties. Blo- ckchain technology will transform the concept of digital identity as we know it. The new system will allow identity information to be auditable, traceable,
and verifiable within seconds, protect against theft, and provide individuals with greater sovereignty over their data. We have dealt with issues of ina- ccessibility, data insecurity, and fraudulent identities for too long; thus, new solutions with ties to blockchain tech have emerged to battle these challenges. Ideas like self-sovereign identity allow users to choose which pieces of infor- mation to share and monetize data are genuinely revolutionary. In the near future, these ideas will enable consumers to monetize their personal data by renting it to AI training algorithms.
In the scope of digital advertising, blockchain technology (Likens and Bhangah, 2023) can allow ad buyers to verify, in near-real time, the speci- fics of how their ads are performing, which ones are driving engagement and receiving desired outcomes, as well as confirm their authenticity.
ACKNOWLEDGMENT
This material is based upon work supported by the National Science Foun- dation under Grant No. 1832536 for the project, “Advancing Student Success by Utilizing Relevant Social-Cultural and Academic Experiences for Undergraduate Engineering, Computer Science Students (ASSURE-US).
REFERENCES
Agarwal, A., Gupta, A., Ahmad, T. (2015) “A comparative study of linear learning methods in click-through rate prediction,” 2015 International Conference on Soft Computing Techniques and Implementations (ICSCTI), 2015, pp. 97–102, doi: 10.1109/ICSCTI.2015.7489611. Internet for Growth, ANPR on Commercial Surveillance and Data Security, Docket
No. 2022-0053, November 2022, [online] Available: https://internetforgrowth.co m/wp-content/uploads/2022/11/I4G-sign-on-letter_FINAL_11.10.22.pdf Jie-Hao, C., Xue-Yi, L., Zi-Qian, Z., Ji-Yun, S., Qiu-Hong, Z. (2017) “A CTR prediction method based on feature engineering and online learning,” 2017 17th International Symposium on Communications and Information Technologies (ISCIT), 2017. Lian, Z., Ge, H. (2020) “FINET: Fine-grained Feature Interaction Netw- ork for Click-through Rate Prediction,” 2020 12th International Confere- nce on Advanced Computational Intelligence (ICACI), 2020, pp. 334–339, doi: 10.1109/ICACI49185.2020.9177810. Likens, S., Bangah, C. J. (2023) Blockchain in advertising – Is it the answer to digital
advertising’s trust and transparency gap? [online] Available: https://www.pwc.co m/us/en/industries/tmt/library/blockchain-in-advertising.html Ma, J., Chen, X., Lu, Y., Zhang, K. (2013) “A click-through rate prediction model and its applications to sponsored search advertising,” Internatio- nal Conference on Cyberspace Technology (CCT 2013), 2013, pp. 500–503, doi: 10.1049/cp.2013.2079. MAGMA (2022), Traditional Media Resilient Through Economic Uncertainty –
Social Media Stalls Under Headwinds, December 2022, [online] Available: https://magnaglobal.com/traditional-media-resilient-through-economic-uncerta inty-social-media-stalls-under-headwinds/#:~:text=TEN%20TAKEAWAYS,fro m%20%2B7%25%20in%202022. Microsoft Corp., Press Release & Webcast, July 2022, ]online] Available: https://ww w.microsoft.com/en-us/Investor/earnings/FY-2022-Q4/press-release-webcast
Improve Internet Advertising Using Click–Through Rate Prediction 85
Qu, X., Li, L., Liu, X., Chen, R., Ge, Y., Choi, S. (2019) “A Dynamic Neural Network Model for Click-Through Rate Prediction in Real-Time Bidding,” 2019 IEEE International Conference on Big Data (Big Data), 2019, pp. 1887–1896, doi: 10.1109/BigData47090.2019.9005598. Shinde, P., Raghatate, R., Kumar, S. (February 22, 2023) Outbrain Click Prediction, https://github.com/rahulraghatate/Ads-Click-Prediction/blob/master /Outbrain.pdfSnap Inc., Investor Letter Q2 2022, July 2022, [online] Avai- lable: https://s25.q4cdn.com/442043304/files/doc_financials/2022/q2/Snap-Inc.- Q2-2022-Investor-Letter-vF.pdf Team Linchpin (February 22, 2023), The Biggest Challenges Facing Digital Marke-
ters in 2023, February 2023, [online] Available: https://linchpinseo.com/challeng es-facing-digital-marketers/#1-learning-about-your-customers Zhang, S., Fu, Q., Xiao, W. (2017) “Advertisement Click-Through Rate Prediction Based on the Weighted-ELM and Adaboost Algorithm,” Scientific Programming, vol. 2017, Article ID 2938369, 8 pages, 2017. https://doi.org/10.1155/2017/ 2938369 Wang, X. (2020) “A Survey of Online Advertising Click-Through Rate Pre-
diction Models,” 2020 IEEE International Conference on Information Tech- nology, Big Data and Artificial Intelligence (ICIBA), 2020, pp. 516–521, doi: 10.1109/ICIBA50161.2020.9277337.
LISTED IN THE AHFE DIGITAL BOOKSTORE CATALOGUE
Explore the complete digital volume
Human Factors in Software and Systems Engineering
Read this individual research paper free through the original publisher, or explore the full digital proceedings book.
ISBN 978-1-958651-70-4
Explore this ISBN in the AHFE Bookstore ↗Listed in the July 2026 bookstore catalogue; search by ISBN to confirm current availability · Digital book purchase optional