Wayne Patterson (2023). Analysis of Risks to Data Privacy Throughout European Countries. In: Human Factors in Cybersecurity. AHFE Open Access, vol. 91, pp. 28–39. https://doi.org/10.54941/ahfe1003717
Over 20 years ago, the surprising research by Latanya Sweeney demonstrated that publicly available database information exposed the overwhelming percentage of United States residents to information easily available in order to facilitate the capture of such personal information, through techniques we now refer to as “dumpster diving.” In particular, her research demonstrated that approximately 87% of the United States population can be identified uniquely using only the Unites States’ five digit postal code, date of birth (including year), and gender. Although this result has held up over time, given the demographic parameters used in developing this estimate, Sweeney’s technique made no attempt to develop similar estimates for other countries. In this paper, we use Sweeney’s technique in order to provide estimates of the ability of similar demographics to provide the same type of data in a number of other countries throughout the European Community and other non-EU countries in Europe. Through this mechanism, we attempt to determine the susceptibility to data privacy attacks in Europe as compared to the United States.
There is a rapid increase in the reported number of incidents of vital perso- nal information stored electronically being captured by malicious actors. As a consequence, two phenomena have grown extensively over the past two deca- des: first, the exponential growth of cyberattacks in virtually every computing environment; and second, public awareness of vulnerability to attacks that may be directly aimed at the individual, or to an organization that maintains widespread data on the entire population.
The work of Dr. LaTanya Sweeney was perhaps the first body of research to demonstrate the vulnerability of most persons in the United States to the easily available demographic data necessary to identify sensitive information about any individual.
“It was found that 87% (216 million of 248 million) of the population of the United States had reported characteristics that likely made them unique based only on {5-digit ZIP, gender, date of birth}” (Sweeney, 2000).
Henceforth, we will refer to the triad {5-digit ZIP, gender, date of birth} as (PC, G, B) with PC = number of postal codes, G = gender, and B = birth date including year. However conclusive was Sweeney’s research concerning the
Analysis of Risks to Data Privacy Throughout European Countries 29
citizens and residents of the United States, her research only provided a tem- plate for developing similar estimates regarding other countries throughout the world.
In this paper, we extend the previous research to develop similar estimates regarding residents’ vulnerability to data attacks using similar demographic data. We will explore for each European country, the value of the triad T = (PC, G, B), and thus establish the vulnerability of European persons to cyberattack, as had been estimated previously for persons in the United States.
The value of the Sweeney research has been to introduce residents of the United States of the ease by which they can be identified in various databases and hence how their personal information and be captured via techniques known generally as “social engineering” or “dumpster diving.” Since appro- ximately 87% of the US population can be identified uniquely by only three pieces of (usually) easily found data, the identity of the individual can easily be compromised by persons seeking that information in publicly available databases.
In order to achieve the objectives of this paper, we will examine the feasi- bility of obtaining similar data or persons in a selection of other countries. In prior work (Patterson and Winston-Proctor, 2019), comparable analyses were done for 9 of the European countries considered here.
SELECTION OF COUNTRIES FOR ANALYSIS We have tried to include all countries considered to be in the continent of Europe, either in whole or in part. In all we will consider 51 countries. Of these countries, as described in Table 1 below, 47 are considered to be entirely within Europe, with four both in Europe and in Asia (E-A); 27 are members of the European Community (EC); 26 are members of the Schengen protocol abolishing border checks between these countries (SCH); and 23 use the Euro (€) as a common currency.
A few of the countries are actually on islands not with a land border with the European continent, but connected to Europe by international relations and history. Certainly Iceland is the island country geographically most remo- ved from the continent, but of course the United Kingdom, Ireland, and Malta are other examples.
First, we consider the level of Internet use among the European countries. In Table 2 we list the European countries with the highest level of usage worldwide (Patterson and Winston-Proctor, 2019).
In general, we want to consider the level of concern in countries throughout the world in terms of the susceptibility to cyberattacks to discover personal information. Although the level of attacks is rising in virtually every country, we postulate that the level of concern by an individual citizen in a given coun- try may be related to the widespread availability of national computer usage and Internet usage. These data will be demonstrated in Table 2 using data for the 51 countries with the greatest prevalence of computer availability and Internet usage, both in terms of the total numbers and the percentage of the population. It is part of our hypothesis that if a relatively small percentage of
30 Patterson
Table 1. European countries classified by international agreements.
€: Andorra, Austria, Belgium, Cyprus, Estonia, Finland, France, Germany, Greece, Ireland, Italy, Kosovo, Latvia, Lithuania, Luxembourg, Malta, Monaco, Montenegro, Netherlands, Portugal, San Marino, Slovakia, Slovenia, Spain, Vatican City E-A: Georgia, Kazakhstan, Russia, Turkey
Table 2. Rank of internet use among selected European countries.
Table available in the original PDF paper.
European Country
Rank of Internet Use Worldwide
European Country Rank of Internet Use Worldwide Russia 6 Italy 20 Germany 8 Poland 28 Great Britain 10 Netherlands 38 France 12 Kazakhstan 41 Turkey 15 Belgium 47 Spain 19 Sweden 50
a country’s population operates in cyberspace, there will be less interest either among the country’s residents in terms of protecting their personal data; and by the same token, interest amongst those involved in cyberattacks in finding personal data, since it might apply only to a very small percentage of the country’s population.
POSTAL CODE SYSTEMS To replicate the Sweeney study for other countries, it is necessary to iden- tify the total population, the life expectancy by country, and the postal code system in such countries.
The first two are easily found and have a high degree of accuracy. The existence of the postal code system, which does exist in most countries but not all; is of a different nature, since the information that is easily available is the potential range of values for postal codes in all of our selected countries. For example, and using ‘N’ to represent decimal digits in a postal code, and ‘A’ for alphabetical characters, it is possible to determine the total range of possible postal codes. For example, in the United States five-digit ZIP code system, which we would indicate as “NNNNN”, there are a total of 105 = 100,000 possible postal codes. However, as reported by Sweeney at the time of her
Analysis of Risks to Data Privacy Throughout European Countries 31
research, only 29,000 of the possible five-digit combinations were actually in use. (The corresponding use of US ZIP code numbers at present is 40,933.)
Most of these data have been compiled for approximately 200 countries, but in order to apply the Sweeney criteria, we limit the further analysis to a smaller set of countries.
In order to develop a comparison in terms of the privacy considerations in individual countries, it is necessary to be able to estimate the key statistics Sweeney used. Population data is easily available for all European countries (United Nations, 2022), as are mortality rates or life expectancy rates to deve- lop applicable birthdays as in Sweeney’s paper (World Health Organization, 2022). The third statistic used by Sweeney is, for the United States, the 5-digit form of postal code, called in the US the “ZIP code”. It is noted that in the US context, that most if not all postal service users have a 9-digit ZIP Code, sometimes called the “ZIP + 4”, NNNNN-NNNN, but the recording and storage of US postal codes still varies widely, and most databases that might be discovered by a hacker would only have the 5-digit version, “NNNNN”. Furthermore, Sweeney’s original research only used the original 5-digit ZIP Code. These data are available for all European countries considered, except for the Vatican City.
The other complicating factor in this comparative study is that in most countries, there is a distinction between the characters of potential postal codes as a function of the syntax of the structure of postal code assignment. Throughout the world, most postal codes use a combination of numerals {0, 1, 2, …, 9} which we describe as ‘N’; and letters of the relevant alphabet. In the Roman alphabet (mostly in uppercase), we have {A, B, C, …, Z} which we designate as ‘A’.
In the case of the older US 5-digit ZIP Code, the syntax is NNNNN, which allows for the maximum possible number of ZIP Codes as 105 = 100,000. As a comparison, the United Kingdom postal code system is (for almost all cases) AANA NAA, therefore 264 × 102 = 45,697,600. However, the number of allowable postal codes is better approximated by 817,960, since many letter combinations are not used.
Thus our level of analysis in estimating the actual number of postal codes is simply to use the calculated level based on the syntactical postal codes. To be more accurate, however, it is necessary to take into account that many postal systems restrict the usage of some of these symbols for perhaps local reasons. Thus, to obtain a more precise comparison, it is important to pos- sibly determine the actual number of postal code values actually in use, as opposed to the number theoretically in use.
For example, the current estimate of US ZIP Code numbers in use is 40,933, or 41% of the allowable values (or 2% for the United Kingdom). These estimates are only available for a smaller number of countries.
In order to determine a “Sweeney Index” for our 51 European countries, we must first determine the life expectancy by country, and the number of possible values in the country’s postal code system.
In all European countries, a postal code system exists, and it is defined by a numerical sequence, ranging from four, five, six or even nine digits; and often also by several alphabetic symbols, the most part using the Roman
32 Patterson
alphabet. In the table below the use of a numeric character is indicated by N, and an alphabetic character by A. Thus, for example, a country using a five-digit number for the postal code would be represented in our table as “NNNNN”.
A few examples of the syntax for postal codes in our target coun- tries include the Czech Republic (Czechia): (NNNNNNN); Kazakhstan: (NNNNNN); Netherlands: (NNNN AA); and Switzerland: (NNNN).
The first estimate of the number of postal codes per country (PC) is determined by the syntax and the potential number of occurrences for each character in the string representing the code. In a number of cases, it is pos- sible to determine if a country uses all of the possibilities for codes under its coding system. But in most countries, not all possibilities are used – only a certain fraction of the eligible set of codes are actually in use; unfortunately this information is not readily available for all countries.
The major conclusions by Sweeney are obtained by the analysis of inter- nal United States data on ZIP Codes to approximate the distribution of active addresses as distributed over the entire set of postal code values. Swe- eney defines several methods of distribution, including uniform distribution, which would certainly simplify calculations for other countries. It is likely to be less realistic than many other options; nevertheless, within the scope of this article, we will first calculate the likelihood of unique identification of individuals assuming uniform distribution of individuals in countries, since we do not have access to the necessary internal postal code distributions in other countries. Nonetheless, we feel uniform distribution gives a reasonable first approximation to the Sweeney US results.
Using the uniform distribution process, we can accurately calculate the total number of “pigeonholes” for most of the identified European countries, and then the uniform distribution by dividing the population by the number of pigeonholes.
PIGEONHOLES The problem then becomes the conducting of an assessment of the data for the number of persons that can fit into each of the potential categories, or “pigeonholes” in a frequently-used term in computer science. Another way of phrasing the conclusions of Sweeney’s earlier study is to say that of all the pigeonholes, approximately 87% have no more than one datum (that is, no more than one person) assigned to that pigeonhole.
Another way of describing the problem or series of problems is through the terms “bits” and “buckets”. Just as we describe assigning the characteri- stics of individuals into “pigeonholes”, we can describe the same problem as assigning “bits” to “buckets”.
The number of pigeonholes in Sweeney’s study for the United States is calculated by the product of the potential number of persons identified by birthdate including year, gender, and 5-digit ZIP code. The contribution to this number related to gender is 2, say pg = 2. For birthdate, we approximate the number of values using pd = 365 for days of the year (a slight simplifi- cation ignoring leap years), multiplied by the number of years, estimated by
Analysis of Risks to Data Privacy Throughout European Countries 33
the country’s life expectancy in years (Wikipedia, 2022). Call this ple. The final relevant factor in estimating the number of pigeonholes is the number of potential postal codes, PC. Then the total number of pigeonholes (PH) is PH = pg × pb × ple × PC = (2 × 365) × ple × PC
One remaining problem is the estimation of the number of postal codes, PC. For many European countries, it is possible to determine the actual number of postal codes in use. In a few cases, it is only possible to appro- ximate the number based on the lexical structure of the country’s postal code system. It is an easy calculation to find the maximal value for PC say PCmax. For example, for the 5-digit US ZIP code system, that maximal value is PCmax = 105 = 100000. At the time of Sweeney’s research, the number of ZIP codes actually used was PC = 29343 ((Patterson and Winston-Proctor, 2019), page 15), or 29.3% of the total number of ZIP code values. At present, the number of ZIP codes in use is 40,933.
Given available data for all world countries, the value PC is often not made public.
As a first level analysis, we determine the necessary components in order to estimate, country-by-country in Europe the necessary data to perform the Sweeney-like analysis. These components are for each person in any of the countries studied, gender; birthdate including month, day, and year; and postal code of residence.
The Sweeney study used the standard postal system in use in the United Sta- tes at the time, the 5 digit postal code, with each digit in the range {0, …, 9}. For other countries, however, although two of the 3 data points remain the same, the postal code system may vary widely from country to country.
For our first level of comparison, we are able to determine all of the neces- sary components for each European country. Using a comparable method as was used by Sweeney, we estimate the number of persons at present having a common birthdate, including month, day, and year by combining population with life expectancy for each country.
What is not known about the components leading to the determination of numbers of the population stored in each pigeonhole is the distribution function. In the original Sweeney paper, she had additional information fur- nished by the postal system that allowed her to give a reasonable estimate of the distribution function.
In our case, the immediate estimate of the population distribution would be to assume the uniform distribution–in other words by dividing the population by the number of pigeonholes. These results are demonstrated in the follow- ing Table 3. This analysis does allow us to at least compare the distributions by country and also by comparison with the United States.
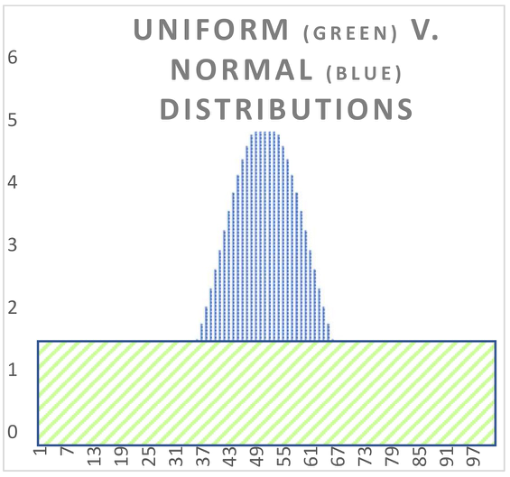
Beyond the uniform distribution, it is more likely that the actual distri- bution would approach a normal distribution (or a bell-shaped curve). Conducting this type of analysis assumes that we can estimate other statistics, at least the maximum value of the number of data points for each pigeonhole, and then the range of the number of pigeonholes having values greater than or equal to 1.5. Such a value would imply that for that point on the horizon- tal axis, we can conclude that there might be a collision, in other words 2 or
34 Patterson
Table 3. Potential true number of postal codes in Europe.
Analysis of Risks to Data Privacy Throughout European Countries 35
more people with the same set of data points T= (PC, G, A), thus denying unique identification of a user for that pigeonhole.
Then the percentages of the number of such pigeonholes with 2 or more elements, when subtracted from 100% will yield the number of pigeonholes where the “resident” can be uniquely identified.
The Legend or headings for Table 3 are: PC number of postal codes ple average life expectancy in years POP national populations in 1000s PH number of “pigeonholes” UNIF uniform distribution or POP/PH
SECOND APPROACH Using the uniform distribution helps in one way because it is much easier for computational purposes, but on the other hand it is less likely to model exact world conditions. For one example, a 100-unit apartment building, with the same postal code as a nearby postal code belonging to a single-family dwelling will have a distorted number of persons in the two postal codes.
Thus we use a second model to determine the likelihood of multiple persons with the identical three coordinates, in this case using a normal distribution.
A second approach to the estimation of vulnerability to attack by European country can be developed assuming postal data is distributed according to a normal curve rather than a uniform distribution. (See Figure 1.)
Figure 1: Comparison of uniform and normal distributions (not to scale).
36 Patterson
In order to apply this approach, the assumption must be made that the distribution of “pigeonhole” data can be modeled by a normal form distri- bution. This is not an unreasonable assumption, given that the data from the original Sweeney paper demonstrates a similar model.
In order to find an appropriate normal distribution, we use the data previ- ously calculated for the quotient used in the uniform distribution, and used a Monte Carlo approach to estimate a peak value for a normal distribution to be fitted to the known data previously calculated.
Using this approach, we ran 100 simulations for each country’s data, and thus determined the best estimate for a peak value in the normal distribution. From this data, we calculated a normal curve based on the range of values calculated for the country’s population data, and the estimated peak value for normal distribution (See Tables 4-6).
This allowed for further estimate of the percentage of pigeonholes that would be filled assuming the number of values in each pigeonhole is greater than or equal to 1.5; in other words, if this estimate showed that the given pigeonhole would have a roundoff number of values 2 or greater, we could assume a single entry could not be determined. However, if the number of entries in the pigeonhole was less than 2, then this would point to a unique data point, thus allowing the identification of an individual component in this distribution.
We can see in the following table the percentages of uniquely identifiable combinations of T = (PC, G, B) for each country.
This will give a more conclusive answer to the conclusions reached using only the assumption of a uniform distribution.
Although it is a reasonable assumption to look for a distribution of the data points or “bits” to be assigned to “buckets” beyond the uniform distribution described above. The short answer might be that there is no overwhel- ming scientific reason to use a normal distribution rather than any other distribution model, such as binomial, Poisson, student T or other.
The real answer is that there is no definitive reason for choosing one distri- bution model versus another. Thus our choice of the normal distribution is primarily a default in the absence of any known behavior as to how the characteristics of residential patterns, or birthdate distribution. It is known that there is a non-uniform distribution in many countries with respect to birth dates throughout the year. This particular example would not seem to substantially impact our choice of the normal distribution.
CONCLUSION
What we can determine from these analyses is that in large part, it would be relatively easy for a malicious party to determine information about individuals throughout most of Europe to identify persons uniquely.
In the 50 countries analyzed, in essence all countries in Euurope in whole or in part, or considered so in one or another international grouping of countries, sufficient data is publicly available that allows for this analysis to be considered.
Analysis of Risks to Data Privacy Throughout European Countries 37
Table 4. Comparison of uniform vs. normal distribution regarding pigeonholes.
Table available in the original PDF paper.
Country POP PH Unif dist % Normal dist % Country POP PH Unif dist % Normal dist %
Table 5. Countries with normal distribution & uniform distribution with different conclusions.
Table available in the original PDF paper.
Country Normal Uniform Country Normal Uniform Andorra 96.1 81.5 Germany 95.2 83.5 Armenia 55.2 78.9 Italy 89.1 78.2 Austria 78.9 55.2 Kazakhstan 97.3 91.6 Azerbaijan 83.5 94.8 Kosovo 91.4 71.6 Belgium 94.8 83.5 Turkey 81.3 53.8 Bosnia/ Herzegovina 94.8 90.5
Table 6. Countries with normal distribution and uniform distribution aligned.
Table available in the original PDF paper.
39 Countries for Which Both the Normal Distribution and the Uniform Distribution indicate > 95% of the Population Identifiable with the Triad of Data Albania, Belarus, Bulgaria, Croatia, Cyprus, Czech Republic, Denmark, Estonia, Finland, France, Georgia, Greece, Hungary, Iceland, Ireland, Latvia, Liechtenstein, Lithuania, Luxembourg, Malta, Moldova, Monaco, Montenegro, Netherlands, North Macedonia, Norway, Poland, Portugal, Romania, Russia, San Marino, Serbia, Slovakia, Slovenia, Spain, Sweden, Switzerland, Ukraine, United Kingdom
As described above, the only data required to conduct this analysis is the number of postal codes by country (PC); the population by country (P); and the life expectancy rates by country (ple). The only European country without sufficient information for this study is the Vatican City, as by its nature the permanent population is not well-defined.
By further analyzing the data by country from Table 2, we can determine that in 78%, or 39 of the 50 countries analyzed, that either by considering the uniform distribution analysis, or the normal distribution analysis, more than 95% of the national population can be individually identified only by gender, birthdate including year, and postal code. The 39 countries are indicated in Table 3.
This leaves 11 countries where the percentage of the population for whom individual identification can be determined ranges between 55.2% and 97.3% of the population using the normal distribution; and 53.8% and 91.6% of the population using the uniform distribution. Without giving any hints to anyone who might desire to determine the triad of data points necessary to identify an individual in this study, we should say that it is in many cases possible just from a public computer, without any special privileges to access private information. Nor is it restricted to potential attackers within a specific geographic proximity to the individual.
It is certainly the case that there are many databases, many with reasona- ble security, that will contain the birthdate, age, gender and address of an individual. However, even minimal security (for example, password access) may be sufficient to deter many attackers, although not sufficient to deter a skilled hacker.
But it is not necessarily the case that the skill level of the adversary be that high. For example, earlier in this article, we referred to “dumpster diving”. A
Analysis of Risks to Data Privacy Throughout European Countries 39
potential prey could be victimized not through any computer-based attack, but by an attacker who is willing to rummage through trash containers at the victim’s residence; or, even if the attacker is at a considerable distance from the victim, even in a far-off country, it may be possible for the attacker to identify a person in the victim’s neighborhood to carry out the “dumpster” attack.
Finally, it is possible with sufficient Internet searching, to be able to find certain Internet databases which can return some or all of the sought-after identifying data points described above as the triad.
REFERENCES
Patterson, W. and C. Winston-Proctor, “An International Extension of Sweeney’s Data Privacy Research”. Advances in Human Factors in Cybersecurity, Tariq Ahram and Waldemar Karwowski, eds., Proceedings of the AHFE 2019 Inter- national Conference on Human Factors in Cybersecurity, July 24–28, 2019, Washington D. C., USA, pp. 28–37. Sweeney, L: “Simple Demographics Often Identify People Uniquely”. Carnegie
Mellon University, Data Privacy Working Paper 3. Pittsburgh (2000). United Nations. https://population.un.org/wpp/Download/Standard/Population/ World Health Organization. http://apps.who.int/gho/data/node.main.688?lang=en Wikipedia. https://en.wikipedia.org/wiki/List_of_postal_codes
LISTED IN THE AHFE DIGITAL BOOKSTORE CATALOGUE
Explore the complete digital volume
Human Factors in Cybersecurity
Read this individual research paper free through the original publisher, or explore the full digital proceedings book.
ISBN 978-1-958651-67-4
Explore this ISBN in the AHFE Bookstore ↗Listed in the July 2026 bookstore catalogue; search by ISBN to confirm current availability · Digital book purchase optional