Harsh Katakwar, Palvi Aggarwal, Varun Dutt (2023). Modeling the effects of different honeypot proportions in a deception-based security game. In: Human Factors in Cybersecurity. AHFE Open Access, vol. 91, pp. 132–145. https://doi.org/10.54941/ahfe1003727
Cyber-attacks, an intentional effort to steal information or interrupt the network, are growing dramatically. It is of great importance to understand how an adversary’s behavior might impact the detection of threats. Prior research in adversarial cybersecurity has investigated the effect of different honeypot variations on adversarial decisions in a deception-based game experimentally. However, it is unknown how different honeypot variation affects adversarial decisions using cognitive models. The primary objective of this research is to develop the cognitive model using Instance-based learning theory (IBLT) to make predictions for decisions for networks with different honeypot proportions. The experimental study involved the use of a deception game (DG): small, medium, and large. The DG is defined as DG (n, k, γ), where n is the number of servers, k is the number of honeypots, and γ is the number of probes that the opponent makes before attacking the network. The DG had three between-subject conditions, which denoted three different honeypot proportions. Human data in the experimental study was collected by recruiting 60 participants who were randomly assigned one of the three between-subject conditions of the deception game (N = 20 per condition). The results revealed with an increase in the proportion of honeypots, the honeypot and no-attack actions increased significantly. Next, we built two Instance-based Learning (IBL) models, an IBL model with calibrated parameters (IBL-calibrated) and an IBL model with ACT-R parameters (IBL-ACT-R), to account for human decisions in conditions involving different honeypot proportions in a deception-based security game. It was found that both IBL-calibrated and IBL-ACT-R models were able to account for human behavior across different experimental conditions. In addition, results revealed a greater reliance on the recent and frequent occurrence of events among the human participants. We highlight the key importance of our research for the field of cognitive modelling.
Modeling the Effects of Different Honeypot Proportions 133
of digital infrastructure and services, cyberattacks have become more pre- valent (Jeffery & Ramachandran, 2021). Modern cyberattacks are complex and hazardous, necessitating the development of robust solutions to combat them. Though there exist solutions to combat some of these cyberatta- cks, these solutions may not help in completely rescuing from modern cyberattacks (Katakwar et al., 2020; Shang, 2018).
Previously, there have been some solutions that have been applied and demonstrated to be effective in the real world to defend against these threate- ning cyberattacks. Some of them include Intrusion Detection Systems (IDS), filtering strategy, and deception (Aggarwal & Dutt, 2020; Scarfone & Mell, 2007; Shang, 2018). IDS monitors network traffic and generates warnings when suspicious activity is detected. These systems have proven to be impe- rvious to modern cyberattacks; however, they may generate false alarms, resulting in significant monetary loss. Filtering strategy aids in the removal of malicious content from the network, enabling secure access to the network (Shang, 2018). Another technique that has proven to be useful in combating cutting-edge cyberattacks is deception (Katakwar et al., 2020).
Deception with honeypots in the cybersecurity domain has shown to be a useful tool in countering emerging cyberattacks (Aggarwal, Gonzalez & Dutt, 2016a; 2016b; Aggarwal et al., 2017; Katakwar et al., 2020). Prior research developed a tool called HackIT, where HackIT could simulate a cyber-attack situation by incorporating concepts from behavioural game theory (Agga- rwal & Dutt, 2020). HackIT was able to replicate real-world cyber-attack scenarios and it was helpful for developing an understanding of the human factors that may influence adversarial decisions in a complex environment. In HackIT, Aggarwal et al. (2020) manipulated the timing of deception as early and late and found that late deception is effective compared to early dece- ption for luring the attackers towards honeypots. Overall, HackIT was able to replicate results about human decisions in canonical games. Deception has been investigated via both mathematical and canonical games in the cyber- security domain (Carroll & Grosu, 2009; Garg & Grosu, 2007; Kiekintveld et al., 2015). Garg and Grosu (2007) developed a mathematical framework for a deception-based security game. Carroll and Grosu (2009) modeled the interaction between an adversary and a defender as a signaling game. How- ever, both investigations by Garg and Grosu (2007) and Carroll and Grosu (2009) applied Nash analyses of adversaries versus defenders without relying upon human participants as adversaries or defenders.
Recent research in cybersecurity domain has focused on understanding the impact of a number of cyber technology factors on human decisions in the various cyber situations (Aggarwal et al., 2020; Katakwar et al., 2020, 2022a, 2022b). Some of these factors include the network size and the timing of dece- ption as playing a significant role in affecting adversarial decision-making. For example, Katakwar et al. (2020) investigated how different network sizes influenced the adversarial decisions in the presence of honeypots in a deception-based security game. Similarly, Aggarwal et al. (2016b) investi- gated the timing of deception and found that the proportion of honeypot attacks were greater for late deception compared to early deception. One
of the key technology factors that could be investigated next is the propor- tion of honeypots present in the network. This factor is important because honeypots have traditionally been used as a tool to lure adversaries into a trap (Píbil et al. 2012). In fact, Píbil et al. (2012) showed that choosing the optimal number of honeypots in the network may help in misguiding the attacker away from the real systems. Though some preliminary research has focused on the honeypot proportion factor in human experiments recently (Katakwar et al., 2022b), computational cognitive models that investigate the reasons for human decisions against different honeypot proportions are yet to be built. In this research, we address this literature gap by building computational cognitive models that would account for human decisions in situations that vary in the proportion of honeypots in the network.
First, we briefly describe a deception-based game. Next, we discuss the experiment where we investigated how human adversarial decisions are influ- enced by the proportion of honeypots in the deception game. Thereafter, we report an analysis of human data collected in the experiment. Further- more, we present the results from computational cognitive models, where these models try to account for human decisions in the experiment. Lastly, we discuss the implications of the developed cognitive models in the real world.
Deception Game Deception Game (DG) is a sequential, single-player, and incomplete infor- mation game between the network and the adversary (Aggarwal, Gonzalez & Dutt, 2017; Garg & Grosu, 2007). The game is denoted using the fol- lowing notation, DG (n, k, γ ), where n refers to the size of the network, k denotes the number of honeypots in the network, and γ depicts the num- ber of probes before making the final decision to attack the network. The DG had two kinds of webservers, regular and honeypot. Regular webservers were the real systems; whereas the honeypot webservers were the fake web- servers that mimicked the real webservers. DG had multiple rounds, with each round consisting of probe phase followed by attack phase. In the probe phase, the adversary may probe one of the webservers present in the network. In DG, probing a webserver meant clicking the button present on the DG’s interface, which represented a webserver in the network. On probing a web- server, the adversary received feedback from the network based on its action. If a particular round had deception present in it, then the adversary recei- ved the incorrect information. However, if the deception was not present in a particular round, then the adversary received the correct information about the webservers. In the attack phase of DG, the adversary had the option to attack one of the webservers of the network. In DG, attacking the network meant clicking one of the buttons denoting the webserver present in the DG’s interface. Once the adversary completed a round, the adversary received the scores based on her actions of probe and attack phases for a particular round. Likewise, on completion of multiple rounds, the adversary received the cumu- lative score for her actions. Table 1 denotes the payoff for each action in the probe and the attack stages of DG. The DG was configured as DG (20,
Modeling the Effects of Different Honeypot Proportions 135
Table 1. Payoffs for different actions in the probe and attack stages.
Honeypot webserver attack −10 No webserver attack 0
Attack
5, 5), DG (20, 10, 10), and DG (20, 15, 15) for small, medium, and large conditions, respectively.
Experiment Experiment Design The experiment contained three different between-subjects conditions with different honeypot proportions. These conditions were: small, medium, and large. In small condition, 25% of the webservers were honeypot webservers in the network. In medium condition, 50% of the webservers were honeypot webservers in the network. Similarly, in the large condition, 75% of the web- servers were honeypot webservers in the network. In each of these conditions, the number of webservers was kept constant at 20. So, DG was configured as DG (20, 5, 5) for small, DG (20, 10, 10) for medium, and DG (20, 15, 15) for large, respectively. The number of probes was kept identical to number of honeypots, so that adversary got adequate chances to probe the honey- pots to gain insights of the network. All three conditions had 29 trials: 14 trials had deception, while the remaining 15 trials had no deception. The presence of deception and non-deception trials was randomized once and this randomized order was kept the same for all participant across all condi- tions. Participants were not aware of the presence of deception in a round in the DG. For each round across all the conditions, the honeypot and regular webservers were assigned randomly to buttons on the game’s interface.
Participants This study was conducted after approval of the Ethics Committee at the Indian Institute of Technology Mandi with written consent from all partici- pants. Sixty human participants were recruited via Amazon Mechanical Turk (Mason & Suri, 2012). Eighty-two percent of the participants were males, while the rest of the participants were females. The age of the participants ranged between 18 years and 64 years (median = 29 years, mean = 30 years, and standard deviation = 6 years). Ninety-five percent of participants had a college degree, while the rest were still pursuing a college degree. Around 63% of the participants were from the Science, Technology, Engineering, and Mathematics (STEM) background. Participants were paid INR 50 (USD 0.7)
after the study for participation. The top three scorers of the game were cho- sen for the lucky draw contest, and one of these participants was randomly selected for a gift voucher of INR 500 (USD 7.14).
Procedure In the experiment, participants were instructed about their roles and goal in the DG. In addition, participants were also informed about their actions and payoffs associated with their actions. Participants were asked to increase their payoff as much as possible over the multiple rounds of DG. Partici- pants were told through text instructions about the presence of deception and non-deception rounds in DG; however, they did not know which rounds had deception and non-deception present in them. Also, in each round, con- figuration of regular and honeypot webservers was randomized such that proportion of regular and honeypot webservers was kept according to the conditions. Each round of DG had two phases: probe and attack. In probe stage, the adversary may probe a few webservers or may not probe any of them and proceed ahead. Similarly, in the attack phase, the adversary had the option to attack one of the webservers or she may not attack any of them. Once the study was completed, participants were thanked and paid for their participation.
Results
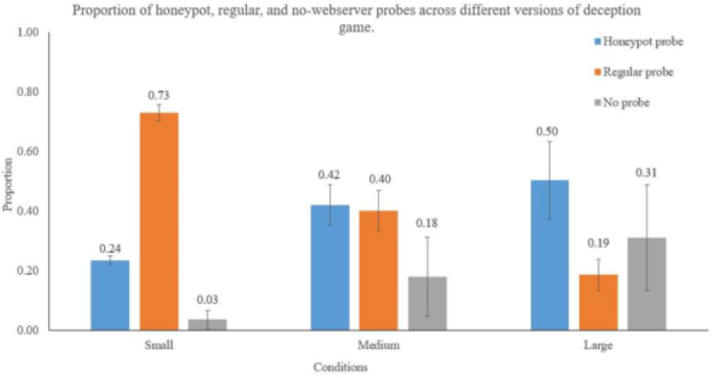
Influence of Different Honeypot Proportions During the Probe Stage We analyzed the different probe decisions in different conditions with varied honeypot proportions in the DG. The different conditions with the variation in honeypot proportions significantly influenced the regular probe (F (2, 59) =121.438, p <.001, η2 = .810), honeypot probe (F (2, 59) = 11.329, p <.001, η2 = .284), and no webserver probe (F (2, 59) = 4.953, p <.05, η2 = .148). Figure 1 shows the different proportion of probe decisions (regular probe, honeypot probe, no webserver probe) across the conditions with different honeypot proportions.
As per Figure 1, the proportion of honeypot webserver probe in small, medium, and large conditions were 0.24, 0.42, 0.50, respectively. Since the sample size was kept constant across all three conditions, we performed the Tukey post hoc test. As per the Tukey post hoc test, the proportion of honey- pot webserver probes in small condition was significantly smaller compared to that of medium condition (p <.05) and large condition (p <.001). In addi- tion, there was no significant difference between the proportion of honeypot webserver probes in medium and large conditions (p = 0.32). Similarly, the proportion of regular probes in small, medium and large conditions were 0.73, 0.40, and 0.19, respectively. As per the results from the Tukey post hoc tests, the proportion of regular probes in the large condition was smaller compared to that of the medium (p <.001) and large (p <.001) condition. Likewise, the proportion of no webserver probes in small, medium, and large conditions were 0.03, 0.18, and 0.31, respectively. As per Tukey post hoc tests, the proportion of no webserver probe was significantly smaller compared to that of medium and large condition.
Modeling the Effects of Different Honeypot Proportions 137
Figure 1: Proportion of probe decisions across DG with different honeypot proportions. The error bar denotes the 95% confidence interval around the estimate.
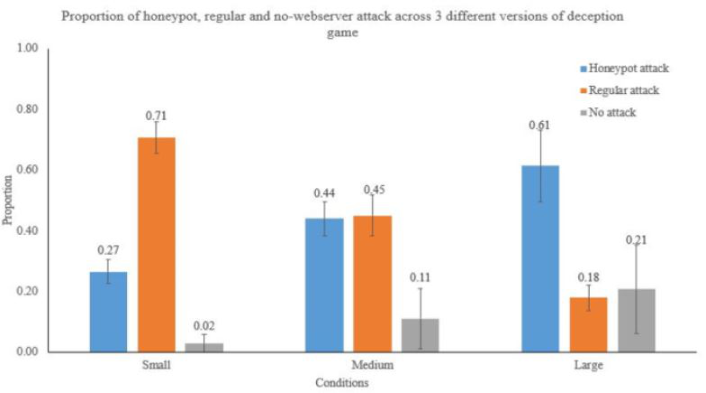
Influence of Different Honeypot Proportions During the Attack Stage Similarly, we analyzed the different attack decisions in DG with different honeypot proportions. The different conditions of DG significantly influe- nced the regular attack (F (2, 59) =103.115, p <.001, η2 = .783), honeypot attack (F (2, 59) = 21.808, p <.001, η2 = .433), and no webserver attack (F (2, 59) = 3.294, p <.05, η2 = .104) decisions. Figure 2 shows the pro- portion of different attack decisions across three different conditions of DG.
As per Figure 2, the proportion of honeypot attack decisions in small, medium, and large conditions were 0.27, 0.44, and 0.61, respectively. Since
Figure 2: Proportion of different attack decisions across DG with different honeypot proportions. The error bar denotes the 95% confidence interval.
the sample size was kept constant across all the conditions, so we perfor- med Tukey’s post hoc test. As per Tukey’s post hoc test, the proportion of honeypot attack decisions in small condition was smaller compared to the proportion of honeypot attack decisions in medium and large conditions. In addition, there was a larger difference between the proportion of honeypot attack decisions in the small and large conditions, and there was a smaller dif- ference between the small and medium conditions. Similarly, the proportion of regular attack decisions in small, medium, and large conditions were 0.71, 0.45, and 0.18, respectively. As per Tukey’s post hoc test, the proportion of regular attack decisions was smaller in the large conditions compared to the medium and large conditions. Also, there was a larger difference between the proportion of regular attack decisions in the small and large conditions and a smaller difference between the proportion of regular attack decisions in the small and medium conditions. Likewise, the proportion of no webserver attack decisions in small, medium, and large conditions were 0.02, 0.11, and 0.21, respectively. As per Tukey’s post hoc test, the proportion of no web- server attacks in the small condition was significantly smaller compared to the large condition. In addition, there was no difference between the propor- tion of no webserver attacks in the small and the medium conditions. Also, there was no significant difference between the proportions of no webserver attacks in the medium and large conditions.
The IBL Model Instance-based learning theory, a theory of decisions from experience for the complex situations. Prior research in computational modeling via cognitive theories such as IBL has been proven to be useful in predicting human beh- avior in complicated circumstances. In an IBL model (Gonzalez et al., 2003; Gonzalez & Dutt, 2011, 2012; Dutt & Gonzalez, 2012; Dutt et al., 2013), the instances are built in the memory for each occurrence of an outcome on choice options. An instance in the model has the following triplet structure: situation-decision-utility. The situation in the instance denotes the current situation, the decision depicts to the decision made in the current situation, and utility is the outcome obtained for decision made in the current situation. When a decision is to be made, the instances of each option are recalled from the memory. Thereafter, for each option, these instances are then blended. The blended value of an option is computed by the activation of instances as well as their probability of being recalled from the memory. The blended value of an option j in any trial t is defined as:
Equation reproduced from the original PDF.
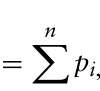
where pi,j,t is the probability of recalling an instance i for an option j in the tth trial of experiment; xi,j,t is refers to the utility value of an instance i for an option j in the trial t. The model in each trial chooses the option having the maximum blended value. The above equation computes the blended value for each option which is calculated as the sum of all observed outcomes weighted
Modeling the Effects of Different Honeypot Proportions 139
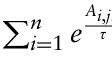
by the probability of their retrieval. The probability of the retrieval is defined as
Equation reproduced from the original PDF.
τ
τ Pn
Equation reproduced from the original PDF.
where Ai,j,t denotes the activation value of an instance i corresponding to the choice j present in the memory; τ is the random noise, which is defined as τ = σ * 2 and σ is the free cognitive noise parameter to represent the uncer- tainty of retrieving the prior experiences from the memory. The activation value of the instance in a given trial is a determined by the frequency with which its outcome occurs and the time difference between current time and the past time when the instance’s outcome occurred in a task. For each trial t, activation value of an instance i is defined as:
[Equation or mathematical symbol available in the original paper PDF]
[Equation or mathematical symbol available in the original paper PDF] )
Ai = In
(t −tp,i)−d
[Equation or mathematical symbol available in the original paper PDF] X
[Equation or mathematical symbol available in the original paper PDF]+ σ ∗In(1 −γi,t γi,t
tp,i∈1,...t−1
where, σ and d are the free parameters known as memory decay and cogni- tive noise respectively; t is the current trial; tp,i are the prior trials in which outcome with instance i occurred in the task; and γ i,t is the random number chosen from the uniform distribution between 0 and 1. So, the frequency of occurrence of outcomes in the task and the recency of those outcome obse- rvations increase the activation of an instance corresponding to the observed outcome. The decay parameter d accounts for dependency in the recent infor- mation. The higher the value of the d parameter, the greater the reliance on recent information, and the faster is the decay of memory. The σ para- meter accounts for the variation in activation of instance from sample to sample. The instance structure in the model consisted of the webserver deci- sion, ground truth, and utility value associated with it. The webserver in the instance denoted the webserver number the adversary probed or attacked in the deception game. The ground truth depicted the kind of webserver, i.e., regular and honeypot, the adversary probed or attacked. The third attribute of the instance was the utility value. The utility value was the reward corre- sponding to the adversary’s decision and the ground truth. The model was fed with human decisions and feedback for the probe phase.
Calibration of Model Parameters We considered two versions of the IBL model. The first version of IBL model had calibrated parameters of d and σ, which was referred as IBL-calibrated. The second version of the IBL model had the default values of ACT-R for the d and σ parameters as 0.25 and 0.50, respectively, called the IBL-ACT- R model. In IBL-calibrated model, we found the best values of d and σ using the human data of experiment for a different proportion of honey- pots. Twenty model participants were run in the IBL model across different trials. For different honeypot proportion conditions, we had a different
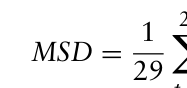
set of d and σ values. In this model, we tried to minimize the sum of Mean Squared Deviations (MSD) on proportion of attack decisions (regular attack, honeypot attack, not attack) between human and model across the 29 trials.
29 X
Equation reproduced from the original PDF.
(modelt −humant)2
29
Equation reproduced from the original PDF.
where, t refers to the trail from 1 to 29; modelt and humant refers to the attack decisions (regular webserver attack, honeypot webserver attack, or no webserver attack) in the trial t from model and human participants, respecti- vely. For all the three attack decisions, MSD value was calculated. Thereafter, the three MSD values for three kind of attacks (regular webserver attack, honeypot webserver attack, and no webserver attack) were summed, which was referred to as total MSD. So, if the value of the total MSD was small, then better is the model’s fit to human data. Genetic Algorithm, an optimi- zation algorithm, was used to optimize the values of d and σ parameters for both the model participants. This optimization algorithm makes use of bio-inspired operators such as mutation, crossover, and selection to build better solutions for optimization problems. The utility value for the regu- lar webserver, honeypot webserver and no probe/attack in the pre-populated instances were varied in the range from −100 to 100 in the genetic algori- thm, whereas d and σ parameters were varied in the range from 0 to 10. The ranges of the parameter guaranteed that the optimization could confiden- tly capture the optimal values of both parameters. The values of crossover and mutation rates in the genetic algorithm were set at 80% and 1%, respe- ctively. The IBL-ACT-R model was built upon the ACT-R theory, a theory of cognition that has been accounted for various phenomena of cognitive science (Anderson, Matessa & Lebiere, 1997). The IBL-ACT-R model here refers to an agent that is less reliant on recent information, frequency, and variability in decision-making. In IBL-ACT-R model, default values of d and σ were 0.50 and 0.25, respectively. Smaller values of d show less reliant on frequency and recency of information, and smaller values of σ indicate smaller variability in trial-to-trial decisions. We did a performance comparison between both the models.
Model Results
Table 2 shows the values of free parameters and MSD between human and model for different conditions of both models. The d and σ are the free para- meters of the models where d parameter denotes the decay of the memory and σ denotes the variation in the trial-to-trial decisions. In the IBL-calibrated model, d value was maximum for large condition (d = 8.40) and mini- mum for small condition (d = 1.75). Similarly, σ value was maximum for the medium condition (σ = 8.48) and minimum for the large condition
Modeling the Effects of Different Honeypot Proportions 141
Table 2. Model parameters, MSD across different conditions for the IBL-calibrated model and the IBL-ACT-R model, and utility value of the pre-populated insta- nces of regular webserver, honeypot webserver, and no actions.
Table available in the original PDF paper.
Condition Model d σ Utility value for dif- ferent actions
MSD for different attack actions
Total MSD (Sum of MSDs)
No action
Regular webserver
Honeypot webserver
Honeypot webse- rver
Regular web- server
No web- server Attack 1.75 3.26 −13.82 86.29 −18.27 0.001 0.013 0.012 0.026
Small Calibrated Model 0.50 0.25 −13.82 86.29 −18.27 0.030 0.029 0.002 0.061 ACT-R Model 3.36 8.48 −69.16 1.10 −8.66 0.016 0.017 0.006 0.039 Medium Calibrated Model
0.50 0.25 −69.16 1.10 −8.66 0.038 0.035 0.015 0.088 ACT-R Model 8.40 0.67 −70.44 2.63 −5.93 0.006 0.013 0.011 0.030 Large Calibrated Model
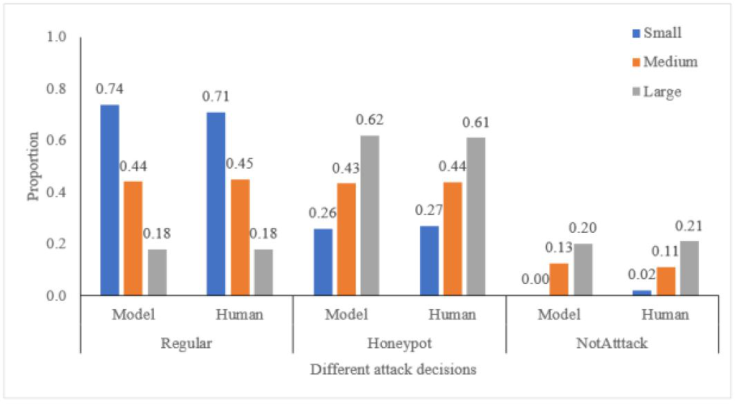
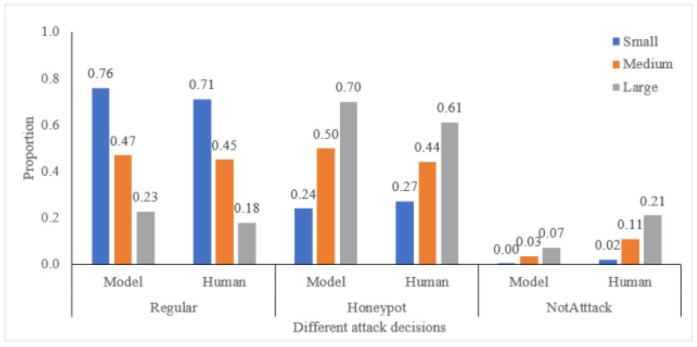
(σ = 0.67). The total MSD value for the three attack actions of the IBL- ACT-R model across all the conditions were higher compared to the total MSD value of the calibrated model.
Figure 3 shows the proportion of the regular webserver attack, honeypot webserver attack, no webserver attack decisions across the different conditi- ons with variation in honeypot proportions of DG in the calibrated model. Figure 4 shows the proportion of regular webserver attack, honeypot webse- rver attack, no webserver attack across the different conditions with different honeypot proportions in DG in the IBL-ACT-R model.
Figure 3: Proportion of different attack actions across the different conditions of DG in the IBL-calibrated model.Figure 4: Proportion of different attack actions across different conditions of DG in the IBL-ACT-R model.
DISCUSSION AND CONCLUSION With the increase in cyberattacks, there has been a need for a tough solution to combat the cyber-attacks. Deception via honeypot has been proven to be an effective technique to defend against modern cyber-attacks (Aggarwal & Dutt, 2020; Katakwar et al., 2020). Prior research in this field has developed and used abstract games to understand the role of deception in cybersecu- rity. However, research is yet to develop a computational cognitive model that will account for human decisions in cyber situation where the propor- tion of honeypot webservers in the network are varied. When there was an increase in the proportion of honeypot webserver probes, we found an incre- ase in the no webserver probe and honeypot probe actions and a decrease in the regular probe actions. Similarly, in the attack stage, with the increase in the proportion of honeypot webservers in the network, there was an incre- ase in not-attack and honeypot attack actions and decreased regular attack actions. These results can be explained with the help of cognitive theories like IBLT. As per IBLT, people choose those options that maximize blended values. The increase in the proportion of honeypot webservers in the netw- ork increases the likelihood of probing/attacking the honeypot webservers. However, on probing/attacking the honeypot webservers, the adversary gets awarded with negative points, which increases the instances with losses in the memory compared to instances with gains. This influences the adversa- rial decision-making and provokes him to avoid risk by probing/attacking the webservers, leading to an increase in no-probe and not-attack actions. Next, we calibrated an IBL model to the human data collected in the experiment. The calibrated model revealed the reliance on the recent information and the frequency of occurrence among the human participants. As the proportion of honeypot webservers increased, we found an increase in the decay value. This demonstrated that participants were more dependent on the recently available information. Hence, we see a decrease in regular webserver attacks
Modeling the Effects of Different Honeypot Proportions 143
and an increase in honeypot webserver attacks on increasing the honeypot proportions. In addition, we found the utility values of prepopulated insta- nces of regular webserver probe/attack, and no webserver probe/attack were negative; however, it was positive for honeypot webserver probe/attack. This indicated that the increasing proportion of honeypots coupled with the prese- nce of deception perhaps prompted participants to value honeypots more as servers to attack. Furthermore, we also found that participants showed less cognitive noise in their decisions when honeypot proportions were small or large compared to the conditions with 50% of the webservers as honeypots. One likely reason for this finding could be that smaller and larger number of honeypots provided participants consistent environments; whereas, the 50% honeypot condition made participants puzzled due to unexpected network responses. One support for this reasoning is that we see a nearly equal pro- portion of regular and honeypot attacks in the medium condition. However, in the other conditions (i.e., small and large conditions), the adversary had a clear understanding of the different kinds of webserver in the network. As a result, we see more regular and honeypot attacks in the small and large conditions, respectively. As our research was lab-based experiment, it has some constraints, and the findings of the study should be regarded in that context. The conditions or situations in the real world may differ from a lab- based experiment. Also, the participant acting as the hacker did not have the knowledge about deception and non-deception rounds of the DG. Moreo- ver, they did not have the knowledge about the kind of webserver present. We tried our best to replicate the real-world scenario in our experiment. So, some of the results from this research are likely to have applications in the real world. One application of the model developed is that it could be used to per- form penetration testing of the networks involving honeypots to determine exploitable vulnerabilities. Furthermore, the developed model can help cyber- security organizations to build decision support systems for inexperienced defenders or cyber analysts to decrease cyberattacks. In the future, we would investigate how varying proportions of deception and non-deception rounds affect adversarial decision-making in DG. Furthermore, we would investi- gate the influence of different combinations of deception and non-deception rounds on adversarial decisions in the DG. Another option would be to inve- stigate the effectiveness of deceptive technologies against various kinds of cyberattacks against networks. These are some of the ideas we would like to explore deeper in our upcoming studies.
REFERENCES
Aggarwal, P., Gonzalez, C., & Dutt, V. (2016a). Looking from the hacker’s perspective: Role of deceptive strategies in cyber security. 2016 International Conference on Cyber Situational Awareness, Data Analytics and Assessment, CyberSA 2016. https://doi.org/10.1109/CYBERSA.2016.7503288 Aggarwal, P., Gonzalez, C., & Dutt, V. (2016b). Cyber-security: Role of deception
in cyber-attack detection. Advances in Intelligent Systems and Computing, 501, 85–96. https://doi.org/10.1007/978-3-319-41932-9_8
Aggarwal, P., Gonzalez, C., & Dutt, V. (2017). Modeling the effects of amount and timing of deception in simulated network scenarios. 2017 International Confere- nce On Cyber Situational Awareness, Data Analytics And Assessment (Cyber SA), 1–7. https://doi.org/10.1109/CyberSA.2017.8073405 Aggarwal, P., Moisan, F., Gonzalez, C., & Dutt, V. (2018). Understanding Cyber
Situational Awareness in a Cyber Security Game involving. International Jour- nal on Cyber Situational Awareness, 4(1), 11–38. https://doi.org/10.22619/ijcsa. 2018.100118 Aggarwal, P., & Dutt, V. (2020). The role of information about opponent’s actions and intrusion-detection alerts on cyber decisions in cyber security games. Cyber Security: A Peer-Reviewed Journal, 3(4), 363–378. Almeshekah, M. H., & Spafford, E. H. (2016). Cyber security deception. In Cyber
Deception: Building the Scientific Foundation (pp. 23–50). Springer International Publishing. Carroll, T. E., & Grosu, D. (2009). A game theoretic investigation of deception in network security. Proceedings - International Conference on Computer Commu- nications and Networks, ICCCN. https://doi.org/10.1109/ICCCN.2009.5235344 Dutt, V., Ahn, Y. S., & Gonzalez, C. (2013). Cyber situation awareness: Modeling
detection of cyber attacks with instance-based learning theory. Human Factors, 55(3), 605–618. https://doi.org/10.1177/0018720812464045 Dutt, V., & Gonzalez, C. (2012). Making Instance-based Learning Theory usable and understandable: The Instance-based Learning Tool. Computers in Human Behavior, 28(4), 1227–1240. https://doi.org/10.1016/j.chb.2012.02.006 Garg, N., & Grosu, D. (2007). Deception in honeynets: A game-theoretic analysis.
Proceedings of the 2007 IEEE Workshop on Information Assurance, IAW, 107– 113. https://doi.org/10.1109/IAW.2007.381921 Gonzalez, C., & Dutt, V. (2011). Instance-Based Learning: Integrating Sampling and Repeated Decisions From Experience. Psychological Review, 118(4), 523–551. https://doi.org/10.1037/a0024558 Gonzalez, C., & Dutt, V. (2012). Refuting data aggregation arguments and how
the instance-based learning model stands criticism: A reply to Hills and Her- twig (2012). Psychological Review, 119(4), 893–898. https://doi.org/10.1037/ A0029445 Gonzalez, C., Lerch, J. F., & Lebiere, C. (2003). Instance-based lear- ning in dynamic decision making. Cognitive Science, 27(4), 591–635. https://doi.org/https://doi.org/10.1016/S0364-0213(03)00031-4 Jeffery, L., & Ramachandran, V. (2021, July 8). Why ransomware attacks are on the rise — and what can be done to stop them. PBS. Retrieved from https://www.pbs.org/newshour/nation/why-ransomware-attacks-are-on-th e-rise-and-what-can-be-done-to-stop-them Katakwar, H., Aggarwal, P., Maqbool, Z., & Dutt, V. (2020). Influence of Netw-
ork Size on Adversarial Decisions in a Deception Game Involving Honeypots. Frontiers in Psychology, 11, 2385. Katakwar, H., Aggarwal, P., Maqbool, Z., & Dutt, V. (2022a). Influence of probing action costs on adversarial decision-making in a deception game. In ICT Analysis and Applications (pp.649–658). Springer, Singapore. Katakwar, H., Uttrani, S., Aggarwal, P., & Dutt, V. (2022b). Influence of different
honeypot proportions on adversarial decisions in a deception game. In Procee- dings of the Human Factors and Ergonomics Society Annual Meeting (Vol. 66, No. 1, pp. 120–124). Sage CA: Los Angeles, CA: SAGE Publications. Kiekintveld, C., Lisý, V., & Píbil, R. (2015). Game-theoretic foundations for the strategic use of honeypots in network security. Advances in Information Security, 56, 81–101. https://doi.org/10.1007/978-3-319-14039-1_5
Modeling the Effects of Different Honeypot Proportions 145
Luxner, T. (2021). Cloud Computing Trends: 2021 State of the Cloud Report | Flexera Blog. Flexera. Retrieved from https://www.flexera.com/blog/cloud/cloud-c omputing-trends-2021-state-of-the-cloud-report/ Mason, W., & Suri, S. (2012). Conducting behavioral research on Amazon’s Mech-
anical Turk. Behavior Research Methods, 44(1), 1–23. https://doi.org/10.3758/ S13428-011-0124-6 Píbil, R., Lisý, V., Kiekintveld, C., Bošanský, B., & Pˇechouˇcek, M. (2012). Game Theoretic Model of Strategic Honeypot Selection in Computer Networks. Lecture Notes in Computer Science (Including Subseries Lecture Notes in Artificial Intel- ligence and Lecture Notes in Bioinformatics), 7638 LNCS, 201–220. https://doi. org/10.1007/978-3-642-34266-0_12 Scarfone, K., & Mell, P. (2007). Guide to intrusion detection and prevention systems
(idps). NIST Special Publication, 800(2007), 94. Shang, Y. (2018). False Positive and False Negative Effects on Network Attacks.
Journal of Statistical Physics, 170(1), 141–164. https://doi.org/10.1007/s10955- 017-1923-7 Shang, Y. (2020). Consensus of Hybrid Multi-Agent Systems with Malicious Nodes.
IEEE Transactions on Circuits and Systems II: Express Briefs, 67(4), 685–689.
LISTED IN THE AHFE DIGITAL BOOKSTORE CATALOGUE
Explore the complete digital volume
Human Factors in Cybersecurity
Read this individual research paper free through the original publisher, or explore the full digital proceedings book.
ISBN 978-1-958651-67-4
Explore this ISBN in the AHFE Bookstore ↗Listed in the July 2026 bookstore catalogue; search by ISBN to confirm current availability · Digital book purchase optional