Maoyu Li, Lizhong Yang, Ping Zhang, Nan Jiang, Xinmiao Jia, Hanchen Yu (2023). Single-file movement experiments of male under the influence of rhythm. In: Human Factors and Systems Interaction. AHFE Open Access, vol. 84, pp. 318–328. https://doi.org/10.54941/ahfe1003618
Reducing congestion to ensure people's safety has been widely concerned. Rhythm may be a potential way to adjust pedestrian flow. Considering that different gender groups may have different responses to rhythm, this study mainly conducted a series of single-file experiments on the effects of rhythm on male behavior. The distribution of speed mostly conform to a Gaussian distribution in different runs. The stop-and-go phenomenon appears when the density is beyond 1.35 ped/m. As the density increases, the frequency of long stop time becomes higher. The fundamental diagrams with rhythm are obtained. The boundary density between the free and constrained phases is 0.5 ped/m. When the density is 1 ped/m, the maximum flow rate 0.8 ped/s is reached. Meanwhile, the relationship between headway and individual velocity is fitted piecewise and two stages can be found. The findings can help to understand the movement characteristics of male under rhythmic influence.
With the acceleration of urbanization, more and more people flood into cities, which brings great challenges to the personnel control in public pla- ces. Stampede and evacuation-related events happen frequently all over the world, causing huge loss of life and property. How to control the crowd and improve the pedestrian flow so as to ensure the safety of the people has attracted extensive attention of researchers.
To improve the pedestrian flow, many methods have been adopted, such as placing barriers (Karbovskii et al., 2019), and installing diversion facilities (Zhuang et al., 2018, Shi et al., 2022), etc. In addition, rhythm as a potential way to improve pedestrian flow has also attracted interests of researchers recently (Johnson, 2017, Maculewicz et al., 2016, Zeng et al., 2022, Yanagi- sawa et al., 2012, Zeng et al., 2019). Different types of music (motivational and nonmotivational music) and different commands (listen to or follow the music) affect pedestrian movement (Zeng et al., 2022). When people walk with a slow rhythm, the flow of pedestrians becomes greater (Yanagisawa et al., 2012). Active music can increase the speed, while relaxing music will
Single-File Movement Experiments of Male Under the Influence of Rhythm 319
decreases the speed (Leman et al., 2013). Styns et al. (2007) further explo- red the effect of tempi on humans walk behavior in the range of 50 and 190 beats per minute. The pedestrian speed increases gradually with the rhythm and reaches a relative stability at 114 beats/min. Zeng et al. (2019) con- ducted a series of single-file experiments to study pedestrian dynamics with background music. In the background music, the stop-and-go behavior of pedestrians is more frequent at medium and high densities, resulting in smal- ler velocity and flow than those under normal conditions. Above all, rhythm has an important effect on pedestrian movement and may be a potential method of regulating the pedestrian flow. However, the mentioned studies mostly focused on the effect of rhythm on mixed sex crowds. Little research has been conducted on the effects of rhythm on people of different genders, while the perception of rhythm of different gender groups may further affect pedestrian flow differently. Therefore, in this study, the movement behavior of male under the influence of rhythm was firstly conducted.
Single-file pedestrian experiment is a common method to carry out pede- strian dynamics research in recent years, which is usually carried out in a circular channel (Jin et al., 2019, Ren et al., 2019, Seyfried et al., 2005, Cao et al., 2019). It limits pedestrian movement to one dimension and can study the longitudinal interaction between pedestrians. By this way, the fundamental diagram, speed-headway and gait information of pedestrian movement are obtained. Ren et al. (2019) compared the fundamental dia- gram of single-file experiment between the elderly and other age groups. The elderly have more ‘active cease’ behavior due to the least effort principle. Ma et al. (2020) conducted single-file pedestrian experiment to explore the move- ment characteristics of pedestrians at different available walking heights. They found that the speed distributions are subject to Gaussian distribution in different available heights. Jin et al. (2019) expanded the maximum global density to 4 ped/m and found that movement characteristics of pedestrians are affected by cultural differences. In conclusion, the single-file pedestrian experiment is a simple but effective method to study pedestrian movement characteristics.
In this research, the motion characteristics of male under the influence of rhythm are studied through single-file experiments with global density ran- ging from 0.18 ped/m to 1.86 ped/m, the findings of which can contribute to a better understanding of the effect of rhythm on male.
EXPERIMENTAL Experimental Setup
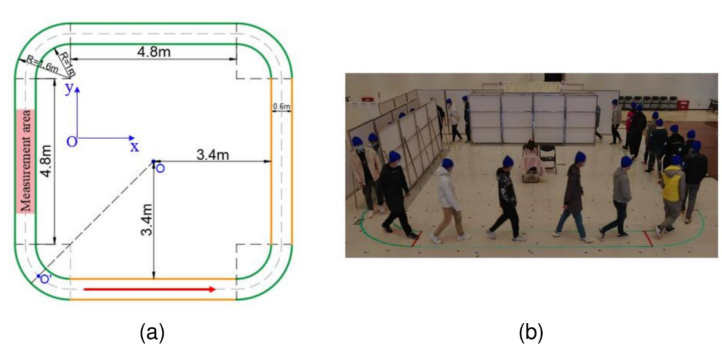
The experiment was conducted in 2020 with 70 male students on a campus in Hefei. The volunteers were mainly graduate and college students, with an average height of 176.1 cm and an average age of 21.38 years old. The sch- ematic diagram and snapshot of the experiment are shown in Fig. 1, taking the midpoint of the scene as the origin of coordinate (x = 0, y = 0). The experimental scene is a square channel connected by four 4.8 m long straight channels and four arcs with the inner radius 1 m and outer radius 1.6 m. The
Figure 1: (a) The illustration of experimental scene. (b) Screenshots of the experimental scene.
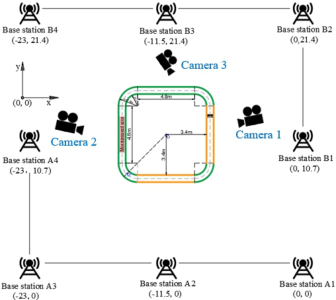
lower corridor and the right corridor boundary are constructed with parti- tions 2 m high and 1.2 m wide to restrict pedestrian movement. The rest of the scene is bounded by green tape on both sides. The centre circumference of the passage is 27.364 m and the width of the passageway is 0.6 m to avoid overtaking during movement. As this experiment studies the influence of rhy- thm on the flow of male, the metronome was placed in the central position of the experiment scene, i.e., the central position O in Fig. 1. A slow 70 Beat Per Minute (abbreviated to BPM) was selected as the tempo of the metro- nome in this study. Before each run, the staff arranged a certain number of participants evenly distributed in the corridor. When participants heard the command “start”, they moved counter clockwise in the direction of the red arrow in the corridor until they received the command “stop”. In a single-file experiment, global density ρg is the total number of participants divided by the central perimeter of the experiment scene. In this study, different global densities were achieved by varying the number of participants in the channel. Seven different densities from 0.18 ped/m to 1.86 ped/m were designed, cor- responding to 5, 10, 20, 28, 37, 46 and 51 participants respectively. Table 1 shows the details of the experimental conditions. To obtain enough steady- state data of pedestrians, the typical duration of the experiment is 1 minute in each run, which will be longer if the density is higher. The 3 m long left corridor was selected as measurement area, used for velocity, density and flow statistics. Three DJI cameras recorded the whole experiment process, as shown in Fig. 2.
Data Extraction In the experiment, UWB (Ultra Wide Band) position device with an accuracy of 0.01–0.1 m was used to extract pedestrian tracks. Eight 3-meter-high base stations were set up to surround the entire experimental scene, as shown in Fig. 2. Participants wore blue caps with active tags, which can send signals
Single-File Movement Experiments of Male Under the Influence of Rhythm 321
Table 1. Controlled conditions and the number of participants in each run.
to the base stations. Thus the real-time location coordinates and tracks of participants can be obtained according to the Time Difference of Arrival (TDOA) of the base station receiving tag signals combined with the location coordinates of the base station.
RESULTS AND ANALYSIS
Method
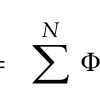
(1) Local measurement According to the literature (Seyfried et al., 2005), density is defined by volume fraction and its expression is:
Equation reproduced from the original PDF.
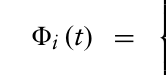
where 8i (t) is the volume fraction of pedestrian i in the measurement area at time t, which is determined by the characteristic time of i and his follower i+1 in the channel. The expression is:
t−tin
i
h tin i+1 i , tin
i tin
i for t ∈
i+1−tin
i
h 1 for t ∈ tin
Equations and mathematical formulas are available in the original paper PDF.
i
i+1, tin (2)
Equation reproduced from the original PDF.
i
h tout i , tout i+1
i + 1−t tout
i for t ∈
i+1−tout
0 otherwise
Equations and mathematical formulas are available in the original paper PDF.
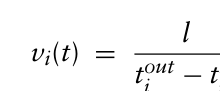
The speed at which an individual i passes through the measurement area is defined as the length l of measurement area divided by the time he or she passes through the measurement area. In this study, l = 3 m.
(3)
Equation reproduced from the original PDF.
The flow Ji(t) can be calculated by:
Ji(t) = ρi(t) · vi(t) (4) (2) Instantaneous measurement The instantaneous speed of pedestrian i is calculated as:
Equation reproduced from the original PDF.
1t (5) At the micro level, the distance headway of pedestrian i is calculated by:
dh,i(t) = xi−1(t) −xi(t) (6) where dh,i(t) represents the headway of pedestrian i at time t, defined as the distance between the centre of pedestrian i and predecessor i−1. xi(t) is the coordinates of pedestrian i at time t, 1t is a short time interval and 0.4 s is adopted in this paper.
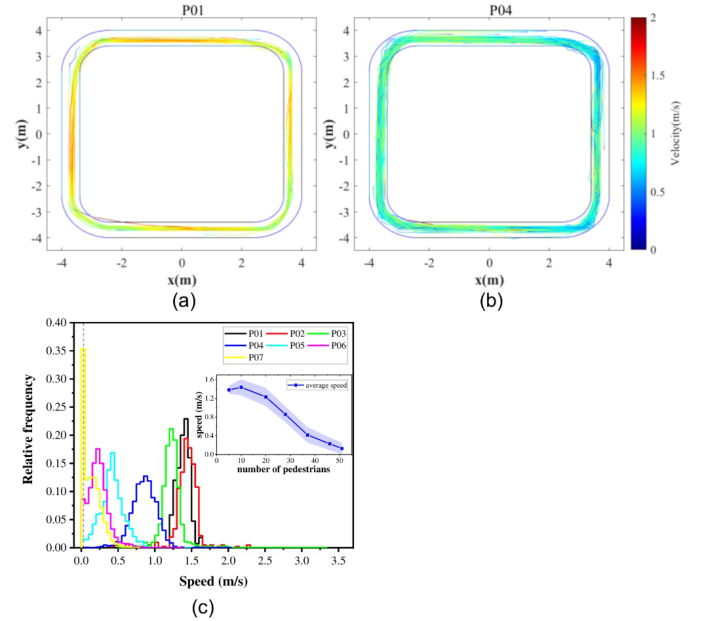
Trajectory and Velocity Taking P01 and P04 as example, the participants’ trajectories with velocities represented by different color are shown in Fig. 3(a)-(b). Based on the traje- ctories, motion characteristics of pedestrians such as speed, density and flow rate can be obtained. It can be observed that the speed in the straight lane is a little higher than that in the corner. Furthermore, Fig. 3(c) shows the distribu- tion of speed in measurement area under different working condition, with an embedded diagram illustrating average and standard deviation of velo- city. Obviously, the velocity seems a Gaussian distribution in different runs except for P07. Due to the high density in P07, the velocity has a high peak near zero, showing the existence of the stopping state of the pedestrians. As the number of pedestrians increases, the average speed decreases. While the number of pedestrians exceeds 37, the velocity variation decreases.
Space-Time Diagram The space-time graph can show the walking and stopping state of pedestrians. For the convenience of later analysis, the 2D coordinates will be converted to
Single-File Movement Experiments of Male Under the Influence of Rhythm 323
Figure 3: Trajectories with velocity represented by different color of (a) P01 and (b) P04; (c) the mean speeds with the standard deviation of measurement area in each run.
1D coordinates by projecting 2D coordinates onto the centreline of the squ- are channel. We choose the blue dot O’ in Fig. 1 as the starting point of the new coordinate system, and expand the original physical coordinates coun- ter clockwise along the centre line of the channel. The converted maximum coordinate is 27.364 m, equalling to the centre perimeter of the channel.
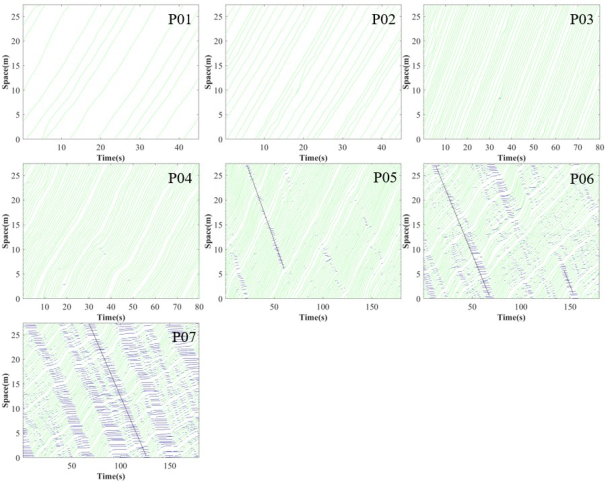
Based on the trajectories in Fig. 3, the space-time diagram of different wor- king conditions can be easily given. It is assumed that the pedestrians with vi(t) > 0.1 m/s are in the state of motion and those with vi(t) < 0.1m/s are in a stopped state, which are represented by green and blue respectively in Fig. 4. The stop-and-go wave is formed by a continuous sequence of one or more stopping pedestrians. As the number of pedestrians increases, the flow transits from laminar flow to stop-and-go waves. It can be observed that the stop-and-go phenomenon begin to appear when the density is 1.35 ped/m (corresponding to 37 pedestrians), but it’s not significant. In addition, the size and frequency of stop-go waves both increase as the density increases. When ρg = 1.86 ped/m, there was obvious and stable stop-and-go wave. Stop-and- go waves travel in the opposite direction of pedestrian movement, which can be seen from the opposite direction of the green and blue lines. By calculating the absolute value of the slope of the black line, the traveling velocity of a
Figure 4: Time–space diagram of different runs.
stop-and-go wave can be obtained. Therefore, the stop-and-go wave propa- gation velocities under the three high densities are approximately 0.56 m/s for ρg = 1.35 ped/m, while it is 0.48 m/s for both runs of ρg = 1.68 ped/m and ρg = 1.86 ped/m respectively. At high densities, the stop-and-go wave travels slower.
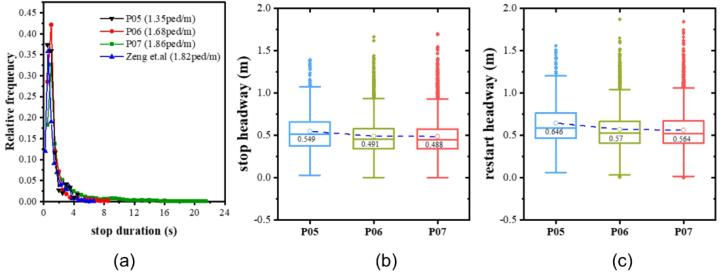
To quantitatively analyse pedestrian stop-and-go behavior, the duration of the stop state of pedestrians is calculated. Refer to the method in Zeng et al. (2019), only the stop duration greater than 0.24 s is considered to eliminate the effect of noise. As can be seen in Fig. 5(a), the higher the density, the higher the frequency of long stop time. Compared with mixed participants under condition of no rhythm (Zeng et al., 2019), the male in our study have longer stop duration, up to 21.5 s. Furthermore, the headways when pedestrians stop and when pedestrians restart after stopping for a while are calculated respectively, which are shown in Fig. 5(b)-(c). With the increase of the density, the stop headway and restart headway both decrease sligh- tly. Under high density, it is more difficult for pedestrians to change their motion state, so pedestrians reduce the stopping distance to prevent frequent stopping behavior. Moreover, pedestrians affected by rear pedestrian pressure will reduce the restart distance headway to follow predecessors as density increases (Ren et al., 2019).
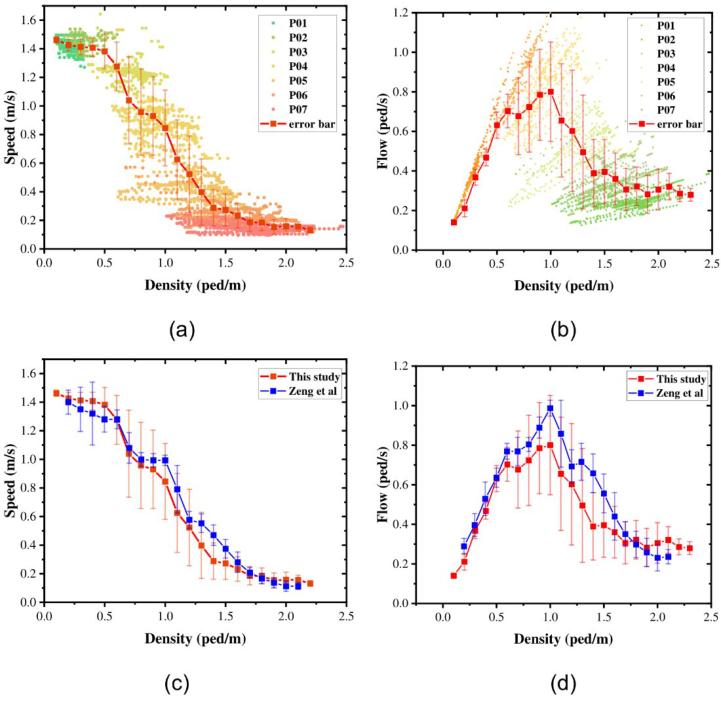
Fundamental Diagram In this section, we focus on fundamental diagrams which can reflect the rela- tionship between velocity, flow and density. The local measurement method is adopted, and the fundamental diagrams are shown in Fig. 6 with error bars
Single-File Movement Experiments of Male Under the Influence of Rhythm 325
Figure 5: (a) The duration distribution of the stopped state; (b) stop headway and (c) restart headway of different runs.Figure 6: Scatter diagram of (a) velocity–density relation and (b) flow–density relation; (c) error bar diagram of comparison with previous studies about (c) velocity–density relation and (d) flow–density relation.
calculated at 0.1 ped/m interval. As can be seen in Fig. 6(a), when the density is less than 0.5 ped/m, the velocity is little affected by the density and can be regarded as the free stage with a desired velocity about 1.42 m/s. In the
constrained stage (ρg > 0.5 ped/m), the velocity decreases sharply first and then slowly as the density increases. Fig. 6(b) shows the relationship betw- een flow and density. Three stages can be found from the figure. When ρg < 1 ped/m, the flow rate increases gradually with the increase of density and reaches the maximum about 0.8 ped/s when ρg = 1 ped/m. Then it gradu- ally decreases as the density increases. When the density is greater than 1.7 ped/m, the flow rate tends to be stable. Fig. 6(c) and (d) compares the diffe- rences between this study and mixed single-file flow under condition of no rhythm in Zeng et al. (2019). In terms of speed-density relation, the speed of this study is larger at low density and smaller at medium density. As for flow, the two flow rates are similar at low density. In the range of 0.6 ped/m-1.7 ped/m, the flow rate of Zeng et al. (2019) is significantly higher than that in this study. Besides, the densities corresponding to the maximum flow are both 1 ped/m, but the maximum flow of Zeng et al. is 1ped/s, while it is 0.8 ped/s in this study.
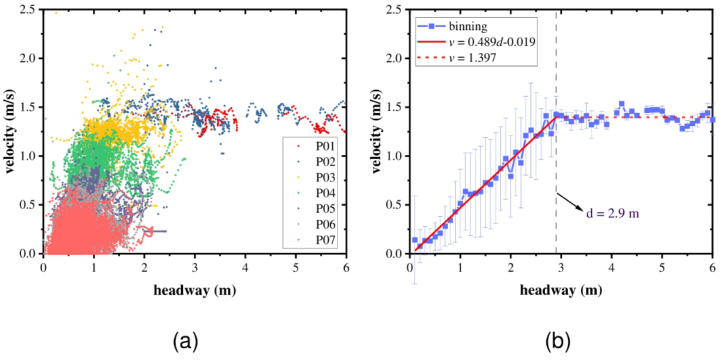
Headway-Velocity Relation Fig. 7(a) shows the relationship between headway distance and velocity of individuals based on Eq. (5)-(6), and the fitting value is given in Fig. 7(b). Two phases (free stage and restricted stage) can be found in the diagram. When the headway distance of pedestrians is small, pedestrians have to adjust their speed to prevent collisions with others due to the limitation of movement space. When the distance headway increases to a certain value, pedestrians can walk at free speed and are no longer affected by other pedestrians. In the restricted phase, the relationship between speed and headway is consistent with v = 0.489d-0.019, the boundary headway between the restricted stage and the free stage is about 2.9 m, and the free speed of the pedestrian is about 1.397 m/s, which is similar to the result obtained in the fundamental diagram.
Single-File Movement Experiments of Male Under the Influence of Rhythm 327
CONCLUSION
A series of single-file pedestrian experiments were carried out to explore motion characteristics of male under the influence of rhythm. By changing the number of participants (range from 5 to 51), the space-time diagram, funda- mental diagram and velocity - headway relationship under different densities were obtained. The main conclusions of this study are as follows.
The distribution of speed under different working condition seems a Gaus- sian distribution in different runs except for P07, where a very high peak near zero can be seen caused by the occurrence of stop-and-go waves. As the number of pedestrians increases, the flow transits from laminar flow to stop-and-go waves and the stop-and-go phenomenon begin to appear when the density is 1.35 ped/m. The stop-and-go waves propagate approximately 0.56 m/s for ρg = 1.35 ped/m, while it is 0.48 m/s for both runs of ρg = 1.68 ped/m and ρg = 1.86 ped/m respectively. As the density increases, the long duration of the stop state of pedestrians becomes more. Also, the stop hea- dway and restart headway both decrease slightly with the increase of the density.
Besides, the fundamental diagrams of male with rhythm are obtained. The boundary density between the free and constrained phases is 0.5 ped/m. When the density is 1 ped/m, the maximum flow rate 0.8 ped/s is reached, a little lower than that of the mixed single-file flow under condition of no rhy- thm. Meanwhile, the relationship between headway and individual velocity is fitted piecewise and two stages including free stage and restricted stage can be found.
This study is helpful to understand the male movement characteristics under the influence of rhythm. However, there are some limitations to the study. (1) The type of rhythm is relatively simple (70BPM). More beats need to be considered, covering different types of rhythm (such as the slow and fast ones). (2) This study focused on the experimental study of male move- ment characteristics under the influence of rhythm, and lacks comparison between different gender groups. In the future, various types of rhythm and the motion characteristics of female affected by the rhythm will be further considered to better understand how rhythm affects different people.
ACKNOWLEDGMENT
The authors thank for the help of the volunteers and staff in this experiment.
REFERENCES
Cao, S., Wang, P., Yao, M. & Song, W. 2019. Dynamic analysis of pedestrian movement in single-file experiment under limited visibility. Communications in Nonlinear Science and Numerical Simulation, 69, 329–342. Jin, C.-J., Jiang, R., Li, R. & Li, D. 2019. Single-file pedestrian flow experi-
ments under high-density conditions. Physica A: Statistical Mechanics and its Applications, 531. Johnson, S. 2017. The influence of rhythmic and spectro-timbral musical features on gait-related movement.
Karbovskii, V., Severiukhina, O., Derevitskii, I., Voloshin, D., Presbitero, A. & LEES, M. 2019. The impact of different obstacles on crowd dynamics. Journal of Computational Science, 36. Leman, M., Moelants, D., Varewyck, M., Styns, F., VAN Noorden, L. & MARTENS,
J. P. 2013. Activating and relaxing music entrains the speed of beat synchronized walking. PLoS One, 8, e67932. Ma, J., Shi, D., Li, T., Li, X., Xu, T. & Lin, P. 2020. Experimental study of single-file pedestrian movement with height constraints. Journal of Statistical Mechanics: Theory and Experiment, 2020. Maculewicz, J., Erkut, C. & Serafin, S. 2016. How can soundscapes affect the
preferred walking pace? Applied Acoustics, 114, 230–239. Ren, X., Zhang, J. & Song, W. 2019. Contrastive study on the single-file pedestrian movement of the elderly and other age groups. Journal of Statistical Mechanics: Theory and Experiment, 2019. Seyfried, A., Steffen, B., Klingsch, W. & Boltes, M. 2005. The fundamental diagram
of pedestrian movement revisited. Journal of Statistical Mechanics: Theory and Experiment, 2005, P10002-P10002. SHI, Z., ZHANG, J., Shang, Z., Fan, M. & Song, W. 2022. The effect of obstacle layouts on regulating luggage-laden pedestrian flow through bottlenecks. Physica A: Statistical Mechanics and its Applications, 608. STYNS, F., VAN Noorden, L., Moelants, D. & Leman, M. 2007. Walking on music.
Hum Mov Sci, 26, 769–85. Yanagisawa, D., Tomoeda, A. & Nishinari, K. 2012. Improvement of pedestrian flow by slow rhythm. Phys Rev E Stat Nonlin Soft Matter Phys, 85, 016111. Zeng, G., Schadschneider, A., Zhang, J., WEI, S., SONG, W. & BA, R. 2019. Experi-
mental study on the effect of background music on pedestrian movement at high density. Physics Letters A, 383, 1011–1018. Zeng, G., Zhang, J., Ye, R., Cao, S. & Song, W. 2022. Pedestrian dynamics of singlefile experiments with music considering different music and different instructions. Physica A: Statistical Mechanics and its Applications, 594. Zhuang, Y., Schadschneider, A., Cheng, H. & Yang, L. 2018. Estimating Escalator
vs Stairs Choice Behavior in the Presence of Entry Railing: A Field Study. KSCE Journal of Civil Engineering, 22, 5203–5214.
LISTED IN THE AHFE DIGITAL BOOKSTORE CATALOGUE
Explore the complete digital volume
Human Factors and Systems Interaction
Read this individual research paper free through the original publisher, or explore the full digital proceedings book.
ISBN 978-1-958651-60-5
Explore this ISBN in the AHFE Bookstore ↗Listed in the July 2026 bookstore catalogue; search by ISBN to confirm current availability · Digital book purchase optional