Yiqi Xiao (2022). Exploring User-Preferred Gestures for Interaction Tasks of Data Visualization on the Large Display. In: Human Factors and Systems Interaction. AHFE Open Access, vol. 52, pp. 380–386. https://doi.org/10.54941/ahfe1002179
Interaction with graphical visualization is an important part of visual analytics. The purpose of this study is to explore how analysts will understand the using of gestures for interacting with data displayed on large screen. For this purpose, this study aims at investigating user-preferred interactions for the tasks of data visualization. To elicit gestures for 20 visualization tasks which cover all categories of interaction for visual analysis, the researcher designed a quick-response experiment based on the Wizard-of-Oz (WoZ) method. Finally, the gestures with high frequency were selected. Findings show the distance between user and the display has an impact on the elicited gestures for specific tasks. The consensus on users’ gesture proposals is also discussed. The conclusion of this research has some implications for natural interaction design for visualization.
Static data visualizations represent the characteristics of data as easy-to- understand visual encodings using the mapping of data to visual elements. With the development of new technologies, the interactions with graphic visualization for visual analysis have garnered much attention. The intera- ctivity of visual encodings helps analysts explore the visualization or fixate on specific data graph, as well as com-pare different data. so as to more effe- ctively gain insights into the data or uncover unknown facts from the analysis. In order to improve the efficiency of data analysis, natural interaction in line with users’ cognitive habits plays a critical role in the communication between the system and users.
The design of natural visualization interaction faces two challenges. The first is the granularity of a task of visual analysis, which is characterized by the inconsistency between the purpose of an analysis to and execution of the interactions. In fact, the purpose of a visual analysis can be achieved only when it is implemented by following several steps, such as filtering, aligning or highlighting, and each contains some specific interactions. Therefore, desi- gners should accurately define the tasks for these interactions in support of the motivations of visual analysis. Second, visual analysis involves external factors such as environment, equipment and users. The interaction design of
Exploring User-Preferred Gestures for Interaction Tasks of Data Visualization 381
visualization depends on the number of analysts participating in the analysis and the work environment. In this study, the problem we address is: how to design more acceptable interactions for the analysis of visual data on the large display for individual analyst.
In addition to the large display, the interface for interacting with multi- dimensional and complex data incorporates portable devices as the second screen, such as smartphones, tablets, smartwatches (Horak et al., 2018), which are utilized as the remote control of large display or distributed user interfaces. There are diverse methods of directly interacting with the large display, many differing in the input field and sensing technology. Existing input methods include: pointer, wireless 3D Gyro mouse, head tracking inte- raction, in-air gestures and multi-modal interaction combining multi-touch and gestures (Cho and Park, 2017). In visualization interaction, the second screen is normally used as the object to which a command is issued, or in some cases as the window for showing values of a data graph (Wo´zniak et al., 2014). It enables the users to change the visualization on the large display through manipulating visual contents shown on this smaller screen, or leve- raging the spatial motions (Kister et al., 2017) or even physical interfaces of the auxiliary device(s).
Visualization interactions designed by experts, as reported above, have seen considerable developments, and many of them have been well prototy- ped. However, it is still unclear what preferences of this interaction end-users will have for completing particular tasks for data analysis. In this paper, we adopt the user elicitation paradigm to investigate user preferences and the factors influencing users’ proposals of interaction design. The follow- ing section mainly introduces the research design, including the approach to selecting interaction tasks and some related working methods. On this basis, the characteristics of user preferences for visual data exploration are further discussed, thereby deepening the understanding of visualization interaction from the perspective of analysts.
USER ELICITATION PROCESS Defining the Tasks
The typology of abstract visualization tasks proposed by Brehmer and Munz- ner (2013) provided a comprehensive picture of possible user intentions for graph visualization mentioned in related studies. It described a taxonomy fra- mework that summarized all such intentions from two dimensions: why (the motivation or goal of an abstract visualization task) and how (interaction events for performing visual analysis). Combined with the classification of visualization tasks presented by Yi et al. (2007), the researcher in this study attempted to build an intention-to-task continuum consisting of an intera- ction task and the intention of visual analysis for which this task is performed. Using affinity graphs and the card sorting method, the tasks with similar defi- nitions and purposes were merged, thus a set of interaction tasks described as 20 referents was obtained. This set allows the generalization of a large num- ber of similar referents with a limited vocabulary. The referents are listed in Table 1 with detailed descriptions.
382 Xiao
Table 1. Visualization interaction tasks.
Table available in the original PDF paper.
Task Description Select an item The selected visual element or area is highlighted. Select all The selected visual elements or areas are highlighted. See more details Show the value or attributes of a focused data graph. Hide Make the selected object invisible. Change the color of a graph The color of a graph is changed. Adjust the shape of a graph Modify the shape of a graph into another one. Set font size Adjust the font size of a selected text. Modify histogram data Reassign a value to a histogram. Filter A part of the data is filtered out and displayed sepa- rately. Split the data set Different categories of data are separated and displa- yed on the screen for comparison. Connect Create a line to link two data items. Annotate A pop-up window with the annotation of a data item. Move to another position Move a graph to a particular position or area. Sorting Sequence data items according to a specific condition. Insert data items A new data is inserted into a particular position or area. Delete data items Delete one or more selected data. Undo Return to the previous step of interaction. Redo Redo a cancelled interaction. Zoom-in The selected item or focused area is enlarged. Explore the page Pan the current page to explore more content.
Participants and Apparatus Thirty participants aged between 18 and 35 (17 males and 13 females) volun- teered to take part in the experiment. All participants have experienced interactive visualization, and also have knowledge about cross-device inte- raction. About one third of the participants have experiences of using mobile apps for managing other devices. To define the interaction scenario, this experiment simulated the situation of manipulating visualized data shown on a large display with the assistance of mobile device. The visualization of multi-dimensional heterogeneous data was deliberately de-signed. The mea- surements of the experimental site are approximately 860 cm by 620 cm. In this room, there was a display screen about 185 cm long and 105 cm high. Participants were asked to hold a smartphone (Size: 150.9 mm long and 75.7 mm wide, Resolution: 1792×828 pixels) to demonstrate preferred visualiza- tion interactions. The two devices are both available input fields. A camera was deployed to record the trajectory and spatial posture of gestures.
Experimental Procedure Following the Wizard-of-Oz method, participants were instructed to propose the most preferred interaction design required to trigger the visual feedback, which was actually produced by the experimenter. One particular feature of cross-device visualization interaction is that there should be a corresponding interaction effect for each screen. For example, an analyst executes a gesture
Exploring User-Preferred Gestures for Interaction Tasks of Data Visualization 383
on the screen of mobile device to adjust the visual encodings of specific data, the adjustment will be displayed on the main screen in response to the gesture execution. In consideration of this, only the changes of visual encodings on the large display were provided to participants. Therefore, a user-preferred interaction proposal includes the interaction behavior (i.e. input) and the output of the secondary device.
Before the experiment, the participants were given a script of data nar- rative. Participants should stand 300cm away from the large display. When there is a need to change the data with interaction on the large display for storytelling, the participants will receive an instruction about the task, encou- raging them to improvise a gesture without interrupting the speech. This process lasted about 20 minutes. Once the task word was presented, par- ticipants should perform the interactive gesture within 10 seconds. After the elicitation, the experimenter showed video recordings of the elicited gestures to participants, asking them to verbally describe the interaction process while drawing the visual feedback shown on the screen of smartphone. During this time, participants had the opportunity to correct their proposals. Each proposal was comprised of a gesture and its corresponding feedback.
According to the experimental setting, interactions with the large display happened in three levels of proximity (level 1: 300 cm; level 2: 200 cm; level 3: 100cm) to that display. When standing at a distance of 100 cm, partici- pants can stretch arms to get close to the display. For each level of proximity, participants had to complete all 20 tasks, which is called one block. The order of three blocks was level 1, level 2 and level 3. For the tasks in level 2 and 3, participants only needed to answer whether their preferred interactions were consistent with those in level 1 or not, and accordingly give a new proposal for a different preference.
RESULTS
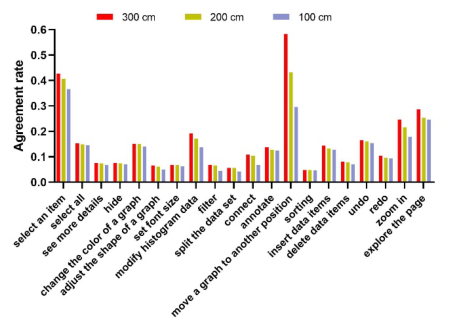
User-Preferred Interactions A total of 234 proposals for the 20 tasks were collected in the user elicitation experiment. In Figure 1, the agreement rate (AR) of each task performed at different levels of proximity to the large display is reported. This is the measurement most commonly used in elicitation studies [10] to indicate the disagreement of user-defined gestures for the same task. The tasks with higher AR are: select an item, change the color of a graph, connect, annotate, move to another position, insert data items, undo and explore the page. On the whole, the ARs of most tasks are lower than those of tasks in previous studies on the user gestures for single commands (such as next page, volume up).
For each task, the interaction most frequently proposed by users was con- sidered to be the user preference. Such interactions and their occurrence frequency are listed as follows. single click (19) for select an item, click multi- ple options (10) for select all, double-click (6) for see more details, long press (7) for hide, the window of options pops up by a long press (9) for change the color of a graph, long press and drag (7) for adjust the shape of a graph, click on the text with two fingers (5) for set font size, click and drag upward (6) for modify histogram data, press the blank space to activate the filter bar
384 Xiao
Figure 1: Agreement rates of elicited gestures (6) for filter, a long press on the graph opens the Options window and then type the keyword (5) for split the data set, click two items successively (11) for connect, press the text and swipe rightward (10) for annotate, press the item and drag (23) for move to another position, a long press on the graph opens the Options window and then select the option (6) for sorting, a long press on the blank space of screen (11) for insert data items, long press and swipe (5) for delete data items, swipe rightward (11) for undo, swipe leftward (8) for redo, click and pinch to zoom (15) for zoom in, pan gesture (15) for explore the page. All these interactions are made only with the phone. With regard to the visual content on the screen of smartphone, the user-preferred interactions for all tasks are showing a miniature version of the focused area of visualization displayed on the large screen.
The Effect of Proximity When participants stood at a distance of 200 cm from the large display, 10.7 percent of the proposals were different from those elicited when the distance between participant and display is 300 cm. When they stood 100 cm away from the large display, this proportion increased to 32 percent. In this case, users can stretch out their upper limbs to get close to the large display, or even tilt their body and touch the screen of large display with their fingertips. Therefore, more proposals that were different from those simply interacting with the smartphone were recorded.
When standing in close proximity to the display, participants were more likely to suggest cross-device interactions. Among all the proposals that par- ticipants created for a closer proximity to the large display, 25.2 percent were cross-device interactions. When participants stood at a distance of 300cm from the large display, the proportion of cross-device interaction was 5.1 percent. In the block 2 and 3 of this experiment, the proportion of cross- device interaction increased to 12 percent and 38.5 percent respectively. Users can directly engage in the manipulation of data items or visual graphs on the large display through these interactions such as in-air gestures or the movements of the handheld device. An example of cross-device interaction is clicking the data on smartphone and then making a finger splay in front of
Exploring User-Preferred Gestures for Interaction Tasks of Data Visualization 385
the large display to represent the task zoom-in. After collecting all the propo- sals of the three blocks, the most frequently elicited gestural interaction was derived. It was found that the user-preferred interaction for split the data set and sorting should be “press on a specific button of the phone interface opens the Options window”. In doing so, a final gesture set for all the visualization tasks was obtained.
According to the gesture taxonomy presented by Pavlovic, Sharma and Huang (2006), interactive gestures can be classified into two main categories: communicative gesture and manipulative gesture (Pavlovic et al., 1997). As the proximity to large display gets closer, the proportion of communicative gestures (300 cm: 2%; 200 cm: 6.8%; 100 cm: 10.2%) slightly increased, followed by the relative decrease of manipulative gestures (300 cm: 98%; 200 cm: 93.2%; 100 cm: 89.8%). Among the gestures per-formed in block 1, 76.8 percent are finger movements, 15.4 percent requires wrist movements, and 7.8 percent requires upper arm movements. In block 2 and 3, the pro- portion of interactions which require the movement of the whole upper arm in-creased to 14.9 percent and 27.3 percent respectively.
Differences of Tasks In this section, the effect of proximity on the user-preferred gestures for each visualization task is examined. The experimental results show that the tasks on which proximity has a greater impact are: adjust the shape of a graph, modify histogram data, filter, split the data set, connect, move to another position and zoom-in. When standing closer to the large display, participants tended to propose an interaction that is more adaptive to the current spatial relationship between the analyst and the user interface for these tasks. In block 2 and 3, for any one of these tasks, the percentage of participants who advocated replacing previous proposals in block 1 with the new interactions reached 30 percent, which was much higher than the aver-age value for the other tasks.
According to Table 1, the user-preferred gestures for two tasks of the encode cate-gory, two of the filter category and two of the reconfigure cate- gory varied more with the different proximity of user to the large display. The next section will discuss the reasons for this finding and some other implica- tions of experimental results for the interaction design of visualization.
DESIGN IMPLICATIONS For interaction design of visualization, there exists a need to balance the amount of multi-dimensional and multivariate data encoded by visual ele- ments and the effectiveness of data analysis, visual narrative and sense- making. A display with larger size would be required for the complexity of data. In order to avoid the interactions on the large display with much physical effort, researchers try to explore the avenue that makes use of secon- dary devices to indirectly manage the visualization system and control the relevant visual elements. In this manner of interaction, the more acceptable interaction designs to end-users usually borrow some gestural inputs based
386 Xiao
on the widely applied multi-touch technologies. Users prefer that the secon- dary device can present a simplified version of the data item currently to interact with. This presentation acts as an interface for performing specific tasks. As the secondary devices can play the role of providing an available input field to analysts, the intention of interaction with visualization system can be fulfilled, regardless of the distance between user and the display.
As an influencing variable, users’ preferred interaction for a specific task depends on the distance between user and the large display to a certain extent. When users were allowed to interact with the display in a closer proximity, as observed in the experiment, the diversity of users’ proposals significantly improved. On this account, when we select and refine the user gestures, it is recommended to provide the analyst with interaction methods of directly manipulating the visualization on large display as alternatives. These methods should share the same gestural vocabulary and semantic mapping of intera- ctive behavior to the task with those completely implemented on secondary devices.
In terms of visualization task, the user-preferred interaction for some tasks is composed of atonic gestures. For example, a task categorized as filter has two steps: specifying the filter criteria and typing the keywords. As a result, the multi-step of interaction leads to variations of user-elicited gesture. For some visualization tasks, there are no widely-accepted legacy bias that users can retrieve to produce interactive gestures. With these concerns, more atten- tion needs to be put into the exploration of the agreement of multi-step interaction for visual analysis in the future.
REFERENCES
Brehmer, M. Munzner, T. (2013) A multi-level typology of abstract visualization tasks. IEEE Transactions on Visualization and Computer Graphics, 19(12), pp. 2376–2385. Cho, Y. and Park, K. S. (2017) Navigating high-resolution image visualization on
a large dis-play using multimodal interaction. International Journal of Applied Engineering Re-search, 12 (20), pp. 9627–9635. Horak, T. Badam, S. K. Elmqvist, N. et al. (2018) When David meets Goliath: Combining smartwatches with a large vertical display for visual data exploration. In: Proceedings of CHI’18, April 21–26, 2018, Montreal, QC, Canada, 19, pp. 1–13. Kister, U. Klamka, K. Tominski, C. et al. (2014) GraSp: Combining spatially-
aware mobile devices and a display wall for graph visualization and interaction. Computer Graphics Forum 36, 3, pp. 503–514. Pavlovic, V. Sharma, R. Huang, T. S. (1997) Visual interpretation of hand gestures for human-computer interaction: A review. IEEE Transactions on Pattern Analysis and Ma-chine Intelligence, 19(7), pp. 677–695. Wo´zniak, P. Lischke, L. Schimidt, B. et al. (2014) Thaddeus: a dual device interaction
space for exploring information visualization. In: Proceedings of the 8th Nordic Conference on Human-Computer Interaction: Fun, Fast, Foundational, October 2014, pp. 41–50. Yi, J. S. Kang, Y. A. Stasko, J. T. et al. (2007) Toward a deeper understanding of the role of interaction in information visualization. IEEE Transactions on Visualization and Computer Graphics, 13(6), pp. 1224–1231.
LISTED IN THE AHFE DIGITAL BOOKSTORE CATALOGUE
Explore the complete digital volume
Human Factors and Systems Interaction
Read this individual research paper free through the original publisher, or explore the full digital proceedings book.
ISBN 978-1-958651-28-5
Explore this ISBN in the AHFE Bookstore ↗Listed in the July 2026 bookstore catalogue; search by ISBN to confirm current availability · Digital book purchase optional