Sergey Lytaev (2022). Rationale and Application of Express Algorithms for Mental Health Assessment in Professional Selection and Screening Examinations. In: Neuroergonomics and Cognitive Engineering. AHFE Open Access, vol. 42, pp. 42–49. https://doi.org/10.54941/ahfe1001817
The aim of this study was the physiological substantiation of express algo-rithms for assessing cognitive functions according to the data of clinical, psy-chological and neurophysiological studies in conditions of time deficit. The in-tegrative indicator SCL-90-R - "general index of severity" has a high statistical significance (p <0.05) in both healthy subjects and neuropsychiatric patients. The effectiveness of the "Mini-Mult" method in conditions of time deficit is de-termined by the results of the scales of hypochondria, depression, hysteria, par-anoia, psychasthenia, schizoid and hypomania (p <0.05). We also used a block of logical techniques. A similar survey for 15 - 25 min can be used as a stand-ard for assessing neurocognitive status in screening studies of large groups. EEG power indices and spectra in theta, delta and alpha frequency ranges are an effective reflection of mental status.
The physiological consequences of psychological stress, as a form of intera- ction between a person and the environment, depend on a person’s perception of their ability to cope with a stressor. Human perception of stress includes the activation of three interconnected biological systems (R-Suradijono, 2017). First, stress is perceived by sensory systems that assess and compare the stres- sful situation with the current state and previous stressful experience of the body. Second, the brain activates the autonomic nervous system through the sympathetic-adreno-medullary system and triggers the rapid release of cate- cholamines, norepinephrine and adrenaline. Third, there is a simultaneous activation of the hypothalamus-pituitary-adrenal system, which leads to the release of adrenal glucocorticoids and cortisol in humans (Ushakov et al., 2014; Bogomolov, 2021; Lytaev, 2021a). Stressors can be divided into the following six types: 1) crises / catastro- phes (for example, environmental disaster, terrorist attack), 2) important life events / acute stressors (for example, a broken leg, death in the family), 3) daily troubles / micro-stressors (eg, flat tire), 4) chronic stressors (eg,
Rationale and Application of Express Algorithms for Mental Health Assessment 43
ongoing financial stress, ongoing toxic work environment, family problems, divorce, academic pressure, leaving), 5) external stressors (eg air conditio- ning noise) and 6) organizational stressors (eg toxic leadership) (Jacob et al., 2017). The curve of human functions shows how increased stress arousal – from eustress to distress – affects performance (Jacob et al., 2017; Pascalis et al., 2017; Masakowski, 2020). When the level of stress during arousal reaches a certain point (fatigue), performance decreases dramatically. It is important to note that the point of fatigue can differ from person to person. As the arou- sal builds up, no one notices that performance begins to decline and certain symptoms appear, such as exhaustion, health problems (such as headaches and migraines) and, finally, a complete breakdown. Therefore, any definition of stress should include eustress (good stress) as well as distress (bad stress) (Lytaev, 2015, 2021a).
Comparing the information obtained from direct and indirect measures to estimate fluctuations in working capacity represents the greatest methodo- logical challenge (Dietrich et al., 2010; Corr et al., 2012; Ren et al., 2019; Lytaev, 2021b). A person who performs the work perfectly according to the direct indices output might display appreciable fluctuations in the indirect indices. The cost of such behavioral reactions is excessively high and the pattern of information obtained from the measurements may misleadingly suggest a high level of working capacity (Modi et al., 2012; Lytaev et al., 2021). Taking into account the listed activation factors under stress, the purpose of this study was the physiological substantiation of express algorithms for assessing cognitive functions according to the data of clinical-psychological and neurophysiological studies in conditions of time deficit.
METHODS
For the assessment of cognitive functions, two methodological approa- ches were applied. The first of them was a complex of psychological testing; the second – EEG with subsequent computer processing of the results. The full range of examination took up to 40 min with the sub- sequent reduction to 15–25 min. The complex of psychological testing included 6 tests – the questionnaire of the severity of psychopathologi- cal symptoms SCL-90-R, the method of clinical and psychological research of the personality structure “Mini-Mult”, as well as a block of logical methods: “Isolation of essential features”, “Exclusion of unnecessary”, “Sim- ple analogies” and “Understanding the figurative meaning of proverbs and metaphors”.
Using the described methodological techniques a study for three groups of subjects was performed. Study group I consisted of 102 healthy volunteers (18–35 years old) who underwent psychological testing. For neurophysiolo- gical research, study group II was formed, which consisted of 102 healthy subjects (18–60 years old) who underwent a planned psychiatric examina- tion. To compare the data of healthy subjects, group III was formed, which consisted of 20 outpatients of a neuropsychiatric clinic.
44 Lytaev
Table 1. Test results according to the “Mini-Mult” method.
Table available in the original PDF paper.
Scales Mean ± error of the mean Study group I Study group III
OUTCOMES When analyzing the results of clinical and psychological testing of SCL-90-R, scales and indicators were revealed that statistically significantly differed in subjects in the study groups I (conditionally healthy) and III (outpatients). These are the second-order scales SCL-90-R – the general index of severity (mean value in group I – 0.73 ± 0.04; in group III – 1.08 ± 0.12) and the total number of affirmative answers (mean value in group I – 1.46 ± 0.03; in group III – 1.9 ± 0.17).
Statistically reliable results for most scales of the “Mini-Mult” method were obtained (see Table 1).
High results (the level of statistical significance p <0.01 according to the Mann-Whitney and Wold-Walfowitz criteria) were obtained when analyzing the test data using the methods “Excluding unnecessary”, “Simple analo- gies”, “Isolation of essential features”, “Interpretation figurative meaning of proverbs and metaphors”.
Test results “Excluding unnecessary” in the study group III – 5 points in 4 people, 3 or less points in 5 (average value 4.97 ± 0.02); in the study group I – the prevailing mark is 5 points (mean value 3.8 ± 0.02).
According to the “Simple analogies” method in the study group III, the highest score of 23 points is absent, 11 patients scored less than 20 points (mean value 20.7 ± 1.8), in the study group I 23 points prevail (mean value 22.7 ± 0, 06). Testing “Isolation of essential features” showed the following results. Study group III: more than 15 points 4 people, 13 and less than 7 people (mean value 13.55 ± 0.3); in the study group I – scores of 15-16 points prevail (mean value 15.87 ± 0.04).
According to the methodology “Understanding the figurative meaning of proverbs and metaphors”, the following data were obtained: in the study group III – 9 patients scored 7 or less points (mean value 7.55 ± 0.3), in the study group I – the score in 9 points (average value 8.99 ± 0.01).
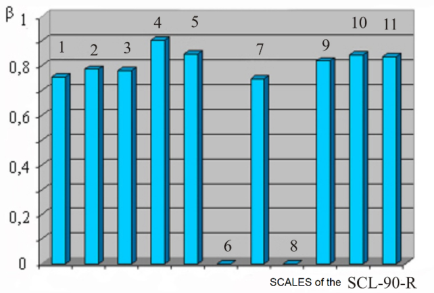
For the results of psychological testing, a multivariate regression analysis was carried out, which made it possible to clarify the picture of the relation- ship between the studied methods and scales. It was found that the integrative indicator “general index of severity” of the SCL-90-R test shows a stable
Rationale and Application of Express Algorithms for Mental Health Assessment 45
Figure 1: Standard regression coefficients for the SCL-90-R “General Severity Index Scale”. Notes: The ordinate is the standard regression coefficients (ß). On the abscissa axis of the scale 1 – somatization, 2 – obsessiveness-compulsiveness, 3 – interpersonal anxiety, 4 – depression, 5 – anxiety, 6 – hostility, 7 – phobias, 8 – paranoia, 9 – psychoti- cism, 10 – the total number of affirmative answers, 11 – index of present symptomatic distress.
correlation with all thematic scales of this technique. Figure 1 shows a graph of standard regression coefficients (ß) in relation to the dependent feature “general index of severity”.
It can be assumed that the integrating role of this indicator in the aggre- gate analysis of all thematic scales is quite high. The combination of this conclusion with the statistical reliability of the indicator proved above makes it sufficiently representative for judging within the framework of “norm” or “pathology” in conditions of lack of time. A similar correlation betw- een the symptom severity index has been described in a number of other studies.
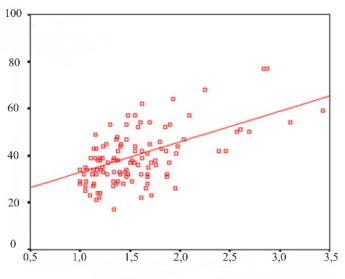
It has been shown that many scales of the “Mini-Mult” method have a regression dependence on the second-order scale “Index of present sym- ptomatic distress” SCL-90-R, for example, the scale of psychopathy (see Figure 2). The correlation between different scales has been proved, not only within the framework of the same methods, but also between indi- vidual indicators of all the tests we used. In particular, the results of the scale of hypochondria “Mini-Mult” correlate with the indicators on the scale of somatization SCL-90-R. The results of the scale of psychasthenia “Mini-Mult” correlate with indicators on the scale of interpersonal anxiety SCL-90-R.
A scatter diagram with regression lines showing a linear regression relati- onship for the test results using the “Simple analogies” and “Interpretation of the figurative meaning of proverbs and metaphors” (standard regression coefficient is 0.355).
EEG registration and processing. In a neurophysiological study, resting EEG was recorded for a minute in 8 bipolar leads: Fp1 - C3, Fp2 - C4, C3 - O1, C4 - O2, O1 - T3, O2 - T4, T3 - Fp1, T4 - Fp2. Subsequent computer processing of the signal was carried out using the WinEEG software package
46 Lytaev
Figure 2: Scatter plot. The ordinate is the psychopathy scale (points); the abscissa is the SCL-90-R symptomatic distress index (points).Table 2. EEG power spectra in delta and theta ranges.
Table available in the original PDF paper.
Sites, 10/20 Delta Theta Group II Group III Group II Group III
by calculating the EEG power indices and spectra in 5 frequency ranges (theta, delta, alpha, beta1, beta2).
Attention is drawn to the significant difference in the average results in the theta range, for example, for the C4 - O2 derivation, the average values in the study group II are 6.31 ± 0.4, in the study group III - 17.63 ± 2.9, for the delta range in that In the same assignment, the mean values in the study group II - 6.60 ± 0.5, in the study group III - 11.95 ± 2.1 (see Table 2).
DISCUSSION
The results of this research indicate that the indices and power spectra at the same registration points for the same EEG range, as a rule, are related. In percentage terms (so that the sum of 100% is obtained by adding up the indicators in all ranges), the indices and power spectra reflect the “degree of presence” in the total oscillations of waves of a particular range. Most of the recorded EEG parameters are characterized by a relationship between the indicators in the “adjacent leads”, since in a bipolar study the recorded curve reflects the algebraic sum of fluctuations in the electric potential under two electrodes. Thus, one of the two components of the algebraic sum for
Rationale and Application of Express Algorithms for Mental Health Assessment 47
each of the pair of “adjacent leads” turns out to be common. In addition, in some cases (this is shown for the delta, beta-1 and beta-2 ranges) there is a regression relationship between “paired electrodes” for identical leads in different hemispheres. We can assume that the delta and beta components of the oscillations are symmetric in the left and right hemisphere.
Among the psychological characteristics of express testing in conditions of shortage of time, the integrative indicator SCL-90-R is important – the general index of severity, as well as the scales of hypochondria, depression, hysteria, paranoia, psychasthenia, schizoid and hypomania of the Mini-Mult test.
The “psychological situation”perceived by the individual is considered cri- tical for determining the level of stress. On this basis, “cognitive assessment”, including primary and secondary assessment, is important for an individual under time pressure. At the initial assessment, a person forms a judgment about the meaning of an event as stressful, positive, controlled, provocative or inappropriate, followed by an assessment of his resources and possibilities of survival. Secondary assessment is a process of recalling a potential response to a threat and overcoming it as a process of performing this response (Wagner et al., 2004; Jacob et al., 2017; Lytaev, 2021a).
These approaches may be used to develop new efficient systems for the automatic classification of EEG (Khil’ko et al., 1993; Shostak et al., 1995). For example, developing a technology to distinguish normal from patholo- gical EEG as well as to classify different types of pathology and different types of human functional states triggered by stressors and sensory stimu- lations is possible. Data from a 30–sec EEG assessment paired with a small amount of other data can be sent easily to remote computers for quick analy- ses and results. This may be critically important when the timely receipt of such results is important (Qiu et al., 2008; Lytaev et al., 2017, 2019).
CONCLUSION
Integrative index SCL-90-R - the general index of severity of symptoms has a high statistical significance (p <0.05). In the group of healthy subjects the ave- rage value of the indicator was 0.73 ± 0.04, in the group of neuropsychiatric patients the average value was 1.08 ± 0.12.
The effectiveness of using the “Mini-Mult” method in conditions of time shortage is determined by the results on the scales of hypochondria, depres- sion, hysteria, paranoia, psychasthenia, schizoid and hypomania, where the differences in the studied groups have a reliability of p <0.05. High values (> 70) in any of the “Mini-Mult” scales require more in-depth examination. Such a survey, which takes 15–25 min, can be used as a standard for assessing neuro-cognitive status in screening studies of large groups.
Indices and spectra of EEG power in theta, delta and alpha frequency ran- ges are an effective reflection of mental status. EEG power indices and spectra consistently correlate with each other in bipolar derivations in all freque- ncy ranges, with regression coefficients for the correlation dependence in the range of 0.6–0.8. Data on indices and power spectra in the theta range are highly reliable (p <0.01) in assessing neurophysiological status.
48 Lytaev
REFERENCES
Bogomolov, A. (2021) Information Technologies of Digital Adaptive Medicine, Informatics And Automation Volume 20. Corr, P.J., McNaughton, N. (2012) Neuroscience and approach/avoidance persona-
lity traits: a two stage (valuation–motivation) approach, Neurosci. Biobahav. Rev. Volume 36. Dietrich, A., Kanso, R. (2010) A review of EEG, ERP, and neuroimaging studies of creativity and insight, Psychol. Bull. Volume 136. Jacob, C., Lagacé-Roy, D. (2017) “Military Stress and Resilience: Introduction to the
2017 International Military Testing Association Inaugural Volume”, in: Global Views on Military Stress and Resilience. Kingston, Ontario: Canadian Defence Academy Press, pp. 1–16. Khil’ko, V.A., Shostak, V.I., Khlunovski˘ı, A.N., et al. (1993) Topograficheskoe kar Tirovanie vyzvanno˘ı bioélektrichesko˘ı aktivnosti i drugie metody funktsional’no˘ı Ne˘ırovi zualizatsii mozga [The topographic mapping of evoked bioelectrical acti- vity and other methods for the functional neural visualization of the brain], Vestn Ross Akad Med Nauk Volume 3. Lytaev S. (2021) Modern neurophysiological research of the human brain in cli-
nic and psychophysiology, Bioengineering and Biomedical Signal and Image Processing. Lecture Notes In Computer Science Volume 12940. Lytaev, S. (2021) Modeling and estimation of physiological, psychological and sensory indicators for working capacity, Advances In Intelligent Systems And Computing Volume 1201. Lytaev, S., Aleksandrov, M., Popovich, T., Lytaev, M. (2019) Auditory evoked poten-
tials and PET-scan: early and late mechanisms of selective attention, Advances In Intelligent Systems And Computing Volume 775. Lytaev, S., Aleksandrov, M., Ulitin, A. (2017) Psychophysiological and intraoperative AEPs and SEPs monitoring for perception, attention and cognition, Commun. Comput. Inf. Sci. Volume 713. Lytaev, S., Vatamaniuk, I. (2021) Physiological and medico-social research trends of
the wave P300 and more late components of visual event-related potentials, Brain Sciences Volume 11 No 125. Lytaev, S.A., Belskaya, K.A. (2015) Integration and disintegration of auditory images perception, Lecture Notes In Computer Science Volume 9183. Masakowski Y.R. (2020) “Artificial Intelligence and Global Security: Future Trends,
Threats and Considerations”. Bingley, UK: Emerald Publishing Ltd. Modi, S., Bhattacharya, M., Khushu, S. (2012) “Neuroimaging in cognitive assess ment of armed forces personnel”, In: Psychometric Testing in Armed Forces: Issues and Challenges, Kaur, G., Awasthy, S., Mandal, M.K. (Eds.), New Delhi: Pentagon Press, pp. 168–192. Pascalis, V., Fracasso, F., Corr, P.J. (2017) Personality and augmenting/reducing (A/R)
in auditory event-related potentials (ERPs) during emotional visual stimulation, SCI REP Volume 7. Qiu, J., Li, H., Yang, D., Luo, Y., Li, Y., Wu, Z., Zhang, Q. (2008) The neural basis of insight problem solving: An event-related potential study, Brain Cogn. Volume 68. Ren, P., Ma, X., Lai, W., et al. (2019) Comparison of the use of blink rate and blink
rate variability for mental state recognition. IEEE Trans. Neural Syst. Rehabil. Eng. Volume 27. R-Suradijono, S.H. (2017) “Cognitive perspectives on stress and coping strategies: A military viewpoint”, in: Global views on military stress and resilience. Kingston, Ontario: Canadian Defence Academy Press, pp. 139–150.
Rationale and Application of Express Algorithms for Mental Health Assessment 49
Shostak, V.I., Lytaev, S.A., Golubeva, L.V. (1995) Topography of afferent and efferent flows in the mechanisms of auditory selective attention, Neurosci. Behav. Physiol. Volume 25. Ushakov I.B., Bogomolov A.V. (2014) [Informatization of personalized adaptation
medicine programs], Vestn Ross Akad Med Nauk Volume 5–6. Wagner, U., Gais, S., Haider, H., Verleger, R., Born, J. (2004) Sleep inspires insight, Nature Volume 427.
LISTED IN THE AHFE DIGITAL BOOKSTORE CATALOGUE
Explore the complete digital volume
Neuroergonomics and Cognitive Engineering
Read this individual research paper free through the original publisher, or explore the full digital proceedings book.
ISBN 978-1-958651-18-6
Explore this ISBN in the AHFE Bookstore ↗Listed in the July 2026 bookstore catalogue; search by ISBN to confirm current availability · Digital book purchase optional