Skip to article
AHFE AHFE Discoveries AHFE International Open Access Journal
AHFE OPEN ACCESS OPEN ACCESS CONFERENCE PROCEEDINGS PAPER

An experimental study on the applicability of Fusion display and Overlay display of AR smart city data and information

School of Design, Shanghai Jiao Tong University, 800 Dongchuan Road, Minhang, District, Shanghai 200240, China ↗
Publication year
Digital Object Identifier10.54941/ahfe1001729

Abstract

Background Smart digital twin cities digitally create virtual models of urban systems,It simulates the behavior of physical entities in a realistic environment with the help of data . And through virtual and real interactive feedback, data fusion analysis, decision iterative optimization and other means to design and build smart city platforms, Thus adding or extending new capabilities to smart city management.In conjunction with the trend towards AR glasses, paperless information design,the visual expression of information models, will be an important trend in the future, In demand for AR smart city related information reading, The right visual expression can assist managers in their exploration of the city's data.The key to AR information presentation is the presentation of the information, i.e. the way information is covered. Based on past research findings,There are two most conventional and operational ways to present,Fusion display and Overlay display. However, which one to use as the dominant form of presentation needs to be explored experimentally.Method In order to investigate which is more suitable for smart city data overlay, Fusion display or Overlay display. This experiment used Rhino 3D tools to build a 3D model of the city, The model contains three smart city operation scenarios: building equipment operation status, community power management system, and smart operation of business district,The content of the message is consistent in each scenario,while it is expressed through both Fusion display and Overlay display. Twenty identical questions and answers were set up for each comparison group's information presentation.The experiment will last for five weeks and the number of recruits will be 32, Recruiters are divided into groups A and B, each with sixteen members. The experiment required the subject to be able to read 12pt Arial regular characters without wearing glasses,Group A uses Fusion display, Group B uses Overlay display,Comparison of accuracy of information delivery and fatigue of information reading by subjects after test subjects have completed the same information questionnaire,The applicability of the interface was verified using the NASA- TLX scale. The specific experiments are as follows:(1)Information accuracy test session, this session is for the experimenter to wear the TOBII eye-movement instrument and conduct a 2 question visual expression test to ensure that the experimenter is familiar with the experimental process.(2) Cognitive experiment, the experimenter first read the questions carefully, after clarifying the questions, the experimenter picked up the tablet computer for AR overlay on the images, then the subject looked at the centre of the screen, received the "start" command, clicked on the centre of the screen and started reading to find information and complete the questions, a total of 5 groups of 20 questions, the experimenter recorded the time for each question.(3)Fatigue experiment, in this session, we ask the experimenter to test the fatigue of reading information in two types of visual information presentation: Fusion display and Overlay display,after the experimenter says "start", the experimenter will carry out a 10-minute information reading task of the same type of visual information presentation, read the information in the diagram The test is completed with multiple-choice questions. After reading the same type of visual expression, a five-minute break is taken and another visual expression reading task follows.(4)Interface usability questionnaires, in which the subjects are asked to evaluate the experimental interface according to their own circumstances, fill in an experimental research questionnaire and provide preferences and experimental suggestionsResultAt the end of the experiment, questionnaires, question completion schedules, eye-tracking point charts, thermograms, eye-beat charts and point analysis charts were collected from the AB group, and conclusions were generated through statistical analysis of the experimental data,The results are as follows:1) In terms of correctness data analysis, the Fusion display has a significantly lower correctness rate than the Overlay display2) In terms of completion efficiency, the Fusion display is significantly slower than the Overlay display in recognitionConclusion(1)Under the task-oriented experiment, users in the Fusion display were more focused on text.(2)Users who used the Fusion display f tended to search more in the central area.(3)Users' subjective feedback shows that fusion displays are preferred because they are more technological in nature(4)The range of eye movements of the subjects in the Fusion display is wider, while in the Overlay display, the trajectory of the subjects' eye movements is concentrated on the layer information. (5)The saturated color module has a higher number of user attentions


BACKGROUND

Smart digital twin cities digitally create virtual models of urban systems, it simulates the behavior of physical entities in a realistic environment with the help of data. And through virtual and real interactive feedback, data fusion analysis, decision iterative optimization and other means to design and build smart city platforms, thus adding or extending new capabilities to smart city management. On the new urban information carrier, the pre- sentation of information has a certain impact on the speed and accuracy of information acquisition.

In conjunction with the trend towards AR glasses, paperless information design, i.e. visualization of information models, will be an important trend in the future, in demand for AR smart city related information reading, the right visualization can assist managers in their exploration of the city’s data.

The key to AR information presentation is the presentation of the infor- mation, i.e., the way information is covered. Based on past research findings, there are two most conventional and operational ways to present, one is a

© 2022. Published by AHFE Open Access. All rights reserved. 360

An Experimental Study on the Applicability of Fusion Display and Overlay Display 361

Figure 1: 3D model diagram (left) overlay infographic (middle) embedded infographic (right).
Original PDF Figure 1:
Figure 2: Overlay effect diagram.
Original PDF Figure 2:

fusion display that fuses real environmental scenes with virtual digital infor- mation, and searches for data in the scene (Susumu Nakajima et al. 2001). The other is that the scene information is superimposed on both sides of the picture in the form of information description (Shiaw-Tsyr Uang et al. 2019). The two types of visual effects are shown in Figures 1 and 2. However, which one to use as the mainstream form of display still needs to be experimentally explored.

Therefore, the purpose of this research is to explore the applicability and differences of the fusion description and superimposed description of AR smart city data information for smart city information acquisition. To judge which is more suitable as the mainstream display form. The research object is the eye movement data and information acquisition data in these two information display methods.

MATERIALS AND METHODS

Experimental Material Design In order to investigate which is more suitable for smart city data overlay, Fusion display or Overlay display. This experiment used Rhino 3D modelling tools to build a 3D model of the city, the model contains three smart city operation scenarios: building equipment operation status, community power management system, and smart operation of business district.

The content of the message is consistent in each scenario, while it is expressed through both Fusion display and Overlay display. Twenty identical questions and answers were set up for each comparison group’s information presentation.

Participants The experiment will last for five weeks, and the number of recruits will be 32, Recruiters are divided into groups A and B, each with sixteen members. The experiment required the subject to be able to read 12pt Arial regular

362 Zheng and Dong

characters without wearing glasses, Group A uses Fusion display, Group B uses Overlay display.

Procedures For the AR city digital twin problem, superimposed and integrated visual expressions are designed to objectively test the performance of the subje- cts in visual search and logical thinking tasks and eye movement behaviors, perform statistical analysis on the data, and calculate the key points under different layouts. Data and key point search efficiency and assist in the verification of the questionnaire.

Information accuracy test session, this session is for the experimenter to wear the tobii eye-movement instrument and conduct a 2 question visuali- zation test to ensure that the experimenter is familiar with the experimental process.

1. Cognitive experiment, the experimenter first read the questions carefully, after clarifying the questions, the experimenter picked up the tablet com- puter for AR overlay on the images, then the subject looked at the Centre of the screen, received the “start” command, clicked on the Centre of the screen and started reading to find information and complete the questi- ons, a total of 5 groups of 20 questions, the experimenter recorded the time for each question. 2. Fatigue experiment, in this session, we ask the experimenter to test the fatigue of reading information in two types of visual information presen- tation: Fusion display and Overlay display,after the experimenter says “start”, the experimenter will carry out a 10-minute information rea- ding task of the same type of visual information presentation, read the information in the diagram The test is completed with multiple-choice questions. After reading the same type of visualization, a five-minute break is taken and another visualized reading task follows. 3. Interface usability questionnaires, in which the subjects are asked to eva- luate the experimental interface according to their own circumstances, fill in an experimental research questionnaire and provide preferences and experimental suggestions.

Measurements and Analysis In this experiment, eye movement data in visual search and logical thinking tasks were collected, recorded and analyzed using the TOBII eye movement instrument.

RESULTS

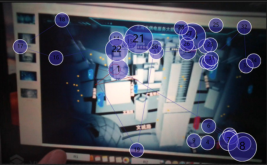
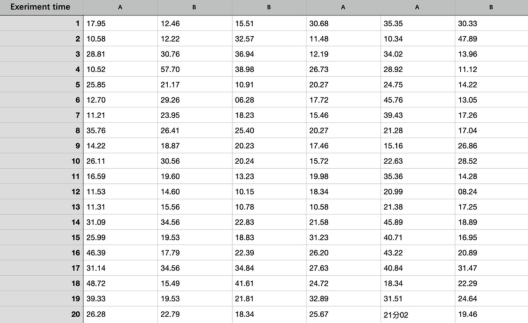
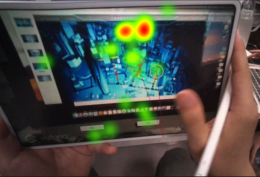
At the end of the experiment, questionnaires, question completion schedules (as shown in Figure 5), eye-tracking point charts (as shown on the right in Figure 3), thermograms (as shown on the left in Figure 3), eye-beat charts (as shown in Figure 4), and point analysis charts (as shown in Figure 4) were col- lected from the AB group, and conclusions were generated through statistical analysis of the experimental data, The results are as follows:

An Experimental Study on the Applicability of Fusion Display and Overlay Display 363

Figure 3: Point-and-figure plot (right) and heatmap (left) of eye movement data.
Original PDF Figure 3:
Figure 4: Saccade graph and point-and-figure graph of eye movement data.
Original PDF Figure 4:
Figure 5: Timetable for Information Judgment.
Original PDF Figure 5:

1. In terms of correctness data analysis, the Fusion display has a significan- tly lower correctness rate than the Overlay display 2. In terms of completion efficiency, the Fusion display is significantly slower than the Overlay display in recognition The biased conclusions are as follows:

1. Under the task-oriented experiment, users in the Fusion display were more focused on text. 2. Users who used the Fusion display f tended to search more in the central area. 3. The Overlay display were more effective in completing information tasks than fusion information displays

364 Zheng and Dong

4. Users’ subjective feedback shows that fusion displays are preferred because they are more technological in nature 5. Analysis of the gaze trajectory shows that the range of eye movements of the subjects in the Fusion display is wider, while in the Overlay display, the trajectory of the subjects’ eye movements is concentrated on the layer information. 6. Analysis of the eye-movement heat map shows that the saturated colour module has a higher number of user attentions
CONCLUSIONS AND FUTURE WORK In this study, a relatively simple experiment was carried out in a short period of time to generate relevant conclusions. Subsequent experiments will expand the sample size and use biased conclusions to adjust the experimental errors and optimize the stimuli.

REFERENCES

Aigner, W., Miksch, S., Schumann, H., Tominski, (2011) C.: Visualization of Time- Oriented Data. Springer, London (2011) Application of VR/AR technology in information visualization system. Electronic

Technology,2021,50(08):23–25. Jeong, H. (2012).: A comparison of the influence of electronic books and paper books on reading comprehension, eye fatigue, and perception. Electron. Libr. 30, 390–408 Kliegl, R., Olson, R.K. (1981): Reduction and calibration of eye monitor data. Behav.

Res. Methods Instrum. 13(2), 107–111 Mao Weiqing 2014, “Research on the construction and application of 3D geographic information services for smart cities”, ISPRS Annals of Photogrammetry, Remote Sensing and Spatial Information Science, vol. II-4, Spence, R. (2007): Information Visualization: Design for Interaction, 2nd edn.

Prentice Hall, New York Steele, J., Iliinsky, N. (eds.) (2010): Beautiful Visualization. O’Reilly Media Inc., Cambridge Said Chakri (2016), “Le Plan d’Aménagement Urbain de Tanger”, CIDEAL Maroc.

Cover of the proceedings volume Usability and User Experience

Explore the complete digital volume

Usability and User Experience

Read this individual research paper free through the original publisher, or explore the full digital proceedings book.

ISBN 978-1-958651-15-5

Explore this ISBN in the AHFE Bookstore Listed in the July 2026 bookstore catalogue; search by ISBN to confirm current availability · Digital book purchase optional

Explore Related Research

Related research 8 matches

More papers from this volume

← Back to Research ExplorerBrowse the full library →