Yuting Cai, Zhengqing Jiang (2022). The Effectiveness of Amazon Headphone Video Advertising Based on Time Series Analysis. In: Symposium on Creative Technology and Digital Media. AHFE Open Access, vol. 27, pp. 9–13. https://doi.org/10.54941/ahfe1001435
Nowadays, both academia and the industry have discussed e-commerce video advertisements. However, the advertising effects and effective duration of e-commerce video advertisements mostly remain in qualitative analysis and lack quantitative analysis. In this article, using the Amazon platform, two sets of the same headset with different brand names are launched at the same time, and only one set of headsets is placed with video ads to carry out the experiment. After ten months, complete e-commerce data was obtained. Data analysis proved that: video advertising attracted a large number of consumers, which greatly increased the sales of headphones; the effective duration of video advertising was 15 weeks. This research provides an experimental method that can be quantified and analyzed for the research on the effect of video advertising on e-commerce platforms.
Under the background of the rapid development of mobile Internet, the video era has arrived, more and more audiences accept video information flow (Jia Hua, 2018), and the demand for video information is strong, and the consumption habit of video content has also been formed. studies have shown Video is very attractive, and 68% of consumers like to get pro- duct information through video advertising, so major e-commerce platforms begin to pay attention to video advertising. Since 2017, Amazon has star- ted to add a lot of video content to the website to attract users. Research shows that one in five Amazon visitors will buy related products after watch- ing videos of brands or products (Fazhan Zhou, 2018). However, for the same kind of e-commerce products, are the video advertisements on the product details pages better than simple graphic advertisements? At pre- sent, there is not much academic research on how long the video affects product sales. And put video advertisements of products or brands on Ama- zon shopping website, According to the length of delivery time, a certain fee needs to be paid, and a suitable delivery time can save a lot of costs for businesses. In order to study the video advertising effect of the same
product and the best delivery time, this paper set up a group of conditi- onal control experiments for ten months. Combined with SPSS software for data analysis, the effective duration of Amazon product video adverti- sing is studied. It is hoped that this research can provide some reference for e-commerce platform and brand parties in the production and deli- very of video advertisements in the future. Factors Engineering involves understanding the need for comprehensive integration of human capabilities (cognitive, physical, sensory, and team dynamics) into a system design, begin- ning with conceptualization and continuing through system disposal (Yong Zhou, 2018). The primary concern for human factors engineering is the need to effectively integrate human capabilities with system interfaces to achieve optimal total system performance (use, operation, maintenance, support, and sustainment).
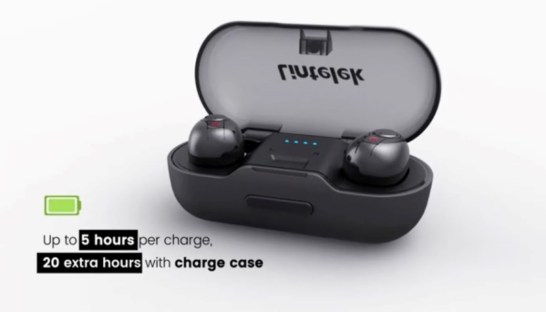
EXPERIMENTAL DESIGN In this experiment, the method of controlled experiment was adopted. Head- phones with identical products but different brand names were divided into two groups, A and B, which were put on Amazon.com in January 2019 for a 10-month controlled experiment. The materials, shapes and functions of the headphones A and B are identical, and they are designed and produced by the same domestic company.The difference between them on the product details page of Amazon. com is that Group A uses video and pictures for publicity, while Group B only uses pictures.
Brand owners put exactly the same two sets of headphones A and B on Amazon platform at the same time, and all their features and functions are identical, only the brand names are different. At the same time, put the produ- ced video and related picture information on the product introduction page of Amazon website of brand A, while brand B only has picture introduction.The related pictures of these two headphones are designed and produced by the same group of designers of the same company. Although the pictures are not exactly the same, they are roughly the same in the application of factors such
The Effectiveness of Amazon Headphone Video Advertising Based on Time Series Analysis 11
Table 1. Sample independent test results.
Table available in the original PDF paper.
Rank mean Sum of ranks Number of cases
Group B total sales-group A total sales
Negative rank 186a 140.84 26195.50 Positive rank 76b 102.39 7474.50 Bind value 5c total 264 a.Group B total sales<Group A total sales b.Group B total sales>Group A total sales c.Group B total sales=Group A total sales
as function introduction, use of materials and use scenes. That is, there are five pictures of product pages of brands A and B, These five sheets include the main product display diagram, the situation diagram and the function introduction diagram. The only difference between them is that A brand added a 33-second video after five pictures, but B brand didn’t. The online time of these two brands of headphones on Amazon platform was Janu- ary 24th, 2019, and the experimental design lasted for ten months. After ten months, the daily sales and visits of the two brands were obtained from the background, and the data were collected and prepared for the next data analysis.
After ten months, the brand owners collected two types of data, namely, daily page views and earphone purchases of Group A and Group B from January 24th to October 14th, 2019 in the background of Amazon.com. After the data is obtained, the corresponding models and analysis methods are used in SPSS software, and the curves and results obtained from the test are analyzed.Study the communication effect and effective action time of e- commerce video advertising.
RESULTS
After getting the sales volume and page views of the two headphones, draw these data into clear and objective line charts, and then use SPSS software to process and analyze the correlation between the data, so as to study the specific impact of e-commerce video advertisements compared with traditi- onal graphic advertisements.The following is the analysis result of the sales volume and page views chart and SPSS software.
To analyze the variance of paired samples, we must first check whether the data obeys the normal distribution, and get P=0.00<0.05.This sample does not conform to normal distribution, so it can’t be tested by T test of paired samples, but it needs to be tested by rank sum test of paired samples. P=0.00<0.05, which shows that there is a significant difference between the total sales volume of headphones in Group A and Group B. At the same time, it can be seen from Figure 6 that the sales volume of A headphones with videos is higher on average.
12 Cai and Jiang
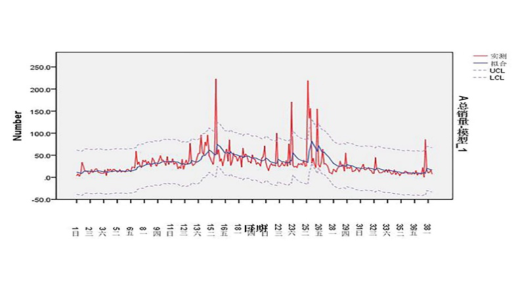
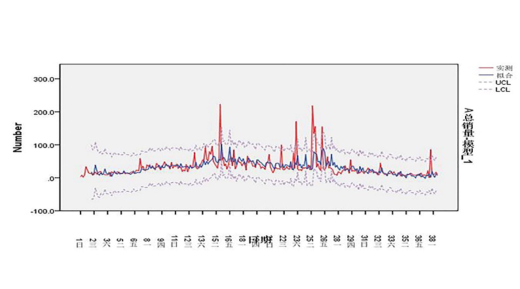
Figure 2: Fitting sales curve of the model.Figure 3: ARIMA model.
According to the above paired sample rank sum test about the sales volume between group A and group B, it can be seen that the video in group A has a significant impact on the sales volume of headphones.
The time series method in SPSS can analyze the past data to predict the future data, which can help researchers understand the future situation of things and make corresponding preparations for it. By forecasting, we can know the consequences of the current decision, and determine the decision by analyzing the consequences. Strive to make the current decision-making achieve the best future benefits. This research method can help the author to understand the action time of video advertisements, the change trend of sales volume and whether there are some seasonal and periodic change patterns and rules.
First we use Exponential smoothing model to analyze the experimental date. According to fig 2, the simple model showed a corresponding change trend, but it was not the expected result. It didn’t consider seasonal changes or periodic changes, which indicated that the model was not suitable for the research topic.
Based on the above results,we use the ARIMA (autoregressive integra- ted moving average integrated moving average autoregressive) model for
The Effectiveness of Amazon Headphone Video Advertising Based on Time Series Analysis 13
analysis. As shown in fig. 3, the fitted ARIMA model is a blue curve, which is similar to the red curve of the example and fits well.
CONCLUSION
The video advertising of products on the e-shopping platform adds video information and audio information to the products (Gang Lin, 2016), so that consumers can better imagine the performance and use situation of the pro- ducts. The overall sales volume of earphone brands that put video advertising shows a trend of first rising and then gradually declining. In the first 15 weeks of video advertising, the sales volume of headphones generally showed an upward trend, and began to show a downward trend after 15 weeks, indica- ting that video advertising has a limited time to promote consumers’ purchase intention and purchase behavior, and does not always play a positive role after it is launched.
The experiment was conducted in the real online sales environment, but there are still some defects. For example, the home page display pictures of AB and ab headphones are different, which will affect the sales of headphones to a certain extent. In the future, if conditions permit, we can improve the experiment and obtain more accurate results.
ACKNOWLEDGMENT
The authors would like to acknowledge my teacher professor Jiang. He pro- vided an opportunity for my experiment and helped me sort out my ideas in the writing of later papers.
REFERENCES
Jia Hua. (2016). “Yidu Video and Yitiao Video: two modes of short video advertising from media”, Published by wide angle, 66–68. Fazhan Zhou. (2018). “Research on the impact of clothing video presentation on
consumers online shopping”, Zhengjiang University of Technology. Yong Zhou, Lerong Ni. (2018). “An empirical study on the communication effect of immersive news-an experiment based on information cognition, emotional perception and attitude intention”, communication and journalism. 31–36. Gang Lin. (2016). “Communication effect of e-commerce video advertising among
College Students—Taking tmall Jingdong.com and Suning Tesco as examples”, Young journalist.
LISTED IN THE AHFE DIGITAL BOOKSTORE CATALOGUE
Explore the complete digital volume
Symposium on Creative Technology and Digital Media
Read this individual research paper free through the original publisher, or explore the full digital proceedings book.
ISBN 978-1-958651-03-2
Explore this ISBN in the AHFE Bookstore ↗Listed in the July 2026 bookstore catalogue; search by ISBN to confirm current availability · Digital book purchase optional