1 Department of Information Systems, King Faisal University, Al-Hasa 31982, Saudi Arabia; School of Computer Science, University of Birmingham, B15 2TT, UK ↗
2 School of Computer Science, University of Birmingham, B15 2TT, UK ↗
It is possible that either the automation is not 100% correct or that the human knows information that the automation does not; in either case, the human will need to choose whether to follow the recommendation of the automation or not. This research focuses on human sensemaking, specifically how people organise information and how closely it matches what a system does using the data/frame model. Varied levels of automation were simulated in the investigation, as well as different levels of certainty. Answering questions to solve a case involving a group attacking an institution in a given location at a specific time was the scenario that has been used in this study. The sensemaking process was applied using the card sorting technique, and the automation confidence degree was determined using the intelligent analysis approach. The results showed that even though the provided frames are perhaps more practical, people appear to be more consistent when using self-generated frames rather than the provided frames. The way people grouped information was not necessarily the same as how computers did it. Furthermore, people appear to believe information presented by a computer with confidence levels represented by scores or colours. They will accept the computer's confidence predictions and make their own decisions based on them, even if they are not rational.
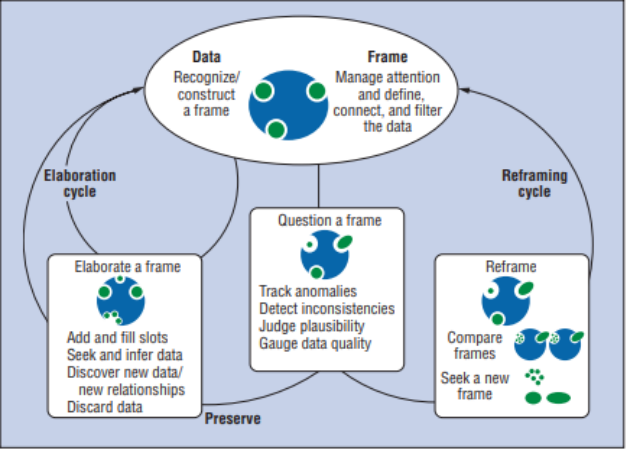
Sensemaking is a form of abductive reasoning that involves exploring uncertain or ambiguous information in order to reason about conclusions that the reasoner believes to be most likely. Abductive reasoning is to abduce (which means ‘take away’) a logical conclusion, inference, assumption or best guess from a set of observations (Peirce 1955) – or what could be called reasoning to the best explanation (Sober 2013). However, this can be challenging, even for experts, because of the need to determine the relevance of the observed information and the definition of a ‘best explanation.’ In the Data-Frame Model (DFM)of sensemaking (Klein et al. 2006) a chain of closed-loop relation between data and a frame which provides the ‘best explanation’ (for that person using those data in that situation). This is illsutrated by Figure 1.
Figure 1. The Data/Frame Theory of sensemaking (Klein et al. 2006) Automation can sift more information than a human, find associations between information that the person might miss, run multiple tests on conclusions, or quantify the ‘goodness’ of an explanation. From this, automation could perform deduction and induction (particularly at scale), and humans could perform abduction. As such, humans and automation could cooperate in mixed-initiative teams. However, the
Human Interaction & Emerging Technologies (IHIET-AI 2022) Artificial Intelligence & Future Applications https://openaccess.cms-conferences.org/#/publications/book/978-1-7923-8989-4 hypothesis that the human is applying in abductive reasoning might not fit the rules being applied through deduction or might focus on a partial set of information being used for induction. This does not mean that the human would be correct and the computer incorrect (or vice versa) but that different outcomes from different reasoning processes could complicate the ability of humans and automation to work in mixed-initiative teams.
EXPERIMENT A combination of card-sorting (Hudson 2012) and ‘think aloud’ (Van Someren et al. 1994) has been used in the experiment to understand how participants apply the DFM throughout the sensemaking process with and without advice from simulated automation. Specifically, we were interested in whether participants would be influenced by the support that was provided and whether this meant alter the sensemaking strategy they applied.
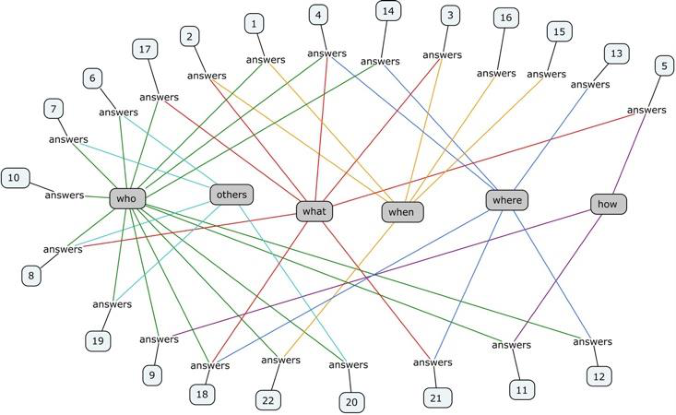
Materials for the card-sorting task were taken from the Experimental Laboratory for Investigating Collaboration, Information-sharing, and Trust (ELICIT). In this, participants receive ‘factoids’, or small bits of information, that relate to a fictional terror threat, and which can be allocated to ‘who’, ‘what’ etc. elements in a report (Manso and Manso, 2010). Figure 2 shows how the factoids (represented by their number) relate to these elements.
Figure 2. How each card could answer questions In addition to the content of a factoid, Intelligence Grading was adopted for defining
Human Interaction & Emerging Technologies (IHIET-AI 2022) Artificial Intelligence & Future Applications https://openaccess.cms-conferences.org/#/publications/book/978-1-7923-8989-4 the degree of confidence, which can be represented by colours. Intelligence grading is an important part of the intelligence-gathering process. Intelligence is assessed so that everyone viewing it can be confident in its accuracy. When intelligence is submitted, it should go through a grading procedure that includes assigning a handling code as part of the risk assessment process. In the 3x5x2 model, intelligence is graded using a standardised system that uses numeric and alphabetic scores (Adams 2020).
Participants A pilot study was conducted with four participants (females, aged 25–35, high education). Within-subjects design was used, which means that all participants went through each condition.
Procedure The experiment involved two sessions.
In the first session, participants performed the card sort task with uncoloured cards. Participants were given all twenty-two cards and asked to sort them into groups in two activities.
Activity 1: participants were free to choose the groups and labels (their own label).
Activity 2: participants were given category labels What, Who, Where, When, and How and asked to sort the cards using these labels (provided label).
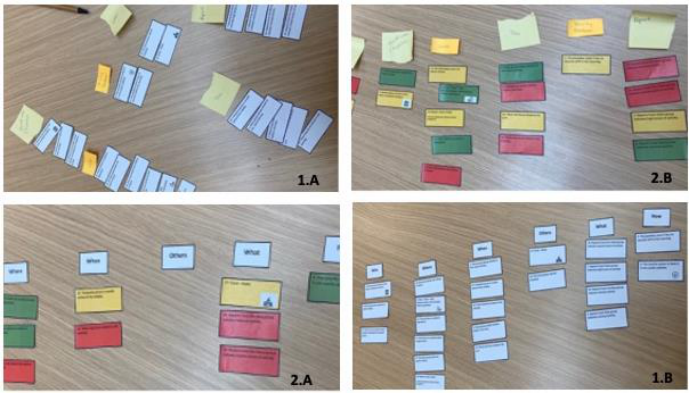
In the second session, participants performed the reasoning task. This involved a subset of the cards which related to a specific question. These cards were colour- coded to represent Intelligence Grading. Participants were asked to sort these cards according to either their own or the provided labels. Following this, they were asked to select a set of cards that would allow them to decide on a good answer to the specific event that the cards were most likely to be describing. This required them to reason about (a) the most likely event (i.e., the best explanation) and (b) the relevance of information (i.e., the most useful pieces of information on the cards). Some photos from the experiment are shown below (Figure 3).
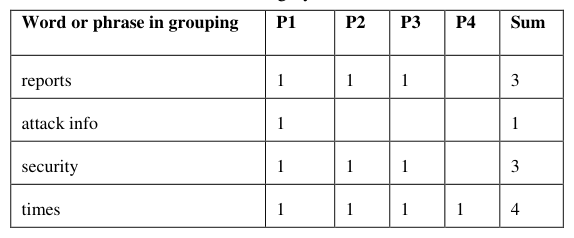
Session One For the first activity, participants spent more time sorting and categorising the cards using their own labels (c. 20 minutes) compared to sorting with provided labels (c. 5 minutes). For own labels, the average number of categories was 5.5. Table 1 shows that the four participants used the words ‘times’ and ‘locations’ in card sorting. In addition, three of them used the words reports, security and groups in the experiment. However, only one participant used the concepts attack info, qualifications or expertise, others, activity, and number of members.
Figure 3. Photos from the experimentTable 1: Category names 1.A Word or phrase in grouping P1 P2 P3 P4 Sum reports 1 1 1 3 attack info 1 1
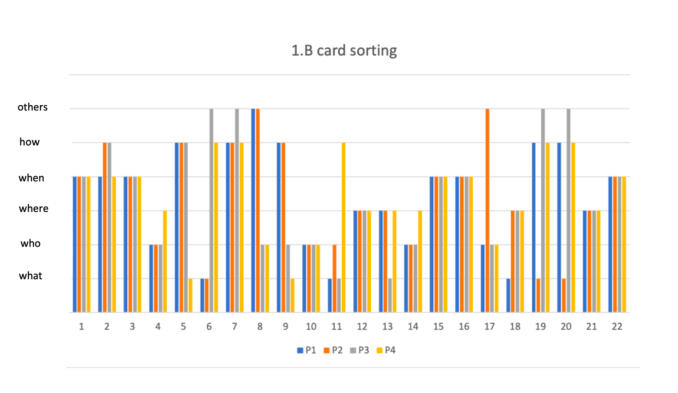
Each card sorting was compared among the participants. Here we focused on 1.B, where the frames that we defined were used. Figure 4 summarizes the comparison. For instance, card number 1 was used by all participants as the answer to the ‘where’ question.
Figure 4. Card sorting similarities
Eight cards were sorted under the same category by all participants. In addition, seven cards were sorted under the same frame by at least 75% of the participants. However, 50% of the participants sorted another seven cards under the same label.
In contrast to the first activity, participants spent more time (c. 7.25 minutes) sorting cards and solving the problem with provided labels, compared to using their own categories (c. 6.75 minutes).
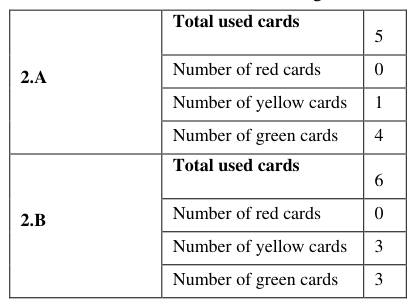
The use of colour for Intelligence Grading affected choice of cards to use (Table 2).
Table 2: Coloured cards using Total used cards
Session Two In 2.A, three participants answered with ‘Turquoise is cyber attacking Bank X in sigma land at midday’ using the cards ‘5,11,13,21,22.’ One answered with ‘The Brown group will attack a bank at 10 p.m. in sigma land’ using the cards ‘5,8,9,13,15,21’ (Figure 5).
Cards used in making decision 2.A
0 1 2 3 4 5
5 8 9 11 13 15 21 22
Figure 5. Cards used in making decision 2.A
Figure available in the original PDF paper.
In 2.B, all four participants answered with ‘Silver is attacking Jewellery shop Y in sigma land early in the morning.’ The used cards were ‘1,2,4,7,12,13’, as shown in Figure 6.
By conducting this study, we were trying to answer a number of questions. From the first session, the study answers the following:
1. What frames do people create while sorting the cards? How similar are those frames among the participants?
They created about five categories while sorting the cards (1.A) as illustrated in Table 1. It has been discovered that the most commonly used words were times and locations, and 75% of the participants used the words reports, security and groups. Nevertheless, the unique phrases were attack info, qualifications or expertise, others, activity, and number of members.
2. How similarly do the participants sort the cards? How do they use the frames provided?
The study illustrated that there were similarities in the cards’ sorting among all participants. About 36% of the cards were categorised under the same label by all of them. Furthermore, about 64% of the cards were categorised under the same label by at least half of the participants.
The second session aimed to answer the following:
1. Will different people produce the same solution?
While answering the first question in 2.A, one individual produced a different solution, while the other three solutions were similar. However, all four participants used the same three cards (5,13,21) in making their final decision. In 2.B, the participants all produced the same answer for the second situation, even though one card (12) was used by only three of them in producing their final answer.
2. How does the level of confidence affect participants’ decisions in solving the problem?
The results show that people believed the colour coding and adhered to it. They ignored the red cards and tried to avoid the yellow ones until they needed to use them. Consequently, when it comes to colour coding or generating frames, people may not realise that the computer isn't always accurate.
In general, both sessions answered the following:
1. How consistent were people in applying the frames between the two sessions?
Between the two sessions, the correlation average in sorting the cards under provided labels was about 0.56. This means that the participants sorted the majority of the cards in the same category in both sessions. However, the average was about 0.9 for sorting the cards under the categories that they had defined. Thus, they seemed to be more consistent in sorting the cards using their own frames rather than the frames that we provided. They remembered their own generated frames and the cards that related to those frames better, which agrees with the previous work done by Hayhoe (1990). It has been concluded that the grouping while the participants sorted the menu items into groups and subsequently assigned titles to these categories outperformed the other categorisations in terms of timelines and memory recall faults. As a result of having sorted it themselves, the subjects would be better familiar with both the category and the related collection (Hayhoe 1990).
CONCLUSIONS
People seem to be more consistent when using the self-generated frames rather than the provided frames, even though the provided frames are arguably more practical. We can conclude that the computer-generated frames (terms or labels) might be not useful because people will not always agree with what the computer suggests. The provided frames might not be as consistently used, even if they are the more obvious choice. This means that if the computer organises the information by creating labels or frames, it does not guarantee that people will understand it because their interpreted frames may be different. We suggest that it would be better to allow people to make their own frames and for the computer to adapt those labels rather than the computer deciding what the frames are in the first place.
Additionally, it has been explored that if the computer provides the information with scores or colours related to the levels of confidence, people will believe that.
Finally, our participant did not categories the data in the same way that the computer did. People are more likely to follow the recommendations of simulated automation if it seems reliable. This supports the findings of Bahrami et al. (2010), who found that it will raise automation bias, or the risk that humans will agree with automation if it appears confident.
The study's findings suggest that future research should emphasize on how individuals interpret information that isn't colour-coded accurately by computers.
REFERENCES
Adams, S. (2020). The 5-minute guide to the intelligence grading process and its application in OSINT. Retrieved from https://www.intelligencewithsteve.com/post/the-5-minute-guide-to-the- intelligence-grading-process-and-its-application-in-osint Bahrami, B., Olsen, K., Latham, P.E., Roepstorff, A., Rees, G. And Frith, C.D., 2010. Optimally interacting minds. Science, 329(5995), pp. 1081-1085.
Hayhoe, D. (1990). Sorting-based menu categories. International Journal of Man- Machine Studies, 33(6), 677-705.
Hudson, W. (2012). Card sorting. Encyclopedia of Human-Computer Interaction, Klein, G., Moon, B., & Hoffman, R. R. (2006). Making sense of sensemaking 2: A macrocognitive model. IEEE Intelligent Systems, 21(5), 88-92.
Manso, M., & Manso, B. (2010). No title. N2C2M2 Experimentation and Validation: Understanding its C2 Approaches and Implications, Peirce, C.S., 1955. Philosophical writings of Peirce. Courier Corporation.
Sober, E., 2013. Empiricism. The Routledge companion to philosophy of science. Routledge, pp. 192-201.
Van Someren, M. W., Barnard, Y. F., & Sandberg, J. (1994). The think aloud method: A practical approach to modelling cognitive. London: AcademicPress,
Read this individual research paper free through the original publisher, or explore the full digital proceedings book.
ISBN 978-1-7923-8989-4
Explore this ISBN in the AHFE Bookstore ↗Listed in the July 2026 bookstore catalogue; search by ISBN to confirm current availability · Digital book purchase optional