Khalda Ali, AMIR MOHAMED, Maram Alzaidi (2022). Integrating Big Data With Measuring Liver Volume Using Algorithms Bank Removing Noise and MRI Modality. In: Human Interaction & Emerging Technologies (IHIET-AI 2022): Artificial Intelligence & Future Applications. AHFE Open Access, vol. 23. https://doi.org/10.54941/ahfe100856
Big data is massive amount of information that work wonderfully. Due to the great potential that it has for the last two decades this topic is taking a special interest. In any analysis scientists, the way in which it leverages, manage and analyse can change. The most promising field in which big data use for making the change is measuring soft organs in the human body such as a liver organ. For measuring organ and medical imaging informatics research it increasingly used the technologies of big data. For certain advanced big data analytics methods, predictive analytics, and user behaviour analytics the term big data used. At an unprecedented scale and speed huge amount of medical imaging and visual informatics data have been collected and generated. in big data in measuring liver volume, several sources incorporate medical examination results, hospital records, devices, and patient's medical records that are a piece of the internet of things. In medical imaging, it also finds its usages. In order to treat, diagnose or monitor medical conditions to view the human body the various technologies that are used referred to as medical imaging.
The medical images can be classified into three types that are an anatomical image, physiological image, and pathological image (Xiang et al., 2017 & Maya Eapen, Reeba Korah 2019). Anatomical model; this type of medical imaging used in information pertains to the location and extent of organ structures. While the physiological model is used to give data deals with the function of the body and the Pathological image is used to provide information applies to the abnormalities related to or produced by diseases that manifest in the medical images. From the context of the medical image types, the anatomical image is used to determine the measure liver volume. This research focuses on the anatomical image from MRI modality. Those who sought to achieve accurate results for the liver volume to the results reached through the use of different methods, as well as different algorithms. According to prior studies and to calculate the liver volume, has been using different algorithms for the calculation of the liver volume, Table 1 shows the algorithms, development, and results over the previous period.
MRI Hu- man liver
BIG DATA
DICOM liver image file
Figure. 1. Workflow of measuring liver volume
Table 1 Comparison between algorithms and Gold standard based on the liver volume and accuracy No Researcher Year Algorithm Result
1 AJR Am J Roentgnol
Developed an automatic liver segmentation scheme for MRI
2019 Level-set cou- ple with Geo- desic active contour.
Kenji Suzuki et al.
2 Cheng et al. 2012 Mote Carlo Improved method to segment calcified vessels in 3 Kenji Suzuki et al.
2019 Geodesic ac- tive contour
4 Cheng, et al. 2007 Mote Carlo Merge and split methods are also shown to be very effec- tive to demarcate objects of interest
Integrated region-based and physics-based modelling techniques to significantly improve the boundary detec- tion results. 6 Chang et al. 1994 Region-grow- ing
Process on local feature space without the need of pa- rameter tuning or require- ment of prior knowledge. 7 Adams et al.
1994 Region grow- ing
(Merge and split methods are also shown to be very effec- tive to demarcate objects of interest) A method to achieve robust, rapid, and free of tun- ing parameters image seg- mentation. The method, how- ever, requires the input of some seeds, either individual pixels or regions, from users. MEDICAL IMAGE MODALITIES Several imaging modalities provide specific types of information regarding the morphology, physical, metabolism, molecular, composition, or molecular pathways within biological tissues, and provides the information in a particular spatial and temporal that information on sensitivity for detection. No one imaging modality can approach all measurements of interest related to the biological system; therefore, it can be beneficial to acquire images of the same subject using different patterns. Multi-modalities imaging involves the simultaneous or sequential acquisition of imaging data using two or more imaging modalities. A typical example would be functional, structural imaging using molecular medicine techniques such as (PET/SPECT). To measure some aspect of biology or molecular function, combined with X-Ray, Computed tomography (CT), or magnetic.
Figure2. Medical imaging modalities platform (Book. Encyclopedia of Diagnostic Imaging (Baet, 2019).
Figure available in the original PDF paper.
Magnetic Resonance Imaging (MRI) imaging initially researched, and the first MRI imaging prototypes tested on clinical patients in 1980. Countless scientists have involved in the innovation of magnetic resonance. The development of MRI imaging attributed to Paul Lauterbur and scientists at Thorn-EMI Laboratories, England, and Nottingham University, England. (http://www.imaginis.com/ct- scan/brief-history-of-CT).
ALGORITHMS BANK
The Algorithms Bank term is intended that the seven algorithms used in the com- pletion of the tasks assigned to it, where a particular function for each algorithm. The Algorithms Bank has been classified into three broad classifications, as it rep- resents the first classification algorithms that remove noise affecting the images, whether this noise was external or internal, these algorithms are Anisotropic diffu- sion filter and a Median filter. The second classification is the algorithms that en- hance and purify the outer boundaries of the non-geometric shape and represented by the liver volume; these algorithms are A scale – particular gradient magnitude filter and Gaussian filter. The third classification described by algorithms that pro- cess complete measurements of non-geometric shapes, the non-geometric shape is a liver organ, where the liver is one of the soft organs in the human body, these algorithms are Fast marching, Geodesic Active Contour & Level set. Figure 3 shows the Algorithms Bank diagram.
Referring to figure3, the Algorithms Bank depends on seven algorithms, these al- gorithms divided into three stages, each stage includes specific algorithms. The next part clarifies the algorithms. In the proposed framework, precise and suitable elements from measuring non-geometric methods are selected to form the frame- work for programming, measuring non-geometric soft organs in the human body. This structure illustrated in figure3
Figure. 4. Framework for Programming, Measuring Non-Geometric Soft Organ
In figure 4, the service offered in the programming, measuring non-geometric soft organs includes removing noise, enhancement, segmentation, and measuring vol- ume. This figure shows the framework for measuring the liver volume, the frame- work includes four sub-program, each of them generates results, where the results of removing noise application, enhancement application, and segmentation appli- cation with measuring liver volume application. The comparison includes two measures, these measures are accuracy and error rate. SYSTEM ARCHITECTURE FOR MEASURING NON-GEOMETRIC SHAPE SOFT ORGAN IN HUMAN BODY- LIVER VOLUME The system architecture for measuring non-geometric shape delicate organ- liver volume- divided into three sections so that each section has a particular role. The first section is the user, who is using the prototype application. The second part represents the medical application, this section divided into three sub-applications, these applications are removing a noise application, enhancement application, and segment application. The previous sub-applications controlled by the artificial neu- ral network to reduce the error rate with more accuracy. The third section is called a template section, which linked to the previous medical application. The purpose of this section measuring the new image after manipulating it for medical use, the new image compares with the previous templates in the template section. When the image is new, the template section creates a new template and store it. The follow- ing flow chart, figure 5, shows the creation of a new template using the medical application.
In figure 6, Illustrates the removing noise from the image, in this case, the images from two modalities sources MRI. Also, the figure 6 Illustrates the measuring liver volume histogram by the Template using the Algorithms Bank and measuring liver volume histogram by removing noise method using two algorithms, and these al- gorithms are Anisotropic diffusion filter algorithms and Median filter algorithm.
Figure. 6. illustrates the removing noise and comparison the measuring liver volume Histogram between Algorithm’s bank's Template method and removing method
Regarding the removing noise method and Algorithms Bank method, the prototype application has been given the results from two modalities; these modalities are MRI.
MRI MODALITY
When implemented the removing noise method and Algorithms Bank method us- ing the MR modality resources, the system gave the results in Table 5.1. In Table 5.1 Illustrates the comparison between removing noise method and Algorithms Bank method, the comparison includes the two parameters, accuracy and error rate. The source of this case from the MRI modality, from this modality, has gotten rep- resentative images, six male, and four females, the age ranging between 42 and 55 years. The comparison results between two methods represented in the following table 2.
Table 2 The comparison results between Removing Noise Algorithms method and Algorithms Bank Template method using MRI modality
Algorithms bank
Removing noise algorithms hybrid method
method
No Modality Gender Age Accuracy (100%)
Accuracy (100%)
Error rate (100%)
Error rate (100 %)
1 MRI Male 45 99.40 3.60 99.7 3.20 3 MRI Male 40 99.40 3.60 99.8 3.10 4 MRI Male 55 99.50 3.60 99.8 3.10 7 MRI Male 44 99.30 3.80 99.8 3.10 9 MRI Male 40 99.40 3.60 99.8 3.00 8 MRI Male 52 99.20 3.60 99.7 3.10 5 MRI Female 55 99.50 3.60 99.7 3.20 2 MRI Female 50 99.20 3.70 99.6 3.20 6 MRI Female 49 99.40 3.60 99.7 2.90 10 MRI Female 42 99.50 3.60 99.8 3.10 In Table 2, the high accuracy value using the Remove noise method is 99.5, this value repeated three times, while that the high-efficiency value using the Algo- rithms Bank is 99.8, this value repeated five times. For the error rate, the lowest error rate value using the Remove noise is 3.6, this value repeated eight times, while that the lowest error rate using Algorithms Bank is 3.00, this value happens one time. Through the previous readings, which were monitored in table 2, it is clear that the algorithms bank hybrid method is more high accuracy and less error rate than removing noise algorithms. To present the data in Table 5.1 using the bar chart, diagram, figure 5 illustrates the data in columns. In figure 7 Illustrates also the comparison between the removing noise method and Algorithms’ Bank Hybrid method using MRI modality source, this comparison regarding accuracy and error rate with two factors, age, and gender. Figure 6 Comparison Remove noise method and Algorithms Bank hybrid method using MRI modality.
Figure. 7. Illustrates the number of six male and four female cases under the studying the measuring liver volume.
In figure 7, the bar chart illustrates the number of six male and four female cases under the studying the measuring liver volume, the age of the male and female between 40 years to 55 years. Each case the chart illustrates four figures, that fig- ures are age, measuring liver volume by removing noise method, measuring vol- ume by the Algorithms Bank hybrid method and the two error rates by the previous methods. In Table 3 calculated the average results from the two approaches, these methods removing noise and Algorithm Bank Hybrid method. The table illustrates the comparative average for age, accuracy and error rate. Table 3 Illustrates the comparison, average results between removing noise method and Algorithms Bank using MRI modality
Average
Removing noise Algorithm’s bank Age Accuracy Error rate Accuracy Error rate 47 99.38 3.63 99.74 3.10
When examining the results in Table 3 in the bar chart, figure 8 illustrates the high accuracy average results for the previous methods in the bar graph. In this graph, It can saw that the accuracy average of the liver volume by the removing noise method is 99.38%, while that the accuracy of the liver volume by the Algorithms Bank Hybrid method is 99.74%, this means the accuracy in Algorithms Bank is higher than removing noise by 0.36%.
Figure. 8. llustrates the comparison averages values between removing noise method and Hybrid method in accuracy and error rate using MRI modality
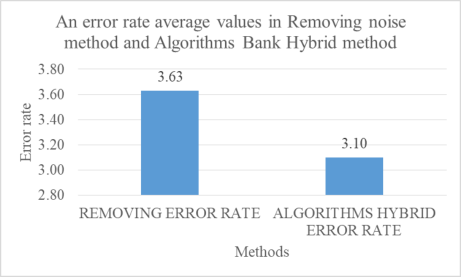
Referring to table 3, figure 9 displays an error rate in two methods, these methods are removing noise and Algorithms Bank Hybrid method. The removing error rate is 3.63 and the Algorithms Bank Hybrid error rate is 3.1 when they examine the two error rate values; the Algorithms Bank Hybrid error rate is less than the remov- ing error rate by 0.53. The bar chart shows the number of six male and four female cases under the studying the measuring liver volume, the age of the male and fe- male between 40 years to 55 years.
Figure 9. Illustrates the comparison averages values between removing noise method and Algorithms Bank Hybrid method in an error rate using MRI modality
FUTURE WORK
In order to produce a better system and improve the research, future works that can be undertaken are as follow It necessary to collect more images related to the pro- totype application liver volume with high definition to obtain high accuracy with reducing the error rate. It is better to develop the source image from another differ- ent source such as PET, X-ray A. The images convert under the DICOM extension file and testing by the prototype application to get the measurement organ.
REFRENCES J.Z. Cheng, (2019). “Computer-aided US diagnosis of breast lesions by using
cell-based contour grouping,” Radiology, 255(3), pp. 746-54, 2019.
Kenji Suzuki, 2019, “Computerized Liver Volumetry on MRI buy Using 3D Geodesic Active Contour Segmentation”
Kenji Suzuki,a_ Ryan Kohlbrenner, Mark L. Epstein, Ademola M. Obajuluwa, Jianwu Xu, (2019). “Computer-aided measurement of liver volumes in CT by means of geodesic active contour segmentation coupled with level-set algorithms”The University of Chicago, 5841 South Maryland Avenue, Chicago, Illinois 60637-2019.
Maya Eapen, Reeba Korah (2019). Medical image segmentation for anatomical knowledge extraction. Journal of Computer Science 10 (7): 1253-1258, 2019 ISSN: 1549-3636.
Xiang, S.Z., Y. Zhan, V.C. Raykar, G. Hermosillo and L. Bogoni et al., (2012).
Mining anatomical, physiological and pathological information from medical images. ACM SIGKDD Explorat. Newslett., 14: 25-34. DOI: 10.1145/2408736.2408741.
Xiao Song, Ming Cheng, Boliang Wang, Shaohui Huang, Xiaoyang Huang, (2011), Computer-aided Preoperative Planning for liver Surgery based on CT Images, International Conference on Advances in Engineering.
Book.. Albert L.Baet. Springer reference (2019). Encyclopedia of Diagnostic imaging.
Brent Foster, (2019). A review on segmentation of positron emission tomography images. Computers in Biology and Medicine50(2019)76–96.
Brent Foster, Ulas Bagci n, Awais Mansoor, ZiyueXu, DanielJ. Mollura. (2019). A review on segmentation of positron emission tomography images. Com- puters in Biology and Medicine 50(2019)76–96.
Bruce H. Hasegawa. (1991) The Physics of Medical X-ray Imaging: (or the Photon and Me, how I Saw the Light. Medical Physics Pub.,. 0944838235, 9780944838235. Chiegwu HU et al. (2019). Relationship of Fetal Liver Volume with Estimated Fetal Weight and Gestational Age: A 2-Dimensional Ultra sono graphic Study of Normal Nigerian Fetuses International Journal of Medicine and Medical Sciences, ISSN: 2051-5731, Vol.47, Issue.1.
Read this individual research paper free through the original publisher, or explore the full digital proceedings book.
ISBN 978-1-7923-8989-4
Explore this ISBN in the AHFE Bookstore ↗Listed in the July 2026 bookstore catalogue; search by ISBN to confirm current availability · Digital book purchase optional