Angie Gianella Valdiviezo Curipuma, Sarai Elizabeth Leon Vera, Santos Ebert Yanayaco Culquicondor, Yesenia Saavedra Navarro, Cristhian Nicolas Aldana Yarleque, Luis Ramón Trelles Pozo, Nelson Chuquihuanca Yacsahuanca, Gustavo Mendoza (2022). Determinants of renewable and non-renewable energy demand and new trends in Peru. In: Intelligent Human Systems Integration (IHSI 2022): Integrating People and Intelligent Systems. AHFE Open Access, vol. 22. https://doi.org/10.54941/ahfe1001012
Today, sustainable economic development is essential for a country, so it is necessary to act in the planning and efficient use of our resources and to achieve clean and renewable energy. The determinants of renewable and non-renewable energy demand are mainly based on economic growth, financial development and trade. Likewise, the impact of economic growth on energy demand considers that higher energy consumption leads to economic growth. In Peru, promoting energy planning and efficiency actions, as well as the generation and use of renewable energies for economic and energy development to be sustainable in the country. Therefore, this research analyzes the effect of tariffs, GDP and population on the demand for renewable and non-renewable energy in the period 2013 to 2020.
Intelligent Human Systems Integration (IHSI 2022): Integrating People and Intelligent Systems https://openaccess.cms-conferences.org/#/publications/book/978-1-7923-8988-7
INTRODUCTION
In Latin America, faced with the crisis in the optimization and use of renewable energies (Howel et al. 2021), socioeconomic models are emerging that seek to optimize the use of renewable and non-renewable resources based on growing social and industrial demand (Perez et al. 2021).
The determinants of investment in renewable energies, where they showed that the governing parties of the left and the center are more capable of promoting investment in renewable energies than the governments of the right, due to the fact that they present a significant 1% (Abba et al. 2021). Likewise, the increase in the consumption of renewable energies and the importance of the participation of democratic institutions (Akintande et al. 2020), for which they were able to demonstrate that those countries that protect the rights of the population obtain greater economic growth, which leads to a greater use or consumption of renewable energies (Bulavskaya et al. 2018).
In addition, there are spatial econometric analyses on the impact of renewable energy determinants on various renewable energy sources, which showed in their results that the development of the latest renewable energies such as wind, solar, bioenergy and geothermal enjoys more funding in countries with higher R&D level (Bulavskaya et al. 2018). While, other researches on energy demand in China, point out in their study from 1980 to 2016 (Cao et al. 2021), that per capita income as well as financial development are fundamental factors for the instigation of renewable energy consumption, unlike trade openness, due to which it has a positive effect on non- renewable energies (Das et al. 2021).
According to publications, electricity has become the source of final energy demand, with an accelerated growth, making this sector, nowadays, one of the most attractive scenarios for investment, especially for renewable energies (Kim et al. 2021). Therefore, at an international level, the power supply source is being modified (Li et al. 2021); this is due to the in-crease in the promotion of renewable energy production sources, since they contribute to a sustainable and eco-friendly development (Ma et al. 2021). The 81.3% belongs to traditional energies, i.e. fossil fuels, while only non- traditional energies, in other words, renewable energies have a representation of 2% in the energy matrix worldwide (Ministry of Energy and Mines, 2019). With regard to Peru's electricity generation matrix, it has been one of the cleanest in Latin America, since it is low in carbon emissions, due to the importance given to hydroelectric production, despite the growth of natural gas power plants, after the start of the Camisea project in 2004, our country's matrix continues to be one of the cleanest compared to others (Osinergmin, 2019).
In addition, as Osinergmin expressed, the economic development of a country is connected to the per capita energy consumption (Osinergmin, 2019), because if there is a higher energy consumption, there will be a higher economic growth, which causes
Intelligent Human Systems Integration (IHSI 2022): Integrating People and Intelligent Systems https://openaccess.cms-conferences.org/#/publications/book/978-1-7923-8988-7 an increase in greenhouse gas emissions (GHG) and as a consequence, an increase in economic activity a clear example is the United States of America (Osinergmin, 2017).
Finally, this research will cooperate in mitigating the growth of carbon emissions (Njoh et al. 2021), in meeting or modifying climate change objectives, in the development of future optimal energy policies in the guidelines for the use of renewable and non-renewable energies (Zhao et al. 2020), and especially in the determination of the determinants that affect electricity demand (Shahbaz et al. 2021).
MATERIALS AND METHODS
In the present research, data from the period 2013 to 2020 have been used on a monthly basis, since they are the most updated data that could be collected on the variables to be considered in the model. The variables in the study of the model have been taken into account, according to the energy demand, which is determined by the tariffs (TF) that includes the energy prices, the Gross Domestic Product (in English: GDP, in Spanish PBI), which was considered in thousands of dollars, and the Population (PLB), which is represented in millions of inhabitants. The data has been obtained from several true sources, the data of the demands of renewable and non- renewable energies has been extracted from the Economic Operation Committee of the National Interconnected System (in Spanish, COES), while the data of tariffs, GDP and PLB come from the Central Bank of Reserves of Peru (in Spanish, BCRP).
It has focused on electricity tariffs, Gross Domestic Product (GDP) and population using monthly data from 2013 to 2020. Therefore, the following model has been developed using the theoretical literature: 𝛾𝑡= 𝛽0 + 𝛽1𝑥1𝑡+ 𝛽2𝑥2𝑡+ 𝛽3𝑥3𝑡+ 𝜀𝑡 (1)
Where each estimator represents renewable energy demand, non-renewable energy demand, electricity tariffs, Gross Domestic Product and population. Similarly, 𝜀𝑡, shows the error term in a period in the model.
In addition, a computational code for this model was implemented in Python software as follows: import seaborn as sns correlaciones=data1.corr() fig, ax = plt.subplots(nrows=1, ncols=1, figsize=(5, 5)) sns.heatmap(correlaciones,annot = True,cbar = False,annot_kws = {"size": 8},vmin = -1,vmax = 1,center = 0,cmap = sns.diverging_palette(20, 220, n=200),square = True,ax = ax) ax.set_xticklabels(ax.get_xticklabels(), rotation = 45,horizontalalignment = 'right',) ax.tick_params(labelsize = 10)
Intelligent Human Systems Integration (IHSI 2022): Integrating People and Intelligent Systems https://openaccess.cms-conferences.org/#/publications/book/978-1-7923-8988-7 ax.set_title("Correlaciones de las variables") import statsmodels.formula.api as sm modelo=sm.ols(“DER~PBI+Tarifa+Poblacion”, data=data1).fit() modelo.summar() from statsmodels.stats.outliers_influence import OLSInfluence test_class =OLSInfluence(modelo) test_class.dfbetas[:5,:] from statsmodels.graphics.regressionplots import plot_leverage_resid2 fig, ax = plt.subplots(figsize=(8, 6)) fig = plot_leverage_resid2(modelo, ax=ax) import numpy as np np.linalg.cond(modelo.model.exog) name = ["Lagrange multiplier statistic", "p-value", "f-value", "f p-value"] test = sms.het_breuschpagan (modelo. resid, modelo.model.exog) lzip(name, test) RESULTS
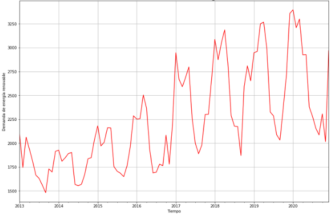
The growth of non-renewable energies and its fall in 2020 due to the effects of COVID-19, on the other hand, due to the restrictions on the demand for renewable energies, it presents a seasonal behavior of falls in the middle, end and beginning of the year, which indicates that the energy trend will be related to the GDP and state projects that promote the generation of clean energies. The global trend is focused on developing new sources that generate competitiveness every year, since their costs have been considerably reduced. In this context, we can visualize that 50% of the electric energy in Peru is renewable and it is projected to reach 60% by 2025. (see Figure 1) In addition, from the information we can indicate that the energy trend will be related to the growth of the country and one of the key indicators is the GDP, because renewable energy will advance, depending on this indicator and the projects that the state supports in the generation of clean and non-polluting energy. Likewise, it is evident that the types of energy that have a great potential are solar and wind energy, therefore, Peru has the best climatic conditions for its upward development. Our country has great potential in the energy sector, thanks to its natural resources. In addition, the hydroelectric demand is only about 7000 MW. In wind energy we can produce around 23,000 MW. And in solar energy, we have our own index, very close to 20,000 MW. Therefore, it is important to be able to establish a value for all that potential, as long as they have competitiveness.
Intelligent Human Systems Integration (IHSI 2022): Integrating People and Intelligent Systems https://openaccess.cms-conferences.org/#/publications/book/978-1-7923-8988-7
(a) Non-renewable energy demand (b) Evolution of renewable energy evolution, 2013-2020 demand, 2013-2020
Figure 1. Evolution of non-renewable and renewable energy and renewable energy demand, 2013-2020. On the left non-renewable energy and on the right renewable energy.
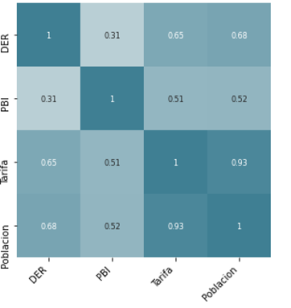
According to the matrix, it is observed that the non-renewable energy demand (in Spanish, DENR) has a relationship with the GDP of 0.83 and with the tariff of 0.82, respectively, which causes the non-renewable energy demand model (in Spanish, MDENR) to have a very good correlation, while the renewable energy demand (in Spanish, DER) has a relationship with the GDP of 0.31, with the tariff of 0.65 and the population of 0.68, respectively.
(a) Correlation of non-renewable energy (b) Correlation of renewable energy demand variables 2013-2020 demand variables, 2013-2020
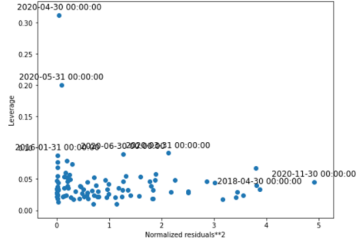
Figure 2. Correlation of non-renewable and renewable energy demand variables, (2013-2020) That there are two outliers, because they are above the horizontal references, these outliers start from April 2020, this can be interpreted as a result of the COVID-19 pandemic; since in that period it triggered great effects to the Peruvian population in particular. Likewise, it is also explained that in the last months of 2020 this behavior
Intelligent Human Systems Integration (IHSI 2022): Integrating People and Intelligent Systems https://openaccess.cms-conferences.org/#/publications/book/978-1-7923-8988-7 of non-renewable and renewable energy begins to "normalize" and almost present the same behavior. (see figure 2)
(a) Leverage vs waste Normalized to the (b) Leverage vs Normalized Residuals square of the non-renewable energy squared of renewable energy demand,2013-2020 demand, 2013-2020
Figure 3. Leverage vs Normalized Residuals squared of non-renewable energy and renewable energy demand, (2013-2020)
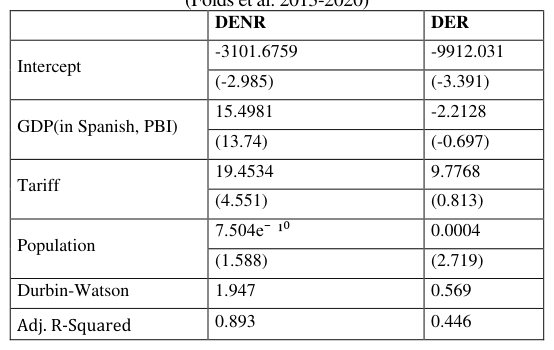
While, in the demand for renewable energy (in Spanish, DER) has an effectiveness of 44.6% of being explained by the study variables, therefore, we have that the GDP has a negative effect in our model, which indicates that if there is an increase or fall of this variable the DER will present a fall or increase respectively. Meanwhile, population and tariff have a positive effect on the demand for renewable energy. And the Durbin-Watson statistic has a positive autocorrelation 0.569, thus, it supports an in-dependence between residuals and the DER (See table 1).
Table 1: Renewable and non-renewable energy demand models (Folds et al. 2013-2020) DENR DER
Intelligent Human Systems Integration (IHSI 2022): Integrating People and Intelligent Systems https://openaccess.cms-conferences.org/#/publications/book/978-1-7923-8988-7
The results show the behavior of non-renewable energy demand (in Spanish, DENR) with an effectiveness of 89.3% to be explained by the predictor variables in which GDP (In Spanish, PBI), tariff and population have a positive effect in our model. In addition, the Durbin-Watson statistic presents a value equal to 1.947, there-fore, it maintains an independence between residuals. It is also observed that the demand for renewable energy (in Spanish, DER) is growing in Peru, even though to date the investment for the implementation of this type of energy is high.
CONCLUSIONS
The demand for non-renewable energy is the one that has the largest share in Peru, so the main source of energy consumed in the country is oil and natural gas liquids, while natural gas is in second place, because it provides almost a quarter of the energy we consume. In contrast, the demand for renewable energy is growing and has a seasonal behavior; in addition, it is influenced by the GDP, since if it increases or de- creases, it will be reflected in the production of renewable energy and its demand. Regarding the behavior of non-renewable energy, as shown in Table 1, the tariff and the population show a direct relationship in the demand for non-renewable energy. In contrast, the change in the behavior of non-renewable energy is given by the estimated equation where tariff and population have a direct relationship in the demand for non-renewable energy, and GDP has an inverse relationship, indicating the increase or decrease in the demand for renewable energy. In addition, the behavior of the demand for non-renewable energy in its determinants such as GDP, population and tariff; sustain a direct relationship, which implies the constant growth in the change of non-renewable energy and it can be observed that the Tariff and the Population have a direct relationship; on the other hand, the GDP has an inverse relationship where a variation would imply in the growth or de-growth of the demand for renewable energy.
ACKNOWLEDGMENTS
The authors would like to acknowledge the Universidad Nacional de Frontera, Sullana, Piura, Perú.
REFERENCES
Abban, A. R., & Hasan, M. Z. (2021). Revisiting the determinants of renewable energy investment - New evidence from political and government ideology. Energy Policy Akintande, O. J., Olubusoye, O. E., & Adenikinju, A. F. (2020) Modeling the
determinants of renewable energy consumption. Energy, pp. 206
Intelligent Human Systems Integration (IHSI 2022): Integrating People and Intelligent Systems https://openaccess.cms-conferences.org/#/publications/book/978-1-7923-8988-7
Bulavskaya, T., & Reynés, F. Job. (2018). Creation and economic impact of renewable energy in the Netherlands. Renewable energy. pp. 528-538 Cao, X., Long, F., Wang, F., Zhao, J., Xu, J., & Jiang, J. (2021). Chemoselective
decarboxylation of higher aliphatic esters to diesel-range alkanes over the NiCu/Al2O3 bifunctional catalyst under mild reaction conditions. Renewable energy, pp. 1-13 Das, B. K., Hasan, M., & Das, P. (2021). Impact of storage technologies, temporal resolution, and PV tracking on stand-alone hybrid renewable energy for an Australian remote area application. Renewable energy, pp. 362-380 Howel, G. D., Jonrad, A.S (2021). ¿Estamos avanzando en la transición energética
en América Latina?: Análisis y Consideraciones. Kim, H., Kim, A., Byun, M., & Lim, H. (2021). Comparative feasibility studies of H2 supply scenarios for methanol as a carbon-neutral H2 carrier at various scales and distances. Renewable energy, pp. 552-559. Li, S., & Shao, Q. (2021). Exploring the determinants of renewable energy innovation
considering the institutional factors: A negative binomial analysis. Technology in Society. Ma, J., Oppong, A., Adjei, G., Adjei, H., Atta-Osei, E., Agyei-Sakyi, M., & Adu- Poku, D. (2021). Demand and supply-side determinants of electric power consumption and representative roadmaps to 100% renewable systems. Journal of Cleaner Production. Ministry of Energy and Mines. (2019). Executive Electricity Yearbook. General
Directorate of Electricity. Ministry of Energy and Mines. (2019). National Energy Balance Sheet. Lima: General Directorate of Energy Efficiency. Njoh, A. J. A. (2021). Systematic review of environmental determinants of renewable
energy performance in Ethiopia: A PESTECH analysis. renewable and sustainable energy reviews. Osinergmin. (2019). Renewable energies: experience and perspectives on Peru's road to energy transition. Lima: Energy and Mining Investment Supervisory Agency. Osinergmin. (2017). Peru's renewable energy industry: 10 years of contributions to
climate change mitigation. Lima: Policy Management and Economic AnalysisO. Perez, A., & Garcia-Rendon, J. J. (2021). Integration of non-conventional renewable energy and spot price of electricity: A counterfactual analysis for Colombia. Renewable energy. Shahbaz, M., Topcu, B. A., & Sarıgül, S. S. (2021). The effect of financial
development on renewable energy demand: The case of developing countries. Renewable Energy. Zhao, P., Lu, Z., Fang, J., Paramati, S. R., & Jiang, K. (2020). Determinants of renewable and non-renewable energy demand in China. Structural change and economic dynamics.
Intelligent Human Systems Integration (IHSI 2022): Integrating People and Intelligent Systems https://openaccess.cms-conferences.org/#/publications/book/978-1-7923-8988-7
LISTED IN THE AHFE DIGITAL BOOKSTORE CATALOGUE
Explore the complete digital volume
Intelligent Human Systems Integration (IHSI 2022): Integrating People and Intelligent Systems
Read this individual research paper free through the original publisher, or explore the full digital proceedings book.
ISBN 978-1-7923-8988-7
Explore this ISBN in the AHFE Bookstore ↗Listed in the July 2026 bookstore catalogue; search by ISBN to confirm current availability · Digital book purchase optional