David Bermeo, Daniel Urgilés, Génesis Vásquez, Diego Almeida- Galárraga, Omar Alvarado Cando (2022). Implementation of a Low-Cost Electroencephalography System for the Analysis of Neurological Biosignals for Neuropsychological Studies. In: Intelligent Human Systems Integration (IHSI 2022): Integrating People and Intelligent Systems. AHFE Open Access, vol. 22. https://doi.org/10.54941/ahfe100993
Brain Computer Interface (BCI) have developed applications to identify different degrees of cortical activation in different circumstances in humans. This study implemented a BCI system for the analysis of neurological biosignals for studies in Neuropsychology. The acquired information used OpenBCI hardware elements and software to visualize in real time the brain electrical activity set in voltage and frequency parameters. The web application developed allowed visual monitoring of the brain electrical activity of each electrode, the different frequency bands, the averages between cerebral hemispheres and the activation of a servomotor. The distribution of the channels made it possible to obtain the Theta, Alpha, Beta and Gamma brain rhythms in alert and relaxed states with eyes open as well as closed.
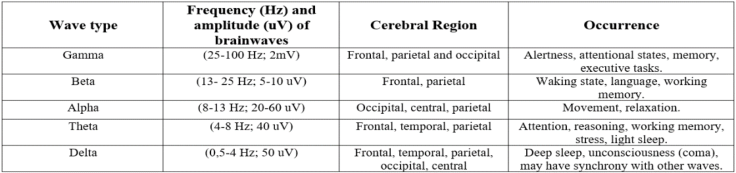
The different scientific potentials and the use of technological resources have provided valuable information in the field of neuropsychology. Some authors claim that limiting the use of technologies in neurorehabilitation could represent a serious case of negligence (Bruna et al. 2011). Electroencephalography or EEG is a non-invasive method that has different bands (figure 1) defined in frequency: Gamma (ɣ), Beta (β), Alpha (α), Theta (θ), Delta (δ) waves can be measured in Hertz (Hz) and are interpreted as the number of oscillations of the wave per second, on the other hand, the amplitude is measured in millivolts (uV) and microvolts (mV) (Lu and Hu, 2019). The signals captured by the electrodes are believed to correspond to the synchronous activation of approximately 10000 to 50000 neurons, the types of frequency and amplitude of brain waves have been widely used as methods and indicators of assessment, correction, rehabilitation, and stimulation (Li et al. 2020).
Given the relevance of EEG in the field of neurosciences, a low-cost system for biosignals acquisition, processing and output of the BCI system was implemented. For the first stage, Python establishes the connection between the serial port and the Cyton acquisition board (OpenBCI, 2021), Matlab instead receives the signals in real time, and they can be processed with the application of filters, using Fast Fourier Transform (FFT) and Wavelets functions it was possible to obtain the signals in the time and frequency domains. The output of the BCI system allows the use of filters to remove artifacts and signals. In addition, time, frequency, frequency bands, averages and buttons for all channels including for the activation of the MG90S servomotor. The system has been experimentally tested on ten university students. In alert and relaxed states with eyes open and closed, among the results the presence of Beta rhythm in alert states and Alpha in relaxed states was identified. Servomotor activation requires voluntary winks identified in data processing.
Intelligent Human Systems Integration (IHSI 2022): Integrating People and Intelligent Systems https://openaccess.cms-conferences.org/#/publications/book/978-1-7923-8988-7
ELECTROENCEPHALOGRAPHY IN NEUROPSYCHOLOGY EEG has been widely studied, for example, different types of brain activity have been demonstrated in different conditions such as cognitive impairment (Sharma et al. 2019), attention deficit hyperactivity disorder (ADHD) (Solovieva et al. 2016), or in standardized tests such as the Montreal Cognitive Assessment (MoCA) (Zeng et al. 2017), etc.
Figure 1: Main brain rhythms, frequency and amplitude ranges of waves, brain regions and occurrence. (Adapted from Abhang, P., Gawali, B. and Mehrotra, S., 2016) The study of the basis of the brain and behavior is currently the subject of neuropsychology. Alexander Luria proposed the theory of functional units. The first unit, known as the most primitive, is in charge of regulating vital functions mediated by subcortical structures. The second unit is responsible for obtaining, processing and storing information: the temporal, parietal and occipital lobes contribute to the perception and interpretation of the world in general. The third functional unit, corresponding to the frontal lobe, is responsible for planning, regulating and verifying human behavior (Luria, 1989).
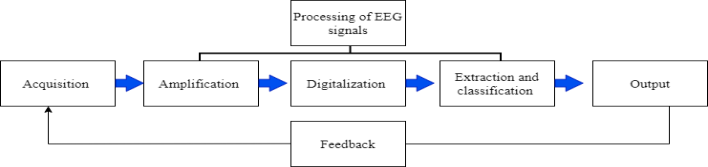
SYSTEM DESCRIPTION AND DEVELOPMENT Basically, a BCI system consists of tree fundamental stages (see figure 2). The acquisition stage represents the bioelectric potentials that are detected through the electrodes. The processing stage involves filtering, amplification, digitization, feature extraction and classification of the EEG signals to eliminate possible artifacts. Finally, the output stage allows observing the biosignals or transforming them to generate control commands.
Figure 2: Structure of a BCI system.
Intelligent Human Systems Integration (IHSI 2022): Integrating People and Intelligent Systems https://openaccess.cms-conferences.org/#/publications/book/978-1-7923-8988-7
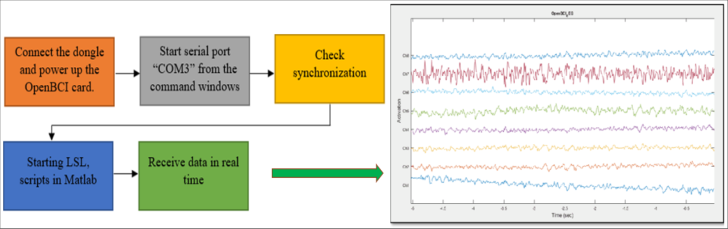
HARDWARE AND SOFTWARE ELEMENTS For the first stage of EEG signal acquisition, the open source "Ultracortex Mark IV" helmet and the eight-channel Cyton Biosensing board from OpenBCI were used (OpenBCI, 2021). Lab Streaming Layer (LSL) used to obtain the signals; to synchronize and save the data obtained in the log Python established the connection between the serial port and the Cyton acquisition board, Matlab instead used scripts to receive the data in real time (see figure 3).
Figure 3: Schematic diagram of the signal acquisition process.
At this stage, filtering techniques must be used to remove unwanted signals such as muscle movements. In Matlab, it was programmed to first apply a low pass filtering, followed by a high pass filtering called Butterworth. In addition, a Notch filter with cut-off frequencies of 58-60 Hz is applied to remove artifacts that may interfere with the signal.
Frequency and time domain analysis For the extraction of the time-frequency bands, the Wavelet transform of type "db8" provides a representation showing the energy distribution of the EEG signal in time and frequency. The Wavelet procedure consisted of decomposing the analyzed signal into two signals, the first called approximation (A1) and the other called detail (D1); then the approximation signal is further decomposed into two other signals (A2) (D2), and so on with each signal.
The algorithm developed in Matlab and the Fast Fourier Transform (FFT) were applied to detect which brain waves predominate in the eight EEG channels, the detection of artifacts, the application of filters and the extraction of the five frequency bands.
Output: Software Implementation
Intelligent Human Systems Integration (IHSI 2022): Integrating People and Intelligent Systems https://openaccess.cms-conferences.org/#/publications/book/978-1-7923-8988-7
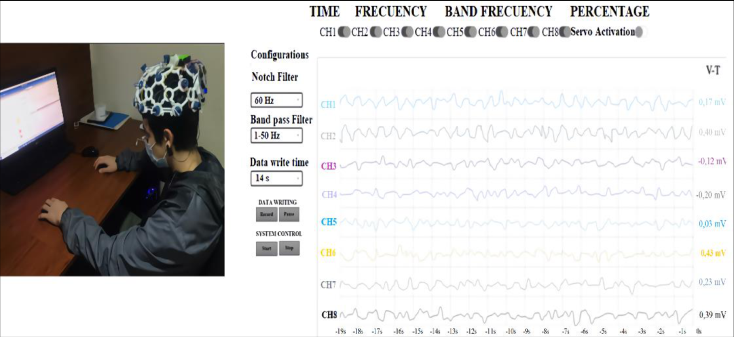
The output of this BCI system is presented in the web application, the EEG signal obtained on the brain activity in real time can be visualized through the eight available channels. The creation of the web application used a JavaScript package called "full stack MEAN", this programming uses AngularJS for the structure, formatting and functionality that is, it is the basis of the graphical part of the application as shown in figure 4.
Figure 4: Web page of the system running with a participant, Tabs shown for time, frequency, frequency bands and percentages for each cerebral hemisphere. Buttons enable or disable channels, including the servomotor, also allowing configuration management for the use of filters, times and buttons for data logging and system control.
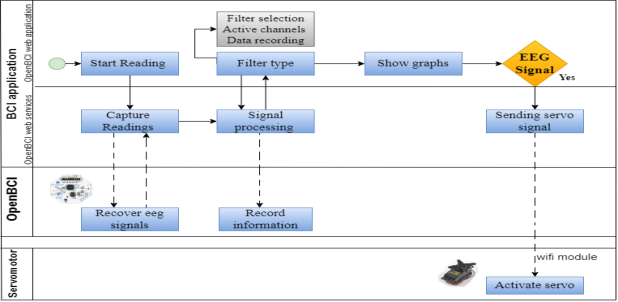
With Node.JS and Express the processing is done by developing general functions: start, read, save, filter data and send. With the start function, the program waits for a command to start or stop the application, and also prepares all subsequent functions. The read function establishes the serial connection between the application and the OpenBCI board. The save function uses arrays of 256 vectors to store the acquired signal data; the filter function makes it possible to process the EEG signals by applying the designed Notch and band-pass filters; finally, the send function uses array packets to send the filtered EEG signal data. The reading of the data is initiated in the application. The start command generates the wireless connection via Bluetooth between the Dongle and the OpenBCI module in charge of processing and sending the data of the signals obtained from the electrodes to the application.
Web services perform data capture processes, send or receive information from the modules, and process the signal. The graphical interface allows observing the graphs of: voltage versus time, voltage versus frequency, brain waves and the average of the signals of the cerebral hemispheres. On the left side of the settings panel, the Notch filter eliminates band and suppresses 50 or 60 Hz frequency. The Butterworth band-pass filter allows selecting the following settings: (1-50 Hz, 7-13 Hz, 15-50 Hz, 5-50 Hz) (see figure 4).
Intelligent Human Systems Integration (IHSI 2022): Integrating People and Intelligent Systems https://openaccess.cms-conferences.org/#/publications/book/978-1-7923-8988-7
The system gives us the option to record from 24 seconds to 24 hours. The data or signals can be watched by time with the start button, we can stop and pause the recordings. The board allows reading, transmitting and writing data that can be stored on a MicroSD card that is located in the OpenBCI card slot. There are five tabs, the time tab shows a graph, where the Y-axis represents voltage values in microvolts and the X-axis shows frequency values in Hz. Each electrode signal is in a different color, and each channel can be turned on or off with the different switches (see figure 4).
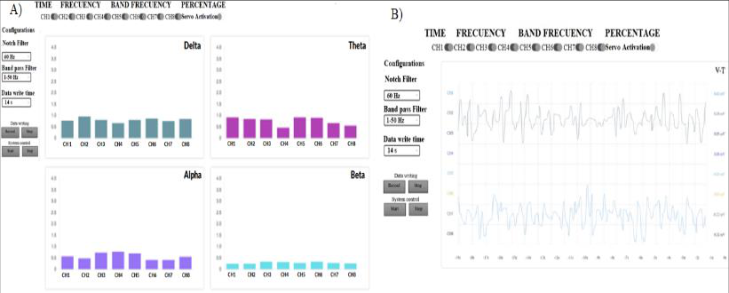
Figure 5: Web application block diagram In frequency bands, bar graphs are observed that vary according to the values obtained in the frequency ranges of each channel of the system. In addition, levels of attention, concentration, relaxation, among other aspects that are implicit within these bands can be deduced. In the tab averages of the signals of each brain hemisphere, this is used to perform different types of analysis. Since each hemisphere is responsible for different functions either, cognitive or behavioral (see figure 6).Figure 6: A) Band frequency tab. B) Average hemisphere tab: the light blue signal represents the right hemisphere and the dark blue signal represents the left hemisphere.
Intelligent Human Systems Integration (IHSI 2022): Integrating People and Intelligent Systems https://openaccess.cms-conferences.org/#/publications/book/978-1-7923-8988-7
TESTING AND EVALUATION OF RESULTS
METHODS
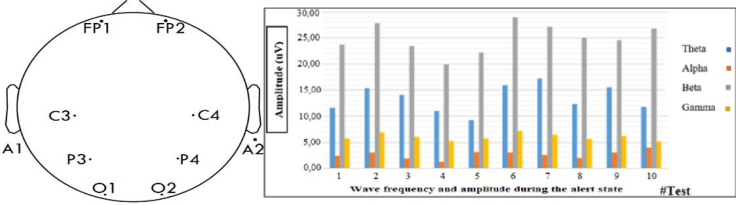
An experimental study was conducted in a group of ten (n=10) healthy university students aged between 19 and 22, from the city of Cuenca, Ecuador. The sample was selected by convenience through non-probabilistic sampling. Eight electrodes were distributed at the frontopolar (FP), central (C), parietal (P), occipital (O) levels, according to the international 10-20 system. The channels were placed as follows (see figure 7): Channel 1: (Fp1), Channel 2 (Fp2), Channel 3: (C3), Channel 4 (C4), Channel 5: (P3), Channel 6 (P4), Channel 7: (O1), Channel 8 (O2), References: (A1), (A2). Each test lasted five minutes and was performed at a sampling rate of 250 Hz to test the relationship between frequency and amplitude of brain waves in the alert and relaxed states.
RESULTS
It was determined that in the alert states with the eyes open, the Alpha and Beta waves presented a sinusoidal morphology. The Gamma waves showed irregular shapes, and the Delta rhythm was not present in the recordings. Included in the main results it was found that of the 100% of the wave types present in the tests, Alpha waves were observed in 70%, Beta in 25%, Theta and Gamma in 5% (see figure 7). When comparing Alpha and Beta, it was observed that during the state of relaxation with eyes closed, the Alpha rhythm increases in the occipital sectors O1, O2, while in the state of alertness the Beta rhythm predominates, with greater impact on the C2, C3, P3, P4 channels. The different types of brain rhythms depend on the state of the participants. The Alpha rhythm was present in the states of alertness and relaxation with closed eyes, it was found that in the states of relaxation this type of waves are slower and of smaller amplitude, while in states of alertness the amplitude of the wave increases.
Figure 7: A) Electrode positioning. B) Frequency and amplitude of waves during the alert state.
The evoked potentials, being variable in shape, time and amplitude, it was not possible to obtain a stable control signal for the OpenBCI system; however, it was possible to demonstrate that in the voluntary wink produced in the frontal sectors Fp1 and Fp2 signals
Intelligent Human Systems Integration (IHSI 2022): Integrating People and Intelligent Systems https://openaccess.cms-conferences.org/#/publications/book/978-1-7923-8988-7 of higher amplitude are obtained, which have been used as command signal for the servomotor. Ten tests were performed with one participant to detect and define the ranges for a fixed output command, 28 and 42 uV are required for activation. These values will change for each person as brain activity is different for each subject.
CONCLUSIONS
With the implementation and analysis, it was possible to visualize the presence of the five types of brain waves in time, frequency, frequency bands of each channel, the averages of the signals of each cerebral hemisphere and the activation of the servomotor, the use of the FFT and the Wavelets Transform allowed the separation of the brain waves: Delta, Theta, Alpha, Beta and Gamma. Signal processing provided the opportunity to find a greater amplitude of the waves of the frontal electrodes Fp1, Fp2, and the predominance of Beta waves in the alert states. The system is easy to use. Recordings can be correlated with cognitive functions, although it is necessary to computerize the tasks to prevent biological or external elements, such as muscle activity, from interfering with the recording.
REFERENCES
Abhang, P., Gawali, B. and Mehrotra. (2016) “Technological Basics of EEG Recording and Operation of Apparatus” In: Introduction to EEG- and Speech-Based Emotion Recognition, pp. 19-50. United States: Academic Press. Junqué, C. (2011) “Técnicas de neuroimagen en neuropsicología clínica y rehabilitación neuropsicológica” In: Rehabilitación neuropsicológica Intervención y práctica clínica, Bruna, et al. (Ed.). pp. 15-27. Barcelona: Elsevier. Li, Z. et al (2020) “Demystifying signal processing techniques to extract resting-state EEG
features for psychologists”. Brain Science Advances. 6 (3), pp. 189-209. Lu, X., Hu, L. (2019) “Electroencephalography, Evoked Potentials, and Event-Related Potentials”. In: EEG Signal processing and Feature Extraction, Hu, Zhang (Ed.). pp. 23-42. Singapore: Springer. Luria, A. (1989) El cerebro en acción. México: Ediciones Roca. OpenBCI (2021). Ultracortex Mark IV. Available in: https://docs.openbci.com/AddOns/Headwear/MarkIV/ OpenBCI (2021). Cyton Biosensing Board (8-channels). Available in: https://docs.openbci.com/Cyton/CytonLanding/ Sharma, N. et al. (2019) “EEG and Cognitive Biomarkers Based Mild Cognitive Impairment
Diagnosis”, IRBM, 40(2), pp.113–121. Solovieva, et al. (2016) “Neuropsychology and electroencephalography to study attention deficit hyperactivity disorder”, Revista de La Facultad de Medicina, 64(3), pp.427-434. Zeng, Q. et al. (2017) “Cognitive impairment in Chinese IIDDs revealed by MoCA and
P300”, Multiple Sclerosis and Related Disorders, 16, pp. 1–7.
Intelligent Human Systems Integration (IHSI 2022): Integrating People and Intelligent Systems https://openaccess.cms-conferences.org/#/publications/book/978-1-7923-8988-7
LISTED IN THE AHFE DIGITAL BOOKSTORE CATALOGUE
Explore the complete digital volume
Intelligent Human Systems Integration (IHSI 2022): Integrating People and Intelligent Systems
Read this individual research paper free through the original publisher, or explore the full digital proceedings book.
ISBN 978-1-7923-8988-7
Explore this ISBN in the AHFE Bookstore ↗Listed in the July 2026 bookstore catalogue; search by ISBN to confirm current availability · Digital book purchase optional