Ziyu Yao, Xiaozhou Zhou, Jichen Han, Hao Qin, Hanyang Xu (2022). The mapping relationship between PERCLOS and work fatigue: a correlation verification experiment based on radial basis function neural network. In: Intelligent Human Systems Integration (IHSI 2022): Integrating People and Intelligent Systems. AHFE Open Access, vol. 22. https://doi.org/10.54941/ahfe1001082
Work fatigue is one of the main causes of accidents. The main purpose of this article is to discuss the mapping relationship between eyelid closure data and human fatigue at work through confirmatory experiments, and the applicability of composite eye movement parameter analysis based on the random forest neural network model for fatigue detection in specific tasks . A total of 16 subjects were recruited in this experiment. The performance of the subjects was obtained by the improved measurement method of the number of cancellation symbols, and the reaction time of the subjects was obtained by the two-point click reaction time measurement method. The obtained performance and response time data are used to reflect the fatigue degree of the subjects, and the Diskablis eye tracker is used to record the eye movement parameters of the subjects. Finally, it was found that PERCLOS and the two-point click response time had a correlation with fatigue status in time sequence, and there was a more potential relationship between other performance parameters and fatigue. The comprehensive eye movement parameter analysis based on the random forest neural network model has also been confirmed to have high usability in fatigue detection.
Fatigue accounts for a large part of the accident factors caused by human error. Under the influence of fatigue, some body tissues and organs may not be able to maintain optimal physical performance. People's further work or exercise will cause this phenomenon to become more serious, the maximum cognitive performance will be temporarily reduced, and it may even develop into symptoms such as distracted attention and drowsiness, which will affect people's work to varying degrees.
Fatigue driving is the main cause of accidents, and timely detection and suppression of fatigue is the key to reducing accidents (Hu and Lin, 2018). From the cycle of fatigue, fatigue can be divided into sudden fatigue and chronic fatigue, and some scholars have confirmed in research that these two kinds of fatigue are two different and independent fatigue phenomena. Among them, acute fatigue can be compensated after a certain period of rest, so that various indicators and states of the pilot can be restored to the state before fatigue. Caldwell (2001) emphasized the importance of measures such as short breaks, environmental interference measures and other crew alternate work in controlling fatigue effects in his research. These measures will significantly improve the efficiency and safety of aerial operations.
Compared with the fatigue detection method of the subjective scale, the objective parameter measurement method can analyze the fatigue degree reflected by the physiological indicators and behavior characteristics based on the corresponding theoretical basis. Known physiological parameters related to fatigue include brain electricity, electrocardiogram, eye movement parameters, etc., of which eye movement parameters are less invasive and more applicable. In the study of the correlation between eye movement parameters and fatigue, commonly used real-time eye movement indicators include blink duration, blink frequency, gaze duration, gaze rate, pupil diameter, saccade amplitude, and saccade path, etc. (Greef et al. 2009)
Intelligent Human Systems Integration (IHSI 2022): Integrating People and Intelligent Systems https://openaccess.cms-conferences.org/#/publications/book/978-1-7923-8988-7
(Van et al. 2000) (Wilson, 2002). Relevant literature proves that PERCLOS, the time occupied by a certain percentage of eyes closed per unit time, has the highest correlation with fatigue (Laouz et al. 2020). Among P70, P80, and EM, P80 (the time the pupil is covered by the eyelid longitudinally for at least 80% of the time) has the best correlation with the degree of driving fatigue, and it can best reflect the degree of fatigue of the person.
To facilitate research, it is defined as "work fatigue", that is, a comprehensive fatigue phenomenon generated and accumulated due to the impact of task load and various environmental factors during a specific task process. This fatigue can lead to reduced task performance, reduced cognitive ability, distracted attention and even drowsiness in a limited unit of time. This experiment will discuss the mapping relationship between PERCLOS indicators, performance indicators and fatigue levels of the subjects by establishing an experimental environment and designing specific experimental tasks. At the same time, the sampling rate of PERCLOS was optimized, and the usability of the random forest neural network model in this research was explored.
METHODS
Experimental Design In this experiment, 16 subjects were recruited, with an average age of 26 years old. All subjects were industrial design graduate students and creative workers who graduated from art colleges. All subjects had normal vision or corrected vision. Participants in the formal experiment will undergo a 5-day follow-up experiment. For the first three days, each participant will conduct an experiment every morning, midnight and evening under normal work and rest. After an interval of one day, the subjects participated in a com-prehensive activity lasting 8 hours on the fifth day, and conducted a formal experiment in the morning, midnight and evening, and subjectively reacted to fatigue after the entire day of activity.
(1) Performance measurement: the number of cancellation symbols measurement meth-od The experimental paradigm used in the task performance in the experimental task is the number of cancellation symbols measurement method. The paradigm is derived from the fatigue measurement method in the traditional human factors engineering, and it has been digitally improved according to the characteristics of this research, and the function of making the material appear highly random is strengthened. In each round of the experiment, five types of 225 icons (45 of each icon) will appear on the screen in a random order. Participants are told to find and find all icons of a certain kind as soon as possible. According to different experimental requirements, the time taken to correctly find and click all target icons and the number of correct clicks per
Intelligent Human Systems Integration (IHSI 2022): Integrating People and Intelligent Systems https://openaccess.cms-conferences.org/#/publications/book/978-1-7923-8988-7 unit time are used as output indicators. Under this experimental paradigm, the subjects need to go through a process of search, identification and physical reaction. The performance of the experiment process is subject to the comprehensive state of the subjects' physical and mental power, so the output indicators can be used to reflect work fatigue.
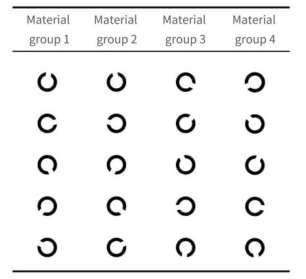
Based on Zhou’s (2017) experimental research, the materials used in the experiment are shown in Fig.1. The materials are four sets of graphics groups with similar complexity. Each set of materials contains five notched rings. The openings of each notched ring are spaced by 72° in turn, and all opening directions are as far away as possible from the orthogonal direction. After calculation, when the upward opening and the x-axis direction are 9°, the above conditions are met. After the material group 1 is mirrored in the horizontal and vertical directions, the split rings of material group 2, material group 3 and material group 4 are derived.
Figure 1. Experimental materials used in the number of cancellation symbols (2) Reaction time measurement: two-point click reaction time measurement method
In the follow-up experiments, the two-point click response method that conforms to the Fitts experimental paradigm is selected as an auxiliary method to reflect the fatigue state of the subjects after a unit time of task load.
Two circular buttons will appear on the screen in the measurement experiment scene when the reaction is clicked at two points. The sizes, colors, spacing and appearance positions of the two buttons A and B are the same. Participants need to perform a round of three clicks in the order from A to B and then to A. The program will record the interval time between the two sets of clicks from A to B and from B to A, and calculate the time between the two clicks. The average value is used as the output index.
(3) Obtaining eye movement data In the experiment, the subjects performed the experiment while wearing a Diskablis
Intelligent Human Systems Integration (IHSI 2022): Integrating People and Intelligent Systems https://openaccess.cms-conferences.org/#/publications/book/978-1-7923-8988-7 eye tracker. The parameters in the process were recorded, and their saccade distance, saccade time, and forward-looking image were recorded, while the derived data was retained for subsequent research. The calculation formula of PERCLOS is as follows:
Equation reproduced from the original PDF.
PERCLOSP80= (3) Among them, dmax is the maximum distance of eyelid closure per unit time, and dmin is the minimum distance of eyelid closure per unit time. di is the distance between the upper and lower eyelids at time i, and Pi is the closed eye state at time i. When di >dclose, Pi=1, which means that the current subject is recognized as the closed eye state. Conversely, when di<dclose, Pi=0, and the subject is in the state of non-closed eyes. Ti is the total number of sampling time points in a round of experiment. The total number of sampling points in the closed eye state of the subjects in a unit time divided by Ti can be regarded as the percentage of the time that the eyes are closed in the unit time, that is, the eyelid closure percentage PERCLOS.
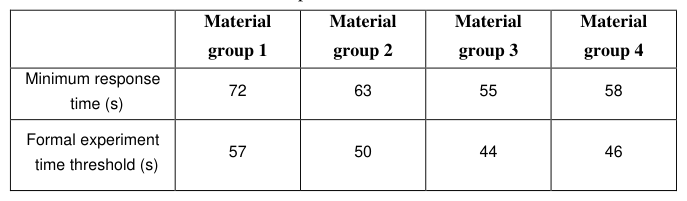
Formal experiment As shown in Table 1, 80% of the minimum reaction time of each group of experimental materials is used as the time threshold corresponding to the formal experimental link to ensure the length and rhythm of the experiment. Participants will conduct the experiment without being informed of the progress of the experiment and the time limit of each round of the experiment. Each round of the experiment may end unexpectedly by the subjects, jump to the two-point click reaction test, and then enter the next round of the test scenario of the number of cancellation symbols.
Table 1. The minimum reaction time of each group of experimental materials and the formal experimental time threshold.
Intelligent Human Systems Integration (IHSI 2022): Integrating People and Intelligent Systems https://openaccess.cms-conferences.org/#/publications/book/978-1-7923-8988-7
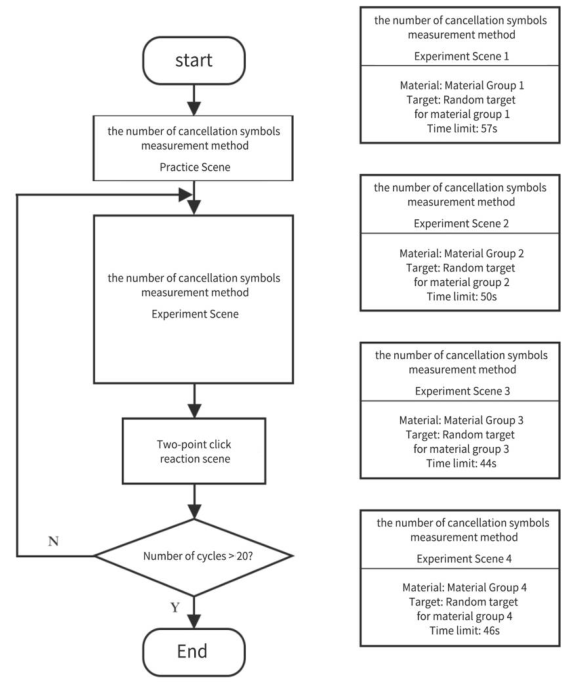
Figure 2. Formal experiment process
The method for determining the number of write-off symbols in this experiment will use the aforementioned four sets of materials for 80 rounds of experiments, of which each set of materials will be used 20 times. The experimental process of the formal experiment is shown in Fig.2. After each round of the number of cancellation symbols, there will be a two-point click response time measurement method, and the elimination of visual residual time for all experimental scenes is one second.
RESULTS
This article adopts Office's VB macro script and Matlab programming method to realize automatic processing. Under normal circumstances, the distance between the upper and lower eyelids detected by the SDK for most subjects will not be less than
Intelligent Human Systems Integration (IHSI 2022): Integrating People and Intelligent Systems https://openaccess.cms-conferences.org/#/publications/book/978-1-7923-8988-7
9, so the blank data and the invalid data whose eyelid distance is less than 9 are set to zero. At the same time, the data whose left and right eyelid distances are both non- zero are aver-aged as a quantified upper and lower eyelid distance index.
The preliminary data processing stage needs to organize the original data into a form that can be used for further analysis according to a specific data structure. This stage is mainly divided into the following steps:
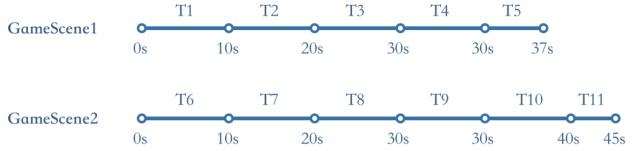
Figure 3. PERCLOS data sampling rules
Record the total number of frames and CloseCnt in each sampling period respectively and obtain the PERCLOS value by calculating the percentage of the number of eyelid closed frames to the total number of frames per unit time. When PERCLOS is greater than 5.8% (that is, when the eyelid closure time is greater than 3.5s/min), it is judged as fatigue (isFatigue=1), otherwise it is non-fatigue (isFatigue=0).
Taking the sampling period as the benchmark, the performance data and the eye movement data are matched in sequence. It is known that each subject will go through several rounds of experiments. One round of experiment is recorded by a data object, and each sampling period produces one data element. For example, GameScene1 shown in Fig.3, this round of experiment will produce a total of 5 data elements. In addition, each data element contains 8 data items including PERCLOS, PERCLOS- based fatigue status (isFatigue), closed-eye frame count (CloseCnt), two-point click response time (2pClickTime), The total number of clicks (ClickCnt), correct clicks (CorrectClick) and correct click rate (ClickRate) of the cancellation symbol number measurement method. Since the two-point click reaction time, the total number of clicks, the number of correct clicks and the sampling period of the correct click rate of the measurement method of canceling the number of symbols are the total experimental time of each round of the experiment (as shown in Table 3). Therefore, in the data structure, there is a one-to-many mapping relationship between the four performance parameters and the two eye movement parameters and the fatigue state.
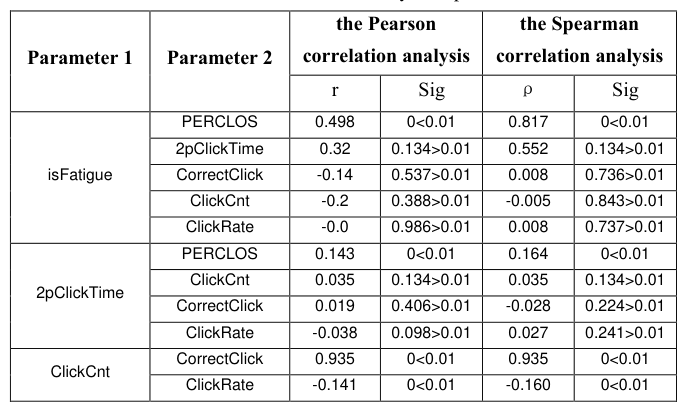
After completing the preliminary data processing, use the Pearson correlation analysis function and the Spearman correlation analysis function in SPSS to analyze the degree of linear correlation between the variables. The correlation is shown in Table 2.
Intelligent Human Systems Integration (IHSI 2022): Integrating People and Intelligent Systems https://openaccess.cms-conferences.org/#/publications/book/978-1-7923-8988-7
Table 2. Pearson correlation analysis of parameters.
Through further analysis, it can be concluded that the fatigue state and the two-point click reaction show a moderately non-linear relationship in time sequence, and the performance data of the number of cancellation symbols shows a very weak or irrelevant non-linear relationship. Therefore, the radial basis function neural network needs to be used in the next step to analyze the degree of influence of eye movement data and performance data on PERCLOS-based fatigue on time series changes.
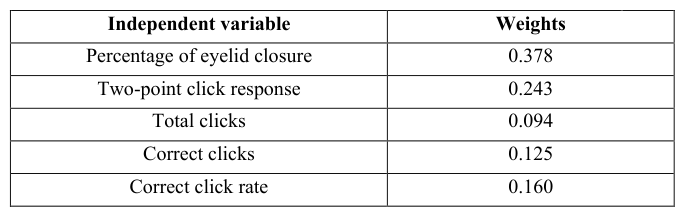
Use SPSS's own radial basis function neural network to analyze the above data. When configuring the neural network, PERCLOS and TwoPointClickTime are used as input layer factors. The total clicks (ClickCnt), the click rate (ClickRate) and the correct clicks (CorrectClick) were used as the input layer covariates, and the PEFCLOS- based fatigue status was used as the output layer dependent variables. In addition, 70% of the total data is used as the training set, and the remaining 30% is used as the test set.
Table 3. The Weights of Independent Variables in the Classification Process of Radial Basis Function Neural Network.
Intelligent Human Systems Integration (IHSI 2022): Integrating People and Intelligent Systems https://openaccess.cms-conferences.org/#/publications/book/978-1-7923-8988-7
The analysis results of the radial basis function are shown in Table 3. The results show that the overall accuracy of the neural network prediction of the test set reaches 74.2%.
The random forest neural network model is deployed in the Matlab program. The fatigue state based on PEFCLOS is used as the dependent variable of the output layer. In addition, 70% of the total data is used as the training set, and the remaining 30% is imported into the data processing program as the test set data. The total number of samples in the data object is 1863, the number of samples in the training set is 1300, and the number of samples in the test set is 563. The analysis results show that in the test set, the random forest neural network model classifies 153 samples as non- fatigue, the number of misjudgment samples is 4, and the correct rate of non-fatigue classification is 97.45%. The remaining 339 samples were classified as fatigue, the number of misjudgment samples was 1, and the accuracy rate of fatigue classification was 99.70%.
DISCUSSION
he experimental results show that PERCLOS and two-point click reaction are related to fatigue status in time sequence, and there is a more potential relationship between other performance parameters and fatigue. At the same time, the research results show that the random forest model has high usability and processing performance on fatigue parameter classification problems under specific tasks, and the neural network has significant self-optimization ability in the application process. With the increase in the number of samples and the adjustment of the PERCLOS sampling rate, the classification accuracy of the neural network can be infinitely close to 100%.
Furthermore, the feasibility of compound eye movement parameter analysis based on stochastic forest neural network model for fatigue degree detection in specific tasks is verified.
Unlike traditional fatigue research, this study did not focus on single variable in the study of traditional threshold but using the black box of neural network model to de- scribe the fatigue with the emergence of the specific task for relatively macroscopic and don't have the change regularity and effectively describe the fatigue and eye movement potential mapping relation between the parameters, performance parameters.
In the practical application and future research may follow the train of thought and steps of the present study on the specific people in specific tasks for training the neural network model of random forests, and the optimization of the model for further, make its have better learning ability, should be applied to the corresponding specific task environment.
Intelligent Human Systems Integration (IHSI 2022): Integrating People and Intelligent Systems https://openaccess.cms-conferences.org/#/publications/book/978-1-7923-8988-7
REFERENCES
Caldwell, J. A. (2001). The impact of fatigue in air medical and other types of operations: a review of fatigue facts and potential countermeasures. Air Medical Journal, 20(1), 25-32. de Greef, T., Lafeber, H., van Oostendorp, H., & Lindenberg, J. (2009, July). Eye
movement as indicators of mental workload to trigger adaptive automation. In International Conference on Foundations of Augmented Cognition (pp. 219- 228). Springer, Berlin, Heidelberg. Hu, S., & Lin, Z. (2018, August). Fatigue driving detection based on machine learning and image processing technology. In Journal of Physics: Conference Series (Vol. 1069, No. 1, p. 012179). Laouz, H., Ayad, S., & Terrissa, L. S. (2020, June). Literature Review on Driver’s
Drowsiness and Fatigue Detection. In 2020 International Conference on Intelligent Systems and Computer Vision (ISCV) (pp. 1-7). IEEE. Van Orden, K. F., Jung, T. P., & Makeig, S. (2000). Combined eye activity measures accurately estimate changes in sustained visual task performance. Biological psychology, 52(3), 221-240. Wilson, G. F. (2002). An analysis of mental workload in pilots during flight using
multiple psychophysiological measures. The International Journal of Aviation Psychology, 12(1), 3-18. Zhou, X., Xue, C., Zhou, L., & Zhang, J. (2017). Influence of Spatial Information for the Representation of Temporal Order Information. In Transdisciplinary Engineering: A Paradigm Shift (pp. 402-409). IOS Press.
Intelligent Human Systems Integration (IHSI 2022): Integrating People and Intelligent Systems https://openaccess.cms-conferences.org/#/publications/book/978-1-7923-8988-7
LISTED IN THE AHFE DIGITAL BOOKSTORE CATALOGUE
Explore the complete digital volume
Intelligent Human Systems Integration (IHSI 2022): Integrating People and Intelligent Systems
Read this individual research paper free through the original publisher, or explore the full digital proceedings book.
ISBN 978-1-7923-8988-7
Explore this ISBN in the AHFE Bookstore ↗Listed in the July 2026 bookstore catalogue; search by ISBN to confirm current availability · Digital book purchase optional