Diego Vallejo-Huanga, Alisson Mendoza, Nicolás Carrasco (2021). Sentiment Analysis in Contrast to Official Data During the COVID-19 Pandemic in Ecuador. In: Human Systems Engineering and Design (IHSED2021): Future Trends and Applications. AHFE Open Access, vol. 21. https://doi.org/10.54941/ahfe1001168
Ecuador was one of the first Latin American countries to have a proven case of the new coronavirus SARS-CoV-2. The social networks were the media most used by citizens to replicate news about the pandemic, and issue comments about the handling of the health crisis. This article aims to present a web tool for sentiment analysis on Twitter with three different ways to analyze the corpus and polarities: a word-dictionary-based model, a custom trained supervised machine learning model, and an open-source library to process textual data and allows obtaining a polarity metric from a tweet. Then, to define the final polarity of each tweet, an ensemble machine learning model is used for combining the predictions from the three techniques through a hard majority voting ensemble. The web system was developed with free software tools and is accompanied by visualizations and statistical graphics.
Human Systems Engineering and Design (IHSED 2021) https://openaccess.cms-conferences.org/#/publications/book/978-1-7923-8987-0
INTRODUCTION
In March 2020, the World Health Organization (WHO) officially declared a pandemic by the SARS-CoV-2 virus that causes the Covid-19 disease (Di Gennaro et al., 2020). The virus originating from Wuhan in the Hubei province in China, until mid-April 2021, has caused around 136 million infections and 2.94 million deaths, worldwide (API, https://covid19api.com/). Due to the rapid spread of the disease and its high contagion rate, many countries closed their borders to prevent the spread of the disease and quarantined citizens, limiting people's daily lives. The new viral disease has caused a paradigm shift in all domains and disciplines, affecting millions of people around the world, directly or indirectly, and the epidemic has become the most serious public health event to affect humanity in the 21st century. Ecuador was one of the first Latin American countries to have a proven case of the new variant of coronavirus on February 26, 2020, in the city of Guayaquil (Luque et al., 2020). The Ecuadorian Government closed its land, air, and maritime borders, and several vehicular and pedestrian traffic restrictions were implemented. However, despite these measures, the number of cases collapsed the hospital infrastructure and overwhelmed the health institutions. In the first days of the pandemic, government agencies warned of the new virus's danger and the Ecuadorian government's lack of knowledge in the new disease's health treatment was highlighted. The official instances published figures of people infected, recovered, and deceased by the SARS-CoV-2 virus that was far from the reality in several cities of the country. Some international media echoed the divergent figures (Luque et al., 2020). In this context, many independent media and the citizens used social networks, especially Twitter, to be able to disseminate catastrophic images of the reality of various cities in the country. Social networks were one of the means of communication most used by citizens to express their feelings, replicate news, issue comments about the handling of the health crisis in Ecuador. The National Institute of Statistics and Censuses of Ecuador (INEC) together with the Civil Registry of Ecuador, published data about the number of new deaths in the country, which showed that there was an under-registration in the number of people who died from the pandemic (Torres and Sacoto, 2020) and this caused many citizens to express their discontent through social networks. On the other hand, sentiment analysis, also known as opinion mining or emotion analysis, is a set of computational techniques that allow us to analyze the polarity and feelings of an opinion, attitude, or comment exposed in a social network, forum, blog, etc. Currently, social media platforms, such as the microblogging Twitter, for example, with more than 300 million monthly users, are of immense importance to people's daily lives due to the breadth of the topics covered. Twitter is an option that researchers recur to for sentiment analysis, due to its privacy policies, versatility of use of its Application Programming Interface (API), and costs associated with data exploitation (Kouloumpis et al., 2011). Worldwide, and due to the ease of exploiting social media data through connection to APIs or web scrapping techniques, some investigations have been developed that analyze sentiment analysis in the context of the pandemic caused by the COVID-19
Human Systems Engineering and Design (IHSED 2021) https://openaccess.cms-conferences.org/#/publications/book/978-1-7923-8987-0
(Barkur and Vibha, 2020) (Samuel et al., 2020). There are several works related to sentiment analysis in the Ecuadorian context. Some of them have been developed as general-purpose tools for sentiment analysis (Utitiaj et al., 2020), others have analyzed the polarity of sentiment in a specific context such as education (Pazmiño et al., 2020), political management (Téran and Mancera, 2019), and the development of mass events (Rivera-Guamán, 2020). After a systematic review of the scientific literature, no web tool has been found that allows the comparison of official pandemic data in contrast to sentiment analysis. This article presents a web tool developed to contrast the official data of the pandemic: people infected, recovered, and dead compared to the comments related to COVID-19, on the social network Twitter, in the same timeline. Our tool analyzes the polarity of the opinions and comments of the tweets issued, in each period, by multiple users of the social network. The information retrieval system is limited to searching for tweets written in Spanish since this is the official language of the country.
MATERIALS AND METHODS
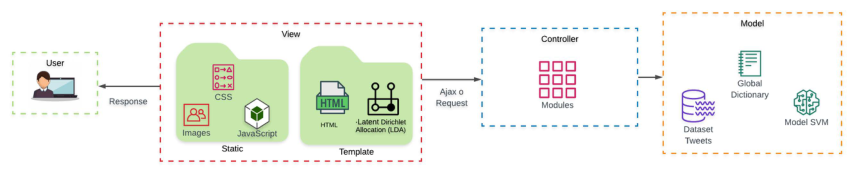
Methodological Scheme Fig. 1 shows a general block diagram of the methodology used in the development of the web tool.
Fig. 1. Block diagram of the methodology for the deployment of the web tool.
Human Systems Engineering and Design (IHSED 2021) https://openaccess.cms-conferences.org/#/publications/book/978-1-7923-8987-0
In the first instance, the web application connects to the Twitter API and downloads the texts of tweets related to COVID-19 (or similar words) in Ecuador. By default, the application can only access public information on Twitter, using the access codes: Consumer Key, Consumer Secret, Access Token, and Access Token Secret. Our tool uses the free potentialities of the API it offers for software developers. The total collection of retrieved tweets Tm, with length m, depends on the restrictions in the request that the user has selected in the graphical interface, i.e., date range or the number of tweets to retrieve. Every tweet ti(i = 1,2, …, m) has a textual corpus of n words in, length since it depends on the user who sent the message. The ti is treated as an independent entity, where its polarity will be analyzed individually, through the study of its corpus. In the linguistic pre-processing of each entity ti, cleaning and normalization operations are carried out, to unify the criteria for the processing of the text contained in each tweet. First, the removal of special characters, punctuation marks, emojis, and handle emoticons was carried out, reducing the length from n a k words. Then, tokenizing the tweet and converting the k extracted tokens (tik), from ti, to lowercase letters were executed. Additionally, on each tweet tokenized the stopwords of the Spanish language are removed, and finally stemming is executed on the tokens, using the Porter algorithm, to eliminate the suffixes and improve the NLP process. For sentiment analysis, our tool uses three different ways to analyze the corpus and polarities of the tweets. The first one uses a word-dictionary-based model, where a set of approximately 4000 tokens was collected in a dictionary D, which includes words with positive polarity dj(+) and negative polarity dj(-), in Spanish and adapted to the Ecuadorian context. In this way, when retrieving a new tweet, the sentiment analysis is carried out, based on the corpus of the tweet and its similarity to the sentiment dictionary. In this first methodology, two similarity metrics were used to define the polarity label of the tweet, Lti which can be positive Lti(+), negative Lti(-), or neutral Lti(±): the Jaccard coefficient and the cosine similarity with TF-IDF. The Jaccard coefficient measures the normalized similarity between two sets, where values close to 0 indicate less similarity between the tweet token tik and the dictionary token dj, while values close to 1 indicate greater similarity, such as shown in the Equation 1. In this sense, if an entity ti has a greater degree of similarity with the positive words dj(+) the polarity label of the tweet is positive Lti(+), otherwise the ti is labeled negative Lti(-). If a token is not contained within D, it will be labeled as neutral.
|𝑡𝑖∩𝐷| 𝐽(𝑡𝑖, 𝐷) = |𝑡𝑖∪𝐷| ; 𝐽∈[0,1] (1)
Then, the label that defines the polarity of the tweet, Lti , is determined by the Equation 2. When the number of positive tokens is equal to the number of negative tokens, the Lti is labeled as neutral Lti(±).
Human Systems Engineering and Design (IHSED 2021) https://openaccess.cms-conferences.org/#/publications/book/978-1-7923-8987-0
The vector cosine method with TF-IDF is processed through a bag of words formed by the dictionary D plus the tokens retrieved from all the tweets tik of the collection Tm. On the bag of words, a TF-IDF weighing process is applied and the divergence with the cosine similarity between the vector of positive words and the vector representing the tweet Ci(+) is calculated. In the same way, the divergence is also measured with the vector of negative words Ci(-). When, Ci(+) > Ci(-) => Lti(+), if Ci(+) < Ci(-) => Lti(-), and if Ci(+) = Ci(-) => Lti(±). The labeling process runs for all vectors of tweets. The second sentiment analysis technique uses a custom trained supervised machine learning model. For the algorithm training, a dataset was created specifically for this task. Around 1500 tweets were downloaded from May 23, 2020, to June 03, 2020, and the sentiments expressed in the corpus were manually labeled as positive, negative, and neutral. The system uses the dataset, with 500 tweets for each class, and a multiclass classifier with the Support Vector Machine algorithm (Cortes, 1995), where 70% of the data were used for training and 30% for the test, randomly. The performance of the model obtained an accuracy of 0.744, precision of 0.742, recall of 0.751, and F1-measure of 0.741. Once the model was validated, it was implemented on the web system so that it can run the sentiment classification task when the user executes a new search and retrieval of a Cm collection of tweets. The third method for sentiment polarity analysis uses an open-source Python library, called TextBlob (Loria, 2020), to process textual data and obtaining a polarity metric. The library is designed to work with text in English, so our tool makes certain adaptations to process text in Spanish. Finally, to define the polarity of each tweet, an ensemble machine learning model is used that combines the predictions from the three techniques through a hard majority voting ensemble. Because there is no empirical evidence of which technique works best, all methods add the same weight to the final decision of polarity Lpol. Additionally, although it is not used for the decision of the polarity of the tweet, the web tool executes a Latent Dirichlet Allocation (LDA) (Blei, 2003) with a visualization of the polarities of the sentiments. The datasets and source code of the application can be consulted at https://github.com/dievalhu/Sentiment_Analysis_COVID19 and the web version of the tool is available in https://analisis-sentimiento.herokuapp.com/ Architecture and Implementation Details
The UML-based Web Engineering (UWE) methodology (De Koch, 2001) is used for the web application development, and the tool is designed under the Model View Controller (MVC) software architecture that separates the data from the application, user interface, and control logic in three different components as shown in Fig. 2. In
Human Systems Engineering and Design (IHSED 2021) https://openaccess.cms-conferences.org/#/publications/book/978-1-7923-8987-0 this way, the backend controls the logical area of the web tool, while the front-end is the section intended for the user that includes the design line and the graphic elements of the web.
Figure 2. Sentiment analysis web tool MVC architecture pattern The Model component contains a representation of the data handled by the system, i.e., the tweets' dataset with manually labeled, the token dictionary for the word- dictionary-based model, and the SVM model trained which is stored in a file SVM.pkl. The View, or user interface, contains the information that is sent to the client and its interaction mechanisms, through two sections. The first one is a Static section that contains all the CSS and JavaScript styles, images and files that make up the web tool. The second section, Templates, store the HTML files of the web and the section that shows the graphics generated by LDA. The Controller is an intermediary between the Model and the View, managing its flow of information and the transformations to adapt the data, and is divided by the modules: API COVID-19 connection, Jaccard coefficient, calculation of Cosine similarity with TF-IDF, writing and reading of plain text files (.csv and .txt), SVM algorithm, Textblob library, topic modeling, text tweets retrieval, ensemble algorithm of voting, pre-processing of the texts with NLP and the main one called Processes which controls all the previous modules and executes them one by one. Our web application uses Python 3.8 in the MVC architecture so that the Controller's machine learning algorithms are executed together with the data extracted from the Model and thus send the results to the View. The web application was developed with the Flask framework.
WEB TOOL DESCRIPTION AND EVALUATION The front-end of our web tool is designed so that the flow of information and requests to the back-end services are executed in a transparent way to the user. Thus, the tool starts its process by clicking on Search, where the request is made to the server through the Ajax library, which processes the request to the server in the background. The server processes the request and returns the tweets extracted from the API, with their metadata. After the data has been received, the open-source JQuery JavaScript library is used so that the Document Object Model (DOM) has a great ease of inject- ing data where it is needed. The DOM works both for the modules found in the Controller and for their interactive graphical representation employing the Highcharts
Human Systems Engineering and Design (IHSED 2021) https://openaccess.cms-conferences.org/#/publications/book/978-1-7923-8987-0
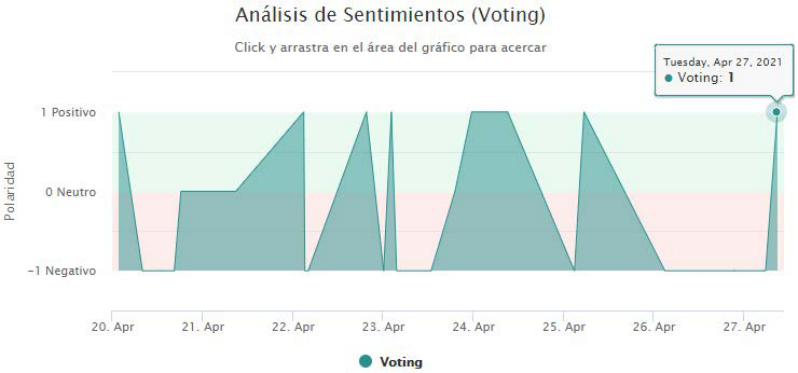
JavaScript library. The Bootstrap framework was used that create the web interfaces with CSS and JavaScript and uses the design and development technique, web responsive. The graphical interface of the web tool has three sections. The first section configures the temporal and quantitative parameters for the connection with the Twitter API: # Tweets: number of tweets to be retrieved from the API; Start Date: initial date of retrieval of tweets, and End Date: final date of retrieval of tweets. The second section runs the Artificial Intelligence models to find the polarity of the tweets together with statistical graphs of the results and is made up of three tabs: Sentiment Analysis: summary table with the percentages of positive, negative, and neutral tweets for each method of sentiment analysis; Statistical Graphs: percentage graphs of the results of the sentiment analysis algorithms, Tweets: table with the cor- pus of retrieved tweets, each one with its date and sentiment polarity labeling. The third section, called visualization, contains the tabs: Word Cloud: representa-tion of the most recurring words in the tweets extracted from the API in the form of a word cloud; LDA: an interactive visual representation of the LDA model; Covid-19 Vs. Sentiments: graphs of the sentiment analysis with each method (see Fig. 3), where the timeline is located on the abscissa axis and the sentiment polarity on the ordinate: positive (1), negative (-1), or neutral (0).
Figure 3. Sentiment analysis with hard majority voting ensemble method from April 20,
2021, to April 27, 2021
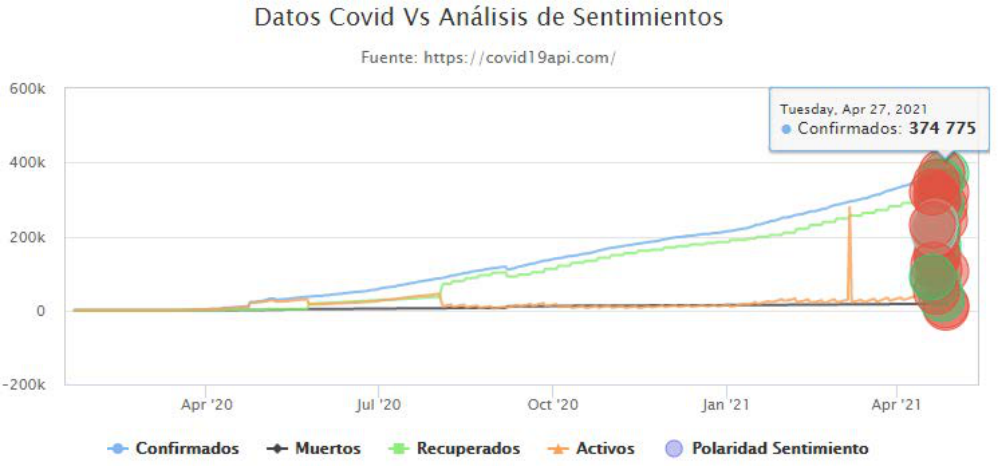
Additionally, in the Covid-19 Vs. Sentiments tab, on the same timeline, the data collected from (API, https://covid19api.com/) and extracted since the beginning of the pandemic about people dead, recovered, confirmed, and active by COVID-19 are graphed versus the overall result of the sentiment analysis. Thus, the tool allows to monitor the progress of the COVID-19 pandemic in Ecuador and counteract this data with the generalized sentiments of the population on Twitter, as shown in Fig. 4.
Human Systems Engineering and Design (IHSED 2021) https://openaccess.cms-conferences.org/#/publications/book/978-1-7923-8987-0
Figure 4. Timeline of the official pandemic data (people confirmed, dead, recovered, and active) and the result of the sentiment analysis from April 2020 to April 2021, in Ecuador.
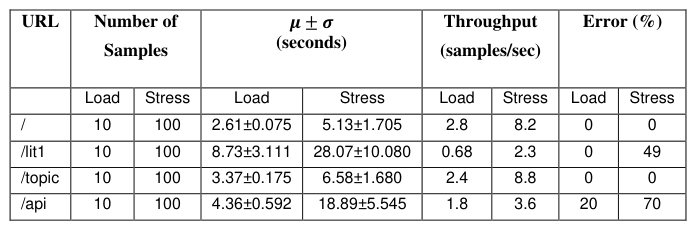
Finally, stress and load tests of the web tool have been carried out, to know its behavior with specific numbers of users, the limits of the hosting provider, the rate of increase on the web's services until its breaking point, and possible failures of the web tool. The performance was monitored with the open-source tool JMeter, developed in Java, which allows us to perform functional behavior tests and performance measurement of our web tool hosted on Heroku. Table 1 summarizes the results for 10 and 100 samples, the mean values of time μ and standard deviation σ, the throughput defined as the number of requests per total time, and the error percentage.
Table 1: Performance results of the stress and load tests of the web tool URL Number of Throughput Error (%)
CONCLUSIONS AND LIMITATIONS In this scientific article, we have discussed three different ways to develop a sentiment analysis model on a web tool. In future works it is intended to improve results by
Human Systems Engineering and Design (IHSED 2021) https://openaccess.cms-conferences.org/#/publications/book/978-1-7923-8987-0 working on larger datasets. In this article, algorithms and techniques were used only for the sentiment analysis of a tweet; however, the approach can be extended to comparing each result with ground truth to find out which algorithm has better performance. Also, in a future multi-class approach, the number of categories could be increased to capture sentiments from COVID-19 related tweets more accurately. One of the limitations of this research is that, given the subjectivity of the comments made on Twitter, the sentiments may not necessarily represent the generalized opinion of a country, i.e., it only analyzes information from a certain population sample.
ACKNOWLEDGMENTS
This work was supported by IDEIAGEOCA Research Group of Universidad Politécnica Salesiana in Quito, Ecuador.
REFERENCES
Di Gennaro, F., Pizzol, D., Marotta, C., Antunes, M., Racalbuto, V., Veronese, N., & Smith, L. (2020).: Coronavirus diseases (COVID-19) current status and future perspectives: a narrative re-view. International journal of environmental research and public health, 17(8), 2690 COVID 19 API: A free API for data on the Coronavirus, https://covid19api.com/ Luque, A., Maniglio, F., Casado, F., García-Guerrero, J. (2020): Transmedia Context
and Twitter as Conditioning the Ecuadorian Government’s Action. The Case of the “Guayaquil Emergency” During the COVID-19 Pandemic. Trípodos. Facultat de Comunicació i Relacions Internacionals Blanquerna-URL, vol. 2, no 47, pp. 47-68. Torres, I., Sacoto, F. (2020): Localising an asset-based COVID-19 response in Ecuador. The Lancet, vol. 395, no 10233, pp. 1339. Kouloumpis, E., Theresa W., Johanna M. (2011): Twitter sentiment analysis: The
good the bad and the omg!. In: Proceedings of the International AAAI Conference on Web and Social Media, vol. 5, no 1. Barkur, G., Vibha, G. (2020): Sentiment analysis of nationwide lockdown due to COVID 19 out-break: Evidence from India. Asian journal of psychiatry, vol. 51, pp. 102089. Samuel, J., Ali, G., Rahman, M., Esawi, E., Samuel, Y. (2020): Covid-19 public
sentiment insights and machine learning for tweets classification. Information, vol. 11, no 6, pp. 314. Wang, T., Lu, K., Chow, K., Zhu, Q. (2020): COVID-19 Sensing: Negative sentiment analysis on social media in China via Bert Model. Ieee Access, vol. 8, pp. 138162-138169. Utitiaj, I., Morillo, P., Vallejo-Huanga, D. (2020): Sentiment Analysis Tool for
Spanish Tweets in the Ecuadorian Context. In: 3rd International Conference on Algorithms, Computing and Artificial Intelligence, pp. 1-6. Association for Computing Machinery, New York.
Human Systems Engineering and Design (IHSED 2021) https://openaccess.cms-conferences.org/#/publications/book/978-1-7923-8987-0
Pazmiño, R., Badillo, F., González, M., García-Peñalvo, F. (2020): Ecuadorian Higher Education in COVID-19: A Sentiment Analysis. In: Eighth International Conference on Technological Ecosystems for Enhancing Multiculturality, pp. 758-764 Terán, L., Mancera, J. (2019): Dynamic profiles using sentiment analysis and twitter
data for voting advice applications. Government Information Quarterly, vol. 36, no 3, pp. 520-535 Rivera-Guamán, R., López-Lapo, R., Neyra-Romero, L. (2020): Sentiment Analysis Related of International Festival of Living Arts Loja-Ecuador Employing Knowledge Discovery in Text. In: Applied Technologies: Second International Conference, ICAT 2020, vol. 1388, pp. 327. Springer Nature Cortes, C., Vapnik, V. (1995): Support-vector networks. Machine learning, vol. 20,
no 3, pp. 273-297 Loria, S. (2020): textblob Documentation. Release 0.16.0. Blei, D., NG, A., Jordan, M. (2003): Latent dirichlet allocation. Journal of machine Learning research, vol. 3, pp. 993-1022 De Koch, N. (2001): Software engineering for adaptive hypermedia systems. Ph.D
Thesis, Verlag Uni-Druck, Munich
Human Systems Engineering and Design (IHSED 2021) https://openaccess.cms-conferences.org/#/publications/book/978-1-7923-8987-0
LISTED IN THE AHFE DIGITAL BOOKSTORE CATALOGUE
Explore the complete digital volume
Human Systems Engineering and Design (IHSED2021): Future Trends and Applications
Read this individual research paper free through the original publisher, or explore the full digital proceedings book.
ISBN 978-1-7923-8987-0
Explore this ISBN in the AHFE Bookstore ↗Listed in the July 2026 bookstore catalogue; search by ISBN to confirm current availability · Digital book purchase optional