Simon Binz, Toni Waefler (2019). Exploring Trade-Offs Between Proactive Safety Indicators. In: Advances in Safety Management and Human Factors. AHFE Open Access, vol. 5. https://doi.org/10.54941/ahfe100164
Sound safety related decisions are the foundation for effective safety interventions. The Safety Management Information System (S-MIS) project allows making safety decisions based on two different sources. Quantitative survey results and qualitative judgments of subject-matter experts are the two sources. The aim of the present paper is to compare the two sources concerning their conclusions for safety related decisions. The results indicate a relatively high congruence between the two sources. Therefore, the quantitative survey results and the qualitative judgments of subject-matter experts are comparable resources to meet sound safety related decisions. Differences between the two sources as well as limitations of the paper are furthermore discussed.
What sources does an organization have to assess its safety state? One source is to assess past safety-related indicators such as accidents, incidents or the like. Such indicators focus on safety outcomes, are based on retrospective data and are referred to as reactive indicators or lagging indicators (Baker, 2007). However, these measurements of safety have a disadvantage. They explicate the safety state of the organization in retrospective. Only corrective activities are possible after an accident has happened (Baker, 2007). Therefore, we have to search for indicators, which allow us to anticipate the safety state of the organization and thus enable us to adapt the safety state of the organization in a timely manner. Such indicators are called proactive safety indicators (Baker, 2007; Hopkins, 2009). Proactive safety indicators have to be developed in cooperation with the organization in question. The “Safety Management Information System” (S-MIS) project aims at supporting an organization to develop proactive safety indicators, to assess these proactive safety indicators, to forward recommendations to the manage- ment of the organization as well as to point out trade-offs between the proactive safety indicators (Waefler, Binz, Gaertner and Fischer, 2012). Following this, four different aims can be stated for the S-MIS project (they will be explained below in more detail): (1) Development of a model of proactive safety indicators (2) Monitoring of the proactive safety indicators (3) Prediction about the future development of the indicators (4) Exploring trade-offs between the indicators
The first aim of the S-MIS project is to develop a model of proactive safety indicators. Organizations usually assess reactive safety indicators such as accidents or occurrences. These reactive indicators have the disadvantage that a reaction is only possible after something has already happened (Baker, 2007). Furthermore, they are not suitable to make predictions since not having had accidents in the past does not guarantee the absence of accidents in the future. The aim of the S-MIS project is thus to identify proactive safety indicators. To do so, the S-MIS project focuses on safety-enablers. The assumption is that sound safety-enablers have a positive effect on safety-performance and hence are suitable to predict future safety (Øien, Utne and Herrera, 2011). Such indicators are called proactive safety indicators or leading indicators (Baker, 2007; Hopkins, 2009). Based on proactive safety indicators, preventive action can be taken. Concerning the S-MIS project, proactive safety indicators (e.g. “culture” or “competencies”) were identified. These proactive safety indicators should show in advance, how able an organization is to provide safety.
The second aim of the S-MIS project is to monitor the proactive safety indicators. This allows the detection of trends over a certain period of time. To do so, the proactive safety indicators are assessed quarterly by employees of the company in question. The results of the assessments are analyzed separately for each indicator. The analysis focuses on changes within an indicator between several assessments. Thereby, statements regarding both, the change of an indicator as well as the statistical significance of such change, are possible. A negative trend of an indicator suggests that the future safety state of the organization may be affected in a negative way. A positive trend of an indicator may imply that an improvement has occurred within a certain time period. However, the detection of a change within an indicator only allows to state that the relative value of an indicator has changed over time. It is not possible to make any statements about the reasons for a change within an indicator. A further step is therefore to determine occurrences or the like that influence the value of the indicator. Therefore, employees who participate in the quarterly assessments are asked to identify reasons that influenced their assessment of the indicators. The combined knowledge of a change within an indicator and the reasons behind this change are the basis of recommendations to the management of the organization.
The third aim of the S-MIS project is to make predictions about the future development of the proactive safety indicators. Two sources are available to achieve this aim. The results of the monitoring of the proactive safety indicators is one source (see above). This retrospective monitoring may reveal trends that support extrapolation.
Simulation is another source to estimate the future state of the proactive safety indicators. The simulation in the present paper is based on the relations between the proactive safety indicators. These relations are either positive, zero or negative (e.g. an increase in one indicator could lead to an increase, to no change, or to a decrease in another indicator). To simulate, all relations between the proactive safety indicators are integrated into one formula system. As a result of this integration, the interdependence between all proactive safety indicators can be calculated (e.g. the impact of a change in “work conditions” on all the other proactive safety indicators). The calculation of the interdependence between all proactive safety indicators is the basis to predict the future state of the proactive safety indictors. Thus, it is possible to estimate e.g. the indicator with the highest positive impact on all other indicators or the indicator with the smallest negative impact on all other indicators.
Aims 1-3 as described above have been presented in an earlier AHFE-paper (Waefler et al., 2012). The present paper focuses on aim 4: Exploring trade-offs between proactive safety indicators. Concerning the S-MIS project, trade-offs are defined as the comparison of different proactive safety indicators with reference to their relative impact on the safety state of the organization. Several proactive safety indicators such as “culture” or “competencies” were developed on the basis of the S-MIS project. It is assumed, that each proactive safety indicator has a different impact on the safety state of the organization.
In the following section the importance of trade-offs is discussed.
PROACTIVE SAFETY INDICATOR TRADE-OFFS The resources of an organization are limited. Thus, all investments in an organization have to be well reasoned and the available resources of the organization have to be placed effectively. This counts for economic issues as well as for safety issues. Just as various possibilities for economic investments are imaginable, multiple possibilities to invest in safety issues are possible too. The S-MIS project revealed several proactive safety indicators which account for the overlying safety state of the organization. Therefore, an investment in each proactive safety indicator is desirable to increase the overall safety state of the organization. However, due to economic limitations, it is not possible to invest in each safety indicator. A selection of safety indicators based on their impact on the overall safety state of the organization has to be made. The selection of the safety indicators is based on the trade-off analysis between the safety indicators. All indicators are compared to each other with reference to their impact on the overall safety state of the organization. By doing so, the indicators with the highest impact on the overall safety state of the organization can be identified. By implementing an intervention for these indicators the most positive effect for the safety state of the organization can be attained.
The S-MIS project allows to make trade-offs based on two different data sources. Quantitative survey results as well as qualitative judgments of subject-matter experts are the two sources. The aim of the present paper is to compare these two sources referring to their trade-offs between proactive safety indicators. If both sources lead to comparable trade-off results, this would imply that survey assessments with relatively high personal investments may be compensated by the judgments of a few subject-matter experts.
In the following chapter, trade-off analyses for each source are calculated separately. These trade-off analyses are then compared with each other.
METHODS AND RESULTS S-MIS indicator model and S-MIS survey
The S-MIS indicator model is a multi-level, hierarchical model of indicators with “safe acting” on the top and proactive safety indicators such as for example “culture” or “competencies” as underlying hierarchical levels. The proactive safety indicators were developed based on the knowledge of subject-matter experts as well as on research on human and organizational factors. In order to measure the indicators of the S-MIS indicator model, empirically observable statements were formulated on the level of the proactive safety indicators (e.g.: “Coworkers communicate their own mistakes as well.” or “The management places trust in their subordinates.”). The result of this was an aggregate of 254 statements, assigned to 6 indicators, which represent the S-MIS questionnaire.
Procedure to compare qualitative and quantitative data To compare the trade-off analyses between the quantitative and qualitative data, trade-off analyses for each source had to be calculated separately. The trade-off analyses were based on correlation coefficients. These correlation coefficients were either calculated (for the quantitative data) or were established on a consensus-based appraisal by the subject-matter experts (for the qualitative data). Additionally, means across all correlation coefficients referring to each proactive safety indicator were calculated separately. Finally, the correlation coefficients and the means of the correlation coefficients of the two sources were compared.
In the following sections the correlation coefficients between the indicators for both sources, as well as a comparison of the two sources, are presented.
Quantitative data 65 participants rated the statements of the S-MIS questionnaire on a scale from 1 “disagree strongly” to 6 “agree strongly”. The participants were employees of the company in question and represent different hierarchical ranks as well as different organizational units. Based on the survey results a value for each indicator was calculated. The values of the indicators were the foundation for the following correlation calculations within the quantitative data.
The following paragraph describes how the correlation coefficients based on the quantitative data were calculated.
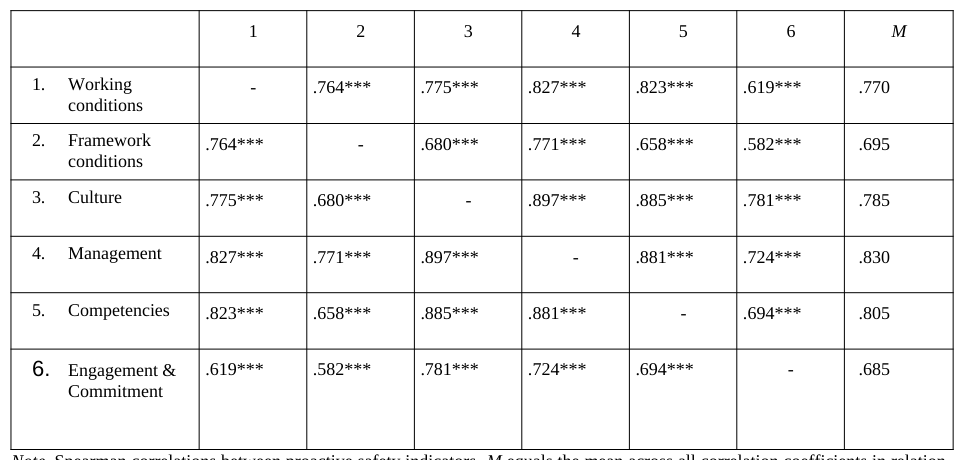
Correlations based on quantitative data In Table 1 the correlation coefficients based on the quantitative data are presented. As some indicators were not normally distributed, Spearman’s Rho was calculated. No correction for alpha-failure inflation was implemented, since a hypothesis was available for each tested correlation. The hypotheses are based on the ratings of the interdependence between the indicators, as rated by the subject-matter experts. Because the hypotheses derived from the subject-matter expert ratings are directional, one-tailed correlations were tested. All correlations are significant at the level of p < .001.
Additionally, the means across all correlation coefficients concerning one indicator were calculated, in order to compare the correlation coefficients between the two sources on an aggregated level. Correlation coefficients are neither normally distributed nor interval scaled. Bortz (2005) therefore recommends computing the means of correlation coefficients based on Fisher’s z-transformed correlation coefficients. Hence, as a first step, all correlation coefficients were Fisher z-transformed. Secondly, a mean across all correlation coefficients belonging to one indicator was calculated. Thirdly, the means were retransformed into correlation coefficients. The means of the quantitative correlation coefficients can be found in Table 1 in the last column marked M.
Table 1: Correlations between proactive safety indicators for quantitative data
Note. Spearman correlations between proactive safety indicators. M equals the mean across all correlation coefficients in relation to one indicator according to (Bortz, 2005). Participants are employees of the corresponding organization (n = 65). ***p < .001, one-tailed.
Qualitative data Five subject-matter experts of the company in question qualitatively rated the correlation between the indicators (e.g. between “culture” and “competencies”). The subject-matter experts could choose between:
a positive correlation,
a zero correlation and
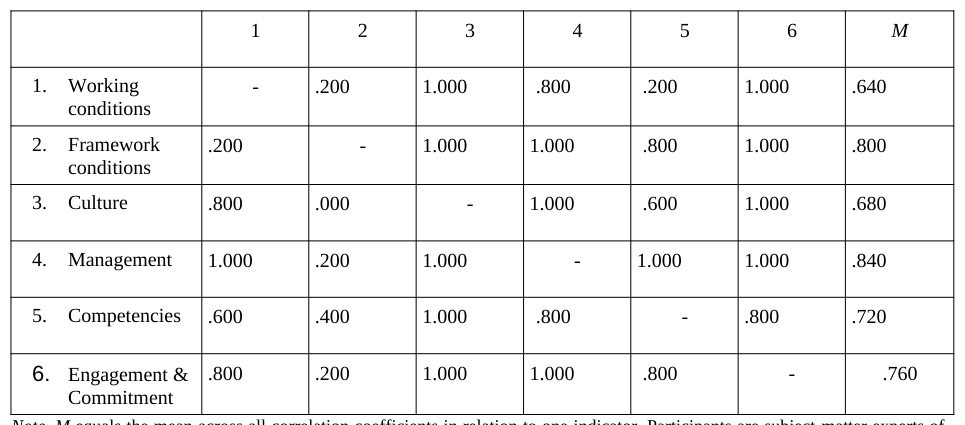
a negative correlation between two indicators. Each option was assigned a specific value. “1” was assigned to a positive correlation, “0” was assigned to a zero correlation and “-1” was assigned to a negative correlation. Firstly, all subject-matter experts rated the correlation between the indicators on their own. Secondly, the subject-matter experts agreed upon a consensus regarding the correlation between the indicators. The consensus of the correlation could lie within the range of [-1,1], i.e. the consensus could differ from -1, 0 or 1 (e.g. r = .800). The assessment of the correlation between the indicators was vectored, which means that the correlation between two indicators could differ depending on the order of the indicators (e.g. the consensus correlation between the indicator culture and the indicator working conditions is r = .800 and the consensus correlation between indicator working conditions and the indicator culture is r = 1.000).
Correlations based on qualitative data In Table 2 the correlation coefficients on the basis of the qualitative data are presented. The presented figures are based on a consensus generated by the five subject-matter experts. As with the quantitative data, the means across all correlation coefficients concerning one indicator were calculated. Because the subject-matter experts rated the correlations between the indicators on a scale within the range of [-1,1] an interval scale was assumed. Hence, no Fisher z-transformation was conducted concerning the calculation of the means for the qualitative data. The means for the qualitative data can be found in Table 2 in column M.
Table 2: Correlations between proactive safety indicators for qualitative data
Comparison of qualitative and quantitative trade-off results Lastly, the correlation coefficients of the quantitative and qualitative data and the means of the correlation coefficients were compared. For this purpose, the correlation coefficients based on the quantitative data (Table 1) and the correlation coefficients based on the qualitative data (Table 2) were categorized. The following operationalization for the categories was chosen: “X” was assigned to correlation coefficients within the range of r ε [.000, < .300], “y” was assigned to correlation coefficients within the range of r ε [≥ .300, < .600] and “z” was assigned to correlation coefficients within the range of r ε [≥ .600, 1.000]. The categorization of the quantitative correlation coefficients resulted in zero assignments to “x”, 2 assignments to “y” and 28 assignments to “z”. In comparison to the categorization of the quantitative correlation coefficients, 6 qualitative correlation coefficients were assigned to an “x”, 1 qualitative correlation coefficient was assigned to a “y” and 23 qualitative correlation coefficients were assigned to a “z”. The means of the quantitative and qualitative correlations were all assigned to a “z”.
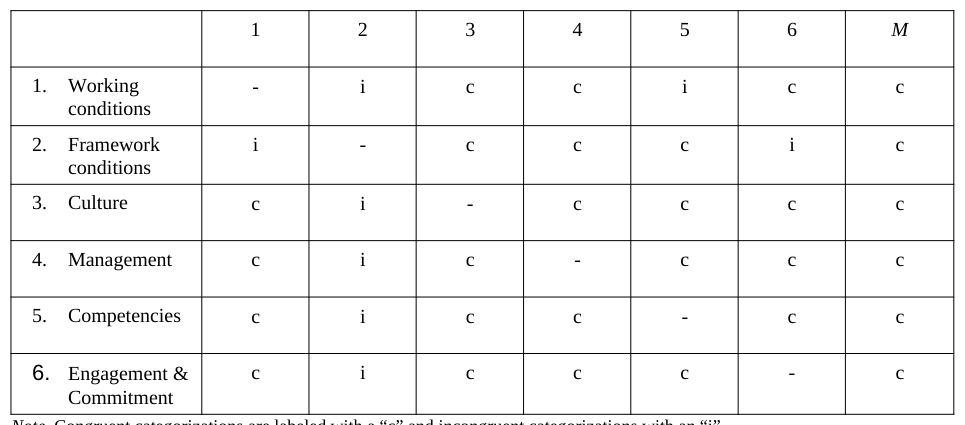
The results of the comparison between the categorization of the quantitative correlation coefficients and the categorization of the qualitative correlation coefficients are presented in Table 3. Congruent categorizations for the quantitative and qualitative correlation coefficients are labeled with a “c” and incongruent categorizations with an “i”. 22 categorizations were congruent and 8 categorizations were incongruent. The means of the quantitative and qualitative correlation coefficients were all categorized congruently.
Table 3: Comparison of the categorization of the quantitative and qualitative correlations
CONCLUSIONS
The aim of the present paper is to compare two data sources in regard to trade-offs between proactive safety indicators: Quantitative data based on a questionnaire and qualitative data based on judgments of subject-matter experts. For both sources trade-off analyses between the proactive safety indicators were calculated. The trade-off analyses are based on correlation coefficients between the proactive safety indicators. The results of the trade-off analyses were then compared to each other. For this purpose, the correlation coefficients of both sources were categorized.
The correlation coefficients between the proactive safety indicators for the quantitative data have a range of rs = [.582, .897] and were all significant at p < .001. The correlation coefficients of the qualitative data range between r = [0,1.000]. For the qualitative data, no significance tests were calculated. Additionally, means across all correlation coefficients referring to one proactive safety indicator were calculated. The means of the quantitative data range between r = [.685, .830] and for the qualitative data between r = [.640,.840]. The comparison of the means between the quantitative and qualitative results showed a high congruence between the two sources (rmax = [.640,.840]).
To compare the correlation coefficients, the correlation coefficients of both sources were categorized by the means of three different categories. The comparison of the categorized correlations coefficients between the two sources resulted in 22 (73.3%) congruent and 8 (26.7%) incongruent categorizations. The means of the quantitative and qualitative correlation coefficients were all categorized congruently.
The aim of the present paper is to compare trade-offs between proactive safety indicators based on quantitative survey results and qualitative judgments of subject-matter experts. The results reveal comparable trade-off results for both sources. This implies that survey assessments with relatively high personal investments may be compensated by the judgments of a few subject-matter experts.
Out of the 8 incongruent categorizations, 7 refer to the indicator “framework conditions”. The subject-matter experts estimated the interrelation between “framework conditions” and the other indicators consistently lower, compared to the participants of the questionnaire-based assessment. One possible explanation for this result is that the subject- matter experts may perceive the “framework conditions” as not controllable. In contrast, the questionnaire-based data suggests that “framework conditions” may be influenced more than expected.
Although the results of the present paper are promising, some limitations have to be considered. Firstly, the assessment of the relation between the proactive safety indicators regarding the qualitative data must be reconsidered. The theoretical range of correlation coefficients lies between r = [-1,1]. This theoretical range of correlation coefficients was also applied for the assessment of the qualitative data. This led to some correlation coefficients of r = 1.000. However, such correlation coefficients are usually not detected within social science. A correlation coefficient of r = .500 is already considered a strong effect (Bortz, 2005). Therefore, for further qualitative assessments the range of the possible qualitative correlation coefficients may be limited (e.g. to a range of r = [-.500,.500]).
A further limitation of the present paper is that the trade-off analyses are based on correlation coefficients. Correlation coefficients state the relation between two variables (in our case proactive safety indicators). Based on correlation coefficients, only statements about the impact of the change of one indicator on another indicator are possible. The relation of one proactive safety indicator to all other proactive safety indicators would be of much more interest. In such a case, statements about the impact of a change in one indicator on all other indicators would be possible. Hence, for further assessments of the interrelation between the proactive safety indicators the subject- matter experts could be asked how they would estimate the relation of one indicator to all other indicators.
REFERENCES
Baker, III J.A., Leveson, N., Bowman, F.L., Priest, S., Erwin, G., Rosenthal, I., Gorton, S., Tebo, P.V., Hendershot, D., Wiegmann, D.A., Wilson, L.D. (2007), “The Report of the BP US Refineries Independent Safety Review Panel”. Bortz, J. (2005), “Statistik für Human- und Sozialwissenschaftler”. Heidelberg: Springer Verlag. Hopkins, A. (2009), “Thinking about process safety indicators”. Safety Science, 47, pp. 460-465. Øien, K., Utne, I.B., Herrera, I.A. (2011), “Building safety indicators: Part 1 – theoretical foundation”. Safety Science, 49,
pp. 148-161. Waefler, T., Binz, S., Gaertner, K., Fischer, K. (2012), “Decision Support in Safety Management”, in: Proceedings of AHFEI 2012, San Francisco, USA (21-25 July 2012).
LISTED IN THE AHFE DIGITAL BOOKSTORE CATALOGUE
Explore the complete digital volume
Advances in Safety Management and Human Factors
Read this individual research paper free through the original publisher, or explore the full digital proceedings book.
ISBN 978-1-4951-2100-5
Explore this ISBN in the AHFE Bookstore ↗Listed in the July 2026 bookstore catalogue; search by ISBN to confirm current availability · Digital book purchase optional