Christian Wullems, Geoff Dell, Yvonne Toft (2021). Improving the Railway’s Understanding of Accident Causation Through an Integrated Approach to Human Factors Analysis and Technical Safety Data Recording. In: Advances in Human Aspects of Transportation: Part I. AHFE Open Access, vol. 15. https://doi.org/10.54941/ahfe100653
Publisher statistics will load when you open Metrics.
AHFE OPEN ACCESS OPEN ACCESS CONFERENCE PROCEEDINGS PAPER
Improving the Railway’s Understanding of Accident Causation Through an Integrated Approach to Human Factors Analysis and Technical Safety Data Recording
This paper describes a safety data recording and analysis system that has been developed to capture safety occurrences including precursors using high-definition forward-facing video from train cabs and data from other train-borne systems. The paper describes the data processing model and how events detected through data analysis are related to an underlying socio-technical model of accident causation. The integrated approach to safety data recording and analysis insures systemic factors that condition, influence or potentially contribute to an occurrence are captured both for safety occurrences and precursor events, providing a rich tapestry of antecedent causal factors that can significantly improve learning around accident causation. This can ultimately provide benefit to railways through the development of targeted and more effective countermeasures, better risk models and more effective use and prioritization of safety funds. Level crossing occurrences are a key focus in this paper with data analysis scenarios describing causal factors around near-miss occurrences. The paper concludes with a discussion on how the system can also be applied to other types of railway safety occurrences.
Analysis of the systemic factors contributing to safety incidents in the Australian rail industry tends to occur post- occurrence. The contributing factors framework (Rail Safety Regulator's Panel, 2011), a coding framework based on Reason’s model of organizational accidents (Reason, 1997), is used to code occurrences following a systematic investigation of the occurrence and its contributing factors. The results of the coding are stored in a database that is used to identify systemic safety performance issues and trends. A limitation with this approach is that analysts tend to identify categories of possible causal factors rather than identifying characteristics that may distinguish the actual causal sequences. There is also a tendency to over-interpret sparse occurrence data.
Level crossing collision data is one such example of sparse data, where such events occur relatively infrequently. Precursor events such as near-misses at railway level crossings occur at a frequency that is orders of magnitude greater than collisions; however, use of this data is not without its problems. Subjectivity around definitions of near- miss and inconsistencies in reporting (Wullems, Toft, & Dell, 2013a) are issues that can severely affect the integrity of the data and its use as a leading indicator of safety performance. Furthermore, near-miss occurrences are often not investigated due to resource limitations; and variations to nominal operating performance are often not captured in the safety data recording process. These variations and other less visible influences can be important indicators of systemic issues that currently are not captured.
In contrast, this paper proposes an alternate model where a safety data recording and data analysis system is used to capture hundreds of parameters from train-borne systems and high-definition forward-facing video from train cabs, providing objective precursor data to analysts and incident investigators. This paper describes the system that has been developed and the process in which safety data is captured and analyzed. Thresholds are defined for the myriad of parameters that are captured, where exceedance of a given threshold indicates that the parameter is outside the safe envelope of operational performance and results in an alert. These parameters have been defined by an expert panel and are refined over time. This approach facilitates proactive and focused identification of systemic factors and deviations in nominal performance that may condition, influence or contribute to a future occurrence. It is intended that rail operators could use the system to identify and respond to threats to safety without having to wait for a serious incident to occur.
This paper describes the underlying accident causation model and how it relates to alerts through a manual scoring process. Several scenarios based on the capture of occurrences at railway level crossings are presented. The paper concludes with a discussion of analyses that can be conducted on data captured by this system, and where this approach can work for other railway occurrence types such as signals passed at danger.
SAFETY DATA RECORDING AND ANALYSIS SYSTEM A trial safety data recording and analysis system (SDRAS) has been developed to capture objective data on near- miss occurrences at railway level crossings as part of the Baseline Railway Level Crossing Video project (R2.119) being conducted by the Cooperative Research Centre for Rail Innovation, an Australia Federal Government funded research initiative. The system is comprised of a software developed by the research team and geospatial database installed on a hardware platform with significant storage (arrays of approximately 200 Terabytes) and processing capacity to support video analytics (Wullems, Toft, & Dell, 2013b).
The approach to safety data recording involves the capture of hundreds of parameters from train-borne systems including GPS and the automatic train protection system, which provides parameters including but not limited to: rail vehicle dynamics; driver operations and vigilance; automatic train protection indications; application of power and braking; and transponder messages. Forward-facing video footage is also downloaded from trains and video analytics is used to provide parameters around the detection, localization and tracking of objects including persons and vehicles; detection of speed boards, whistle boards, end of authority boards and other signs; detection of the rail; and detection of signals and signal state. The project is collecting data from up to four high-speed passenger trains equipped with high-definition forward facing video cameras and automatic train protection, traversing a section of track with over 800 level crossings, 450 of which are level crossings that intersect with public roads.
The following subsections briefly describe the processing model of the system including key data sources, video analytics and complex event stream processing.
Processing Model The trial system has been designed with a post-processing philosophy, where data is replayed after pre-processing and analytic processing has been performed. This design was conceived to support the development and validation of algorithms, requiring all high definition video footage to be downloaded (approximately 2 Terabytes per fortnight per train). The scalability of the trial system is therefore limited by requirements for large data storage and bandwidth to support downloading of data.
In a future iteration of the system, it is expected that image and data processing algorithms will have been sufficiently tested and validated to be able to support the development of a train-borne system capable of capturing data and generating alerts without the need to download all data to large storage arrays for post-processing. The train-borne system, being able to detect events of interest and capture data around such events, would be able to significantly reduce the quantity of data that needs to be downloaded, supporting a wireless download capability when the train enters into the maintenance facility. Critical alerts could be transmitted to maintenance or train control in real-time via 3rd or 4th generation cellular communication networks. This paper, however, focuses on the processing model of the trial system.
The processing of data in the trial system involves the following sequential phases for each train trip:
1. Data importation is the first phase where various sources of raw data including video are uploaded to the SDRAS. Sources of data originating from train-borne systems are associated with running numbers; train consists; and train numbers.
2. Data pre-processing and storage is the phase responsible for parsing, correction and correlation of raw data to support analytic processing. This phase involves correction of location data from the train-borne GPS receiver using map-matching algorithms and the track centerline data in the geospatial database to improve the accuracy of the data. Other datasets originating from train-borne systems such as the automatic train protection (ATP) system are processed to ensure the data can be referenced via a universal time coordinate (UTC) or location reference. Any datasets such as environmental observations from weather stations can be added to the system if UTC or location can reference it. Pre-processed data is stored in the geospatial database.
3. Analytic processing is the phase that involves analyzing the data using various algorithms and storing the results in the geospatial database to support complex event processing. Video analytics is a core part of this phase and involves extracting regions of interest from video footage for analysis using image-processing algorithms. Regions of interest such as approaches to railway level crossings or signals are defined by the location of the asset (level crossing, signal, etc.) and either a time or distance parameter to determine the quantity of video that is extracted. For example, to process level crossing approaches for a given train trip, GPS data from the train would be used to determine the regions of interest for a video analysis task that detects, locates and tracks vehicles at level crossings.
4. Complex event processing is the final phase in the processing of train data. Definitions of event processing networks are loaded into the event processing engine and replayed using UTC time to coordinate the generation of events from data recorded in the geospatial database. Where an exceedance of a defined threshold for system parameter occurs, alerts are raised and these are the initiating points for the manual scoring process.
Once data for a given train trip has been processed, manual scoring can be performed, where alerts are reviewed by an analyst or incident investigator.
Video Analytics To support analysis of precursor safety events at railway level crossings, several image processing plugins have been developed to detect and track objects visible in forward-facing video footage captured on approach to railway level crossings. These objects include but are not limited to cars, trucks, buses, and pedestrians. To date a vehicle object detector has been implemented and a pedestrian object detector is in development.
The vehicle object detector is used to detect vehicles in frames of the video footage. The position and distance of vehicle(s) from the rail can be determined through a projective transformation of the image and associated bounding boxes of detected vehicles using a homography matrix for the specific forward facing video camera (Aminmansour, Maire, & Wullems, 2014). An example of the projective transformation and output of the object detector is illustrated in Figure 1.
Where road geometry is available for a given level crossing, the distance between the detected vehicle and the rail for each frame can be determined through the interpolation of the location of the vehicle along the road segment that intersects with the rail centerline. This allows for accurate distances to be determined irrespective of the road approach geometries. Where road geometry data is not available (e.g. farm and occupational level crossings), the minimum vector distance between the detected vehicle and rail is used, albeit with a lower level of confidence.
Forward-facing video
Projective transformation – bird’s eye view
Figure 1. Video analytics used to detect events of interest on approach to level crossings
The video analytics process writes metadata on detected objects for each level crossing approach to the geospatial database. Parameters that are recorded include object type (e.g. car, truck, bus, pedestrian, etc.) and the distance of the object to the rail in each frame, which has a location and UTC time reference.
Data from Train-borne Systems Logs from the automatic train protection (ATP) system are periodically downloaded from trains via a wireless downlink and uploaded to the safety data recording and analysis system (SDRAS) ready for pre-processing and storage. The ATP data is the source of several parameters of interest including: speed; power and brake demand; brake pipe pressure; klaxon operation; driver indications and push button operations; and ATP transponder and signal encoder messages (Invensys Rail Pty. Ltd., 2010). The digital video recorder (DVR) is responsible for capturing forward-facing video footage and records frames with a GPS location and time reference. Procedures are in place to periodically swap DVR hard disks and to initiate a download process from a caddy connected to the SDRAS servers.
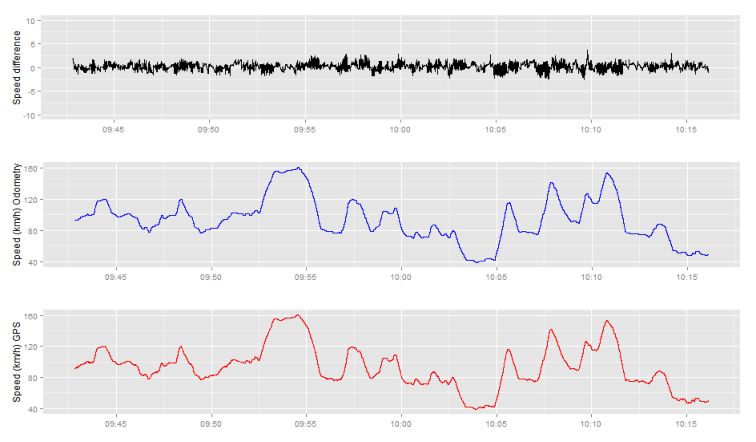
Geo-referencing the ATP data presented some challenges , as the ATP system clocks are not synchronized to UTC. In the absence of points of reference between the two data sets, the speed from the ATP data (determined using wheel odometry) is correlated with the GPS speed to determine the offset of the ATP clock (illustrated in Figure 2). This procedure is executed for each ATP data upload, where a corresponding GPS and video dataset is present on the server.
Figure 2. Determining the time offset of ATP data with respect to UTC using a correlation of train speed from ATP (wheel odometry) and GPS speed data
Having solved for the time offset, ATP events can be geo-referenced using the GPS dataset and the video associated with ATP events can be viewed.
COMPLEX EVENT PROCESSING Complex event processing (CEP) is an integral part of the safety data recording and analysis platform. CEP allows complex events to be detected through the analysis and correlation of events from multiple data sources. The geospatial database is the source for event producers, where events are generated in playback for a given train trip using the universal time coordinate (UTC) as a coordinating reference. While the trial system has been designed around a post-processing paradigm, the CEP component supports real-time processing, where the future goal of the system is development of a train-borne unit providing a real-time predictive processing capability that can identify events before they happen using the precursor data captured by the system. This modality would be possible once causal relationships between events and algorithms used for analytics are validated.
Using the underlying model of multi-linear accident causation as a reference, event networks are created linking event producers to event consumers. These networks are based on known causal factors and sequences that can be parameterized through data collected by the system. An event processing network is defined as a set of event processing agents that accept input from one or more channels (event streams) and produce additional events that can be consumed by additional event processing agents or event consumers (Etzion & Niblett, 2009). Each agent can aggregate, transform or detect event patterns, allowing complex conditions to be defined. Event processing language (EPL) is used to define these conditions. Context partitions are a specific type of event processing agent that is used to facilitate context-dependent event processing. An example of a context partition is the approach to a level crossing. An event processing operation that detects transgressions at level crossings can be associated with a level crossing approach context such that processing associated with the detection of transgressions is restricted to this context.
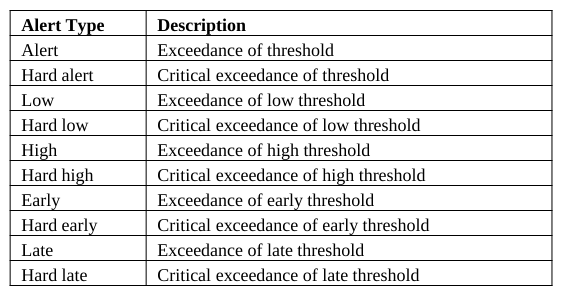
Event agents at the end of each event processing network instance produce alert events based on exceedances of thresholds that are defined for parameters when they fall outside a known envelope of nominal and safe operation. These alerts also relate directly to multi-linear causation sequences from the underlying domain-specific causation model. This will be discussed in more detail in the next section. Alert types that have been considered in the system are listed in Table 1.
Table 1: Alert types Alert Type Description Alert Exceedance of threshold Hard alert Critical exceedance of threshold Low Exceedance of low threshold Hard low Critical exceedance of low threshold High Exceedance of high threshold Hard high Critical exceedance of high threshold Early Exceedance of early threshold Hard early Critical exceedance of early threshold Late Exceedance of late threshold Hard late Critical exceedance of late threshold
An example of an event processing network instance for performance parameters relating to level crossing safety is illustrated in Figure 3. Note that this is a simplified example and is provided for illustrative purposes only. Many parameters from ATP data (ATP producer) and video analytics (video metadata producer) have not been included in the diagram.
Figure 3. Example instance of an event processing network for level crossing safety data
Figure available in the original PDF paper.
Two event agents illustrated in Figure 3 are described in more detail below: “object penetrates rail corridor on approach to level crossing” and “klaxon not sounded on approach to level crossing”.
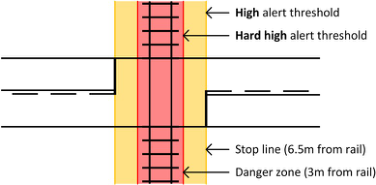
Figure 4 illustrates how thresholds and their corresponding alerts relate to an envelope of safe operating performance for level crossing users when a train is approaching a level crossing. The threshold for the safe envelope is the level crossing stop line. AS1742.7 (Standards Australia, 2007) defines where the stop line is located for various types of level crossings. For level crossings with stop or give-way signs, the stop line is a minimum of 3.5 meters from the nearest rail. For level crossing with active controls, the stop line is a minimum of 6.5 meters from the nearest rail (a minimum of 3 meters from the flashing light signal or boom barrier, which is located a minimum of 3.5 meters from the nearest rail). To determine the appropriate threshold for the stop line, the event agent queries the GIS database, which contains level crossing survey data.
Figure 4. Alert thresholds for penetration of rail corridor on approach to a level crossing with active controls If a road vehicle (object) exceeds the stop line but stops short of the danger zone, a high alert is raised. The critical threshold is defined as penetration of the 3-meter danger zone while the train is on approach. In this case, a hard high alert is raised.
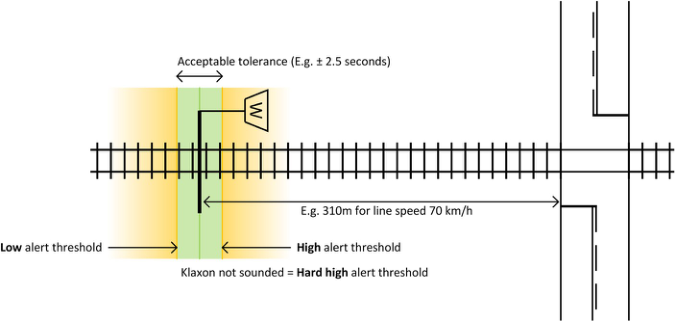
Figure 5 illustrates alert thresholds for sounding of the klaxon on approach to a level crossing. The klaxon increases the conspicuity of the train to road vehicles and pedestrians as it approaches the level crossing. Standard practice requires the train driver to sound the klaxon when adjacent to the whistle board and at other locations on approach to the level crossing where deemed appropriate by the driver. Whistle board placement is parameterized by line speed; where the line speed exceeds 100 km/h, two whistle boards are required on approach. An alert is raised if the klaxon is not sounded on approach or is sounded outside an acceptable tolerance (e.g. ± 2.5 seconds) of the train being adjacent to a whistle board.
Figure 5. Alert thresholds for sounding of klaxon on approach to a level crossing
Other events have been added to the CEP to detect significant differences between posted line speed and train speed, which cause variations in audible warning time to road users compared with expected warning times based on whistle board placement.
ACCIDENT CAUSATION MODEL Traditionally in the rail industry analysis of accident causal factors have been limited to post event investigation on a case by case basis where scope and fidelity of analysis was limited largely to the extent of the individual investigators’ analytical skill and experience. There have also been some attempts to apply epidemiological approaches to determining common causal factors in the case of specific accident and incident paradigms specifically those at rail level crossings. In the case of the Contributing Factors Framework (CFF), data from level crossing accident and incident reports were coded using categorization criteria based on the conceptual latent failure framework of the Reason Model of Organizational Accidents. These activities derived outcomes themed on the general categories of failure types without specific focus on actual socio-technical system and subsystem failures.
To address these issues, an alternate process involving the continual capture safety data extrapolated from hundreds of parameters from train-borne systems and high-definition forward-facing video has been developed, providing a rich tapestry of antecedent causal factors. A comprehensive multi-linear accident causation model underpins the data capture and analysis process and has been developed through expert committee, using level crossing accident reports to validate the first iteration. The model is comprised of a series of fault-trees that model the cause and effect relationships of socio-technical system and subsystem failures, taking into consideration technical, organizational and management factors including level crossing design, installation and commissioning activities, and operations and maintenance. Failures are considered in relation to railway operations, road vehicles, road user performance, rail vehicles, train driver performance, infrastructure performance and governance.
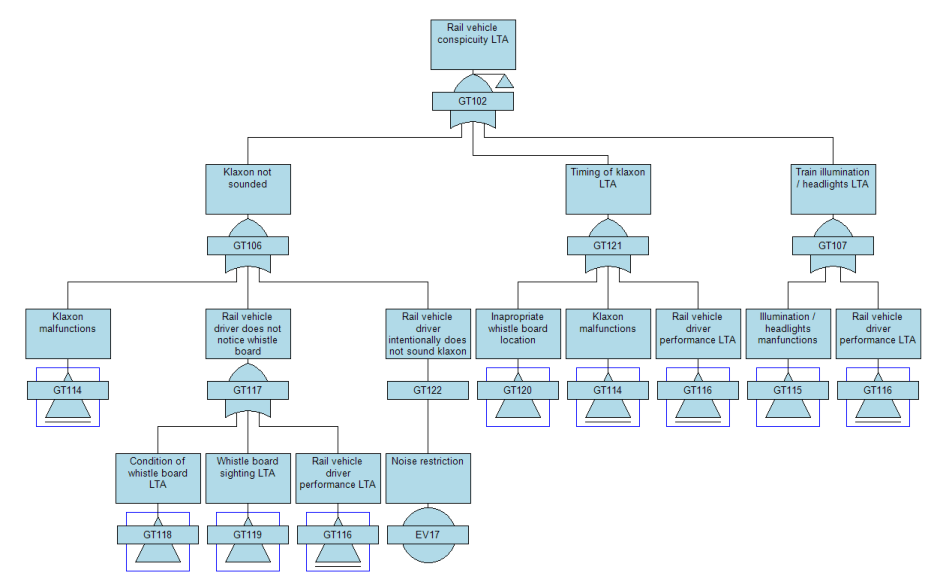
A small excerpt of the model is illustrated in Figure 6, describing a limited number of upstream causal factors related to the klaxon not being sounded on approach to a level crossing. This particular scenario has been described in the previous section and will be used in the following subsection to describe how alerts are related to the accident causation model. Note that in the diagram, LTA is defined as “less than adequate” and the blue box around a given gate indicates that child gates and events are on another page.
Figure 6. Excerpt from the accident causation model describing possible upstream causal factors for why the klaxon was not sounded on approach to a level crossing
The human factors and human performance elements of the model were modeled using a version of HFACS (US Department of Defense, 2004) modified for applicability to rail. HFACS considers errors and violations; preconditions including environmental factors, conditions on individuals and personnel factors; supervision and organizational influences. HFACS facilitates a systematic, multi-dimensional analysis of human factors for the investigation of incidents; however, a drawback of the model is that it does not adequately address design and related human performance issues. Such factors include task, workplace and equipment design and function allocation. The model addresses the design issues by considering them as physical and technological environment factors that are preconditions for unsafe acts.
HFACS has been operationalized within the accident causation model as a set of transfer gates that prompt the analyst to consider these factors. The model supports predictive and retrospective analysis of near-misses and collisions at railway level crossings (between road and rail vehicles and rail vehicles and pedestrians) and acts as the lens with which precursor events detected by the system can be analyzed and reviewed. Practitioners can additionally use the model as a guide to incident investigation and in the design of new level crossing safety countermeasures. The accident causation model will be the subject of another paper, describing the model and development process in detail.
Relating Events to Multi-Linear Causation Model One of the most innovative aspects of the system is the operationalization of the causation model through the establishment of relationships between alerts (detected events of interest) and the causation model. Alerts defined within the complex event processing system are associated with gates within the model that represent multiple linear causation paths. The analyst is prompted with alerts to review as part of the manual scoring component of the system. For each alert, a checklist is presented to the analyst, prompting them to provide more information on potential upstream causal factors through review and evaluation of evidence presented in corresponding video footage and train data, and from further investigation.
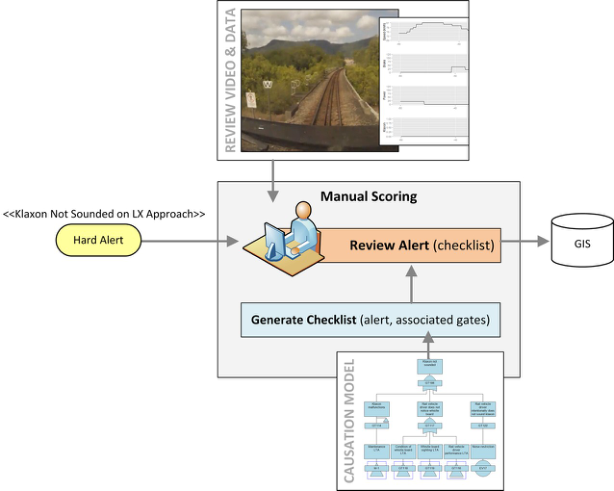
The checklist is automatically derived using the underlying causation model from the initiating gates associated with the alert, to the upstream events in the model. The manual scoring interface provides the analyst with the ability to display and aggregate various sources of data related to the event by time and / or location. Multiple event sequences can be linked where alerts identify events of interest within the same level crossing approach (i.e. same causation sequence). Figure 7 provides a high-level overview of the manual scoring process and illustrates the scoring associated with an alert in which the klaxon was not sounded on approach to the level crossing.
In this scenario, a hard alert was generated: “klaxon not sounded on approach to level crossing”. The analyst would have been presented with the alert to review, accompanied by a checklist generated from the fault-tree model initiating at gates related to the alert. For example, the alert “klaxon not sounded on approach to level crossing” could have been caused by a malfunction of the klaxon, the train driver not noticing the whistle board, or the train driver intentionally not sounding the klaxon (e.g. due to noise restrictions). In the second case, the driver may not have noticed the whistle board due to its condition (e.g. vandalism, disrepair, obscuration by vegetation, etc.), environmental conditions, or driver performance issues such as workload, distraction, etc.
Figure 7. Manual scoring process
The analyst is able to complete many entries of the checklist such as the condition and placement of the whistle board as well as environmental conditions using the video and associated data. Responses to human factors aspects of the checklist in some cases can be extrapolated from analysis of data associated with the alert. For example, train driver operations are captured in ATP logs, and in some cases it could be possible to estimate driver workload using this data.
The manual scoring process allows the less visible influences that are known to condition accidents to be captured and recorded for further analysis using the model as a lens to support analysis with parameters that are consistent and as objective as possible. For example, if an alert were raised due to a vehicle penetrating the rail corridor on approach to a level crossing, the analyst would be prompted to consider conditions such as queuing across the level crossing, a long vehicle overhanging on tracks, failure of the active level crossing warning device, obscuration of sighting (e.g. due to vegetation), and condition of signs and warning device. All of these conditions can be verified using the video and associated data, which can provide an objective identification of causal factors that may have contributed to the penetration of the rail corridor at the level crossing while the train was on approach. Human Aspects of Transportation I (2021)
In addition to alert-initiated scoring, analysts can periodically search for conditions through database-initiated searches, or where additional data is made available. For example, if remote monitoring logs from level crossing warning devices are made available, conditions such as intermittent or prolonged right-side failures can be identified. Such conditions may have preceded a near-miss or an observable degradation in road user performance. Right-side failures are those that result in the red flashing lights to operate and booms, where applicable, to lower indicating a fault rather than the approach of a train). This is the safe failure state of the level crossing warning device.
DISCUSSION
The safety data recording and analysis system (SDRAS) presented in the previous sections not only provides a retrospective incident analysis capability to incident investigators, but a resultant dataset that can be used for a range of analyses to benchmark performance, identify where there are safety issues and provide a predictive capacity to inform risk models and the design of new safety countermeasures. Techniques such as Bayesian analysis and spatial data mining can be used to discover unknown relationships in the data in addition to the online analytics processing capability provided by the database that supports generation of statistical analyses and summary data.
While much of this paper has focused on level crossing occurrences, the SDRAS can be used to capture and analyze data for a large range of rail occurrences and precursor conditions. For example, signals passed at danger (SPADs), another large contributor to operating risk, are often blamed on driver distraction and other human factors issues unless the occurrence is a technical SPAD. This system provides analysts and incident investigators with the capability to investigate occurrences in which there is consistently late braking on approach to a given signal at stop. Coupled with video and other data sources, the analyst is able to identify causal factors that are constantly present when this occurs, particularly issues in the rail corridor and signaling design that would otherwise go unnoticed.
The system also has applications for driver training, in which the data can be used to compare the performance of novice and experienced drivers. Parameters captured around incidents that have already occurred could be reproduced in a simulation environment and be a valuable tool for driver training.
CONCLUSION
This paper has described a safety data recording and analysis system that has been developed to capture safety occurrences including precursors using high-definition forward-facing video from train cabs and data from other train-borne systems. The paper has provided an overview of the system’s data processing model and has provided a number of scenarios related to level crossing occurrences. These scenarios demonstrated how an analyst manually scores events detected by the system and how the scoring criteria are related to an underlying socio-technical accident causation model.
The integrated approach to safety data recording and analysis insures systemic factors that condition, influence or potentially contribute to an occurrence are captured both for safety occurrences and precursor events, providing a rich tapestry of antecedent causal factors that can significantly improve learning around accident causation. This can ultimately provide benefit to railways through the development of targeted and more effective countermeasures, better risk models and more effective use and prioritization of safety funds.
ACKNOWLEDGEMENTS
We gratefully acknowledge the Cooperative Research Centre for Rail Innovation (established and supported under the Australian Government’s Cooperative Research Centres program) for the funding of this research. Project No. R2.119.
REFERENCES
Aminmansour, Sina, Maire, Frederic, & Wullems, Christian. (2014). Video analytics for the detection of near-miss incidents of approach to railway level crossings. Paper presented at the 2014 Joint Rail Conference (JRC 2014), Colorado Springs, CO, USA. Etzion, Opher, & Niblett, Peter. (2009). Event Processing in Action: Manning Publications. Invensys Rail Pty. Ltd. (2010). WESTECT II ATP Driver's Manual (1st ed.). Melbourne, Australia: Invensys Rail Pty. Ltd. Rail Safety Regulator's Panel. (2011). Contributing Factors Framework Manual (version 2) Retrieved from http://www.onrsr.com.au/__data/assets/pdf_file/0009/2700/CFF-document.pdf Reason, J. T. (1997). Managing the Risks of Organizational Accidents. Burlington, VT: Ashgate Publishing Ltd. Standards Australia. (2007). AS 1742.7-2007 Manual of uniform traffic control devices Part 7: Railway crossings. US Department of Defense. (2004). Department of Defense Human Factors Analysis and Classification System (DoD HFACS) --
A mishap investigation and data analysis tool. http://www.uscg.mil/safety/docs/ergo_hfacs/hfacs.pdf Wullems, Christian, Toft, Yvonne, & Dell, Geoff. (2013a). Improving level crossing safety through enhanced data recording and reporting: the CRC for rail innovation's baseline rail level crossing video project. Journal of Rail and Rapid Transit, 227(5), 554-559. Wullems, Christian, Toft, Yvonne, & Dell, Geoff. (2013b). An innovative information gathering and data analysis platform for
railway level crossing safety data. In N. Dadashi, A. Scott, J. Wilson & A. Mills (Eds.), Rail Human Factors: Supporting Reliability, Safety and Cost Reduction. London: Taylor & Francis.
LISTED IN THE AHFE DIGITAL BOOKSTORE CATALOGUE
Explore the complete digital volume
Advances in Human Aspects of Transportation: Part I
Read this individual research paper free through the original publisher, or explore the full digital proceedings book.
ISBN 978-1-4951-2097-8
Explore this ISBN in the AHFE Bookstore ↗Listed in the July 2026 bookstore catalogue; search by ISBN to confirm current availability · Digital book purchase optional