Ruggero Cecia, Kristie Youngb, Christopher Pattenc, Michael Lennéb (2021). Safety Concerns Regarding Merging in Tunnels – A Simulator Study. In: Advances in Human Aspects of Transportation: Part I. AHFE Open Access, vol. 15. https://doi.org/10.54941/ahfe100627
1 Swedish Transport Administration, Borlange, Sweden ↗
2 Human Factors Team, Monash University Accident Research Centre (MUARC), Clayton (VIC), Australia c Swedish National Road and Transport, Research Institute (VTI), Borlange, Sweden ↗
3 Swedish National Road and Transport Research Institute (VTI), Borlange, Sweden ↗
The Stockholm bypass project is by far the largest road/tunnel project ever undertaken in Sweden and has been scheduled to commence construction in mid-2014. The tunnel will be over 16 km in length with two parallel tunnel tubes containing a three lane motorway. In the present study a 3D model of the Stockholm bypass tunnel has been constructed for the purpose of visualizing and further testing traffic safety and traffic management issues related to ramps exiting and entering a tunnel. Twenty-three participants with a mean age of 33.7 (SD 11.8) years drove the MUARC advanced driving simulator in two different environmental conditions (tunnel and freeway) and two different speed conditions (80 and 100 km/h). Various traffic scenarios included interaction with surrounding and merging vehicles in a comparison between the tunnel and freeway environments. Dependent measures of driving performance included vehicle speed, speed variability, lane position, lane position variability, lane excursions and time to headway. Furthermore, eye tracking and subjective measures of driver workload were used to compare participant’s reactions across environments. Results suggest that when sight lines were not restricted on the freeway, drivers reduced speed during the first merge event only. For the tunnel and freeway with restricted sight lines, there were no significant differences in mean speed across the merge segments, although even in these environments there was a trend for drivers to reduce speed at the first on-ramp. Overall, it appears that driving environment and the restricted sight lines played a limited role in drivers’ behavioural response to the merging vehicles.
The Stockholm bypass project has been scheduled to commence construction in mid-2014 and is by far the largest road/tunnel project ever undertaken in Sweden. The tunnel part will be approximately 17 km in length and two parallel tunnel tubes with a three lane motorway each. The external road system will provide the road users with complete new road junctions in the great Stockholm area (primarily in the south and north areas of the tunnel). The opening of the tunnel is scheduled for 2024.
In Fig. 1 there is an overview of the tunnel system and ramp tunnels as viewed from the south Stockholm suburban area of Kungens kurva (to the right in the figure) to the northern parts ending in the Akalla area (to the left of the figure). The tunnel passes under the lake of Mälaren and the island Lovön (passing not long from the Royal Swedish
Castle in the area).
Figure1. An overview of the Stockholm bypass tunnel system with the different ramp tunnels indicated.
Figure available in the original PDF paper.
One major concern during the planning phase of the Stockholm bypass tunnel has been the design of the on ramps entering at several locations in the main tunnel and especially the design and function of the merging zones allowing traffic to enter safely into the tunnel.
In tunnels there is a more restricted view of the traffic situation, both on part of the drivers entering from the ramp tunnels and for the drivers in the main tunnel, as compared to a surface road system. In the Stockholm bypass tunnel, drivers’ sightlines at the on-ramps entering the tunnel will be further restricted by a thick concrete wall which obscures the view of the merging traffic for a distance. This thick wall was a required engineering feature of the tunnel due to the density of the surrounding bedrock. In addition, there is an estimated peak traffic density of approximately 140 000 vehicles per day passing the tunnel in 2030 which will make the tunnel the major artery in the Stockholm area in some 10-12 years from now (STA, 2013).
Given these design constraints, there is a need to further investigate if such a merging situation would function according to the intention of the designers and with reasonable safety margins for the tunnel users driving in the main tunnel as well as for those entering the tunnel from the ramp tunnels.
Another important issue to consider in this area is speed regulation in the main tunnel as well as in the ramp tunnels. The speed requirements for the Stockholm bypass tunnel will be 80 or 100 km/h, the national speed regulations are presently being revised in Sweden and so far there is no final decision regarding the tunnels under construction.
This is also the case for the Northern Link tunnel in Stockholm which will be opened for traffic in 2014-15. The tunnel is designed for a speed of 70 km/h but before the opening the authorities need to make a decision about the safest and most efficient speed regulation for this urban motorway tunnel.
An earlier tunnel study has looked at the differences in the effects of text messaging across the freeway and tunnel environments in a paper by Rudin-Brown et al. . This work is primarily an extension of this earlier study with the model of the Stockholm bypass and has focused upon the effect of distraction in the tunnel environment as compared to the highway.
A recent simulator study concerning the design of the Stockholm bypass tunnel have hinted at some safety related issues related to the merging zones (Patten, Mårdh and Ceci, in press). A number of measures related to the position of the vehicles involved in the merging situation in the tunnel (e.g., time headway, distance to wall) as well as subjective ratings (workload, time pressure, frustration and perceived risk) were used and the authors have raised some concerns regarding the design of the entry ramps. In that particular study the simulator vehicle was driving down the entry ramps in the tunnel, thus, from a different perspective from the vehicle in the present study which simulates a drive through the main tunnel with traffic entering the tunnel and freeway from the on-ramps.
In the present study a 3D model of the Stockholm bypass tunnel has been constructed for the purpose of visualizing and further testing traffic safety and traffic management issues related to ramps exiting and entering a tunnel. A specific question to study has been the safety margins of the merging situation between traffic in the main tunnel and traffic entering the tunnel as compared to a similar situation on a freeway with an identical design and traffic situation.
Thus, the aim of this study is to look at merging situations in a simulated traffic environment at different speed limits (80 and 100 km/h) with two versions of freeway (restricted and unrestricted sightlines) compared to the tunnel. Also, the study examines at the effect of having trucks interacting with the simulator vehicle as one of the merging vehicles.
METHODS
Participants A total of 26 participants took part in the study. Of these, three participants experienced simulator sickness during their session and did not complete the experiment. The data for these participants were excluded from the dataset. The remaining twenty-three drivers (13 male; 10 female) were aged 21 to 61 years (M = 33.7, SD = 11.8). All participants held a valid (n=20) full or provisional (n=3) driver’s license (M = 14.5, SD = 11.8 years) and drove an average of 8.4 hours each week (SD = 6.4). Participants had normal or corrected-to-normal visual acuity. Participants were recruited through advertisements at Monash University. Ethics approval for the study was granted by the Monash University Human Research Ethics Committee. Participants were offered $40 (AUD) for their time and expenses.
Experimental Design The study used a three-way (2 x 3 x 3) repeated-measures design: Speed limit (80 and 100 km/h) by drive segment (tunnel, freeway restricted sightlines and freeway unrestricted sightlines) by merge segment (non-merge (baseline), merge 1 and merge 2).
Materials
Driving simulator and driving tasks Driving performance was evaluated using the MUARC advanced driving simulator, a high fidelity, motion-based simulator consisting of a 2009 GM Holden VE Commodore sedan mounted on a three degrees-of-freedom motion base platform, and a curved projection screen providing a 180° horizontal, and 40° vertical field-of-view. Forward vision was produced by three image generators using seamless blended projection onto a cylindrical screen, while rear vision was provided by a separate projection screen at the rear of the vehicle. Simulated, speed-adjusted engine and road / tyre noise was present in all scenarios. An experimenter controlled all driving simulations remotely from a control room.
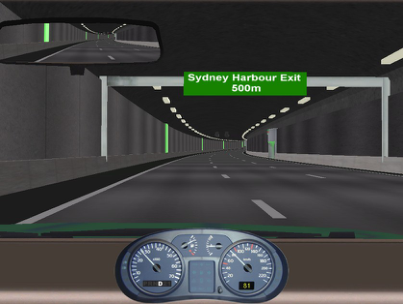
Participants drove two test drives, which were identical apart from the speed limit - one had a speed limit of 80 km/h and the other a speed limit of 100 km/h. The two drives contained three segments of 7 km each: tunnel, freeway restricted sightlines and freeway unrestricted sightlines. The tunnel segment was designed according to a section of the blueprints of the Stockholm bypass tunnel, with three lanes travelling in the same direction and adapted for right- hand drive traffic (see Figure 1). The tunnel contained a concrete wall that obscured sightlines at the two on-ramps contained in the tunnel segment. From the end of the concrete wall to the end of the on-ramp merge lane the distance was 340 metres for the first ramp and 310 metres for the second ramp. Two freeway (motorway) segments were also included in each drive, which were based on an Australian freeway design with three lanes travelling in the same direction and medium density trees lining the freeway and fields. One of the freeway segments contained restricted sightlines at the on-ramps, where a row of thick bushes were included to mimic the concrete wall in the tunnels. The bushes were designed to the same dimensions and distance specifications as the concrete wall in the tunnel. The other freeway section did not contain a row of bushes and had unrestricted sightlines at each on-ramp.
Each of the tunnel and freeway segments contained two on-ramps. The first on-ramp was located 2.5 km from start of each segment and the second ramp 4.3 km from start of each segment, which approximated their location of the Stockholm bypass tunnel blueprints. At each on-ramp, four vehicles travelled down each on-ramp at the posted speed limit at a distance of 2 seconds time headway from each other. These vehicles were triggered to appear as the participant approached each on-ramp and merged into left lane of freeway. The first on-ramp vehicle merged in front of the vehicle that was leading the participants’ vehicle. The second on-ramp vehicle merged between the participant’s vehicle and the lead vehicle, while the remaining two on-ramp vehicles merged behind the participants’ vehicle. For one of the two on-ramps in each segment, a truck was included as the second of the four merging vehicles. For the other on-ramp, all four vehicles were cars and no truck was present.
The roadway had an average 3% downhill slope for the majority of each drive segment. A medium to heavy level of traffic intensity (cars only) was present throughout tunnel and for all on-ramp sections there was a car in front and a car in the middle lane that travelled next to simulator vehicle to prevent the participants from accelerating or changing lanes to right to avoid the merging traffic. Both of these vehicles velocity tracked the participants’ vehicle. Pilot testing confirmed that there were no features of the environment that would be interpreted as novel or unusual for Australian drivers.
Six orders of the test drives were created to counterbalance the speed limits, drive segments and presence of the truck on the on-ramps. The order of the test drives was counterbalanced across participants.
During each drive, drivers’ visual scanning behaviour was captured using the faceLAB™ 4.0 eye tracking system . This system uses an unobtrusive stereo camera system and infrared illumination to track pupil and head movement in three dimensions at a rate of 60Hz, with a static accuracy of gaze direction measurement within +/- 5° rotational error (Classic configuration). Camera images and recordings were linked to a user-operated computer interface, allowing for post-drive analysis of glance location and duration. Eye movement data was reduced using the faceLAB™ software.
Figure 2. Simulated tunnel environment
Procedure Participants attended a single study session at the MUARC Advanced Driving Simulator. Participants first signed a consent form and completed a demographic and driving history questionnaire. Participants were informed that the purpose of the study was “to study driving behaviour under different roadway conditions”. Participants were seated in the simulator and the faceLAB™ eye tracking system was configured. Participants then completed a 10 minute familiarisation drive, during which time participants were instructed to practice accelerating and braking gently and to practice driving at a consistent speed of 80 and 100 km/h.
After the familiarisation drive, the simulator was configured for the first of the two test drives. Participants were instructed to drive in the left-hand (outside) lane, and to maintain the posted speed limit throughout the drive, with the experimenter providing verbal reminders if participants were observed to deviate more than 5-10 km/h from that speed. Participants were also directed to drive in the left-hand lane at all times and to not change lanes or interact with the traffic in adjoining lanes.
At the end of each test drive, participants completed a modified version of the NASA Raw Task Load Index (NASA-RTLX) (Hart and Staveland, 1988), which assessed, using a rating scale from 0 to 20, subjective ratings of workload for the task of driving alone (baseline condition) or when performing the text messaging tasks. Each experimental session took approximately 1.5 hours, with all testing conducted on weekdays during business hours.
Statistical Analyses Prior to analysis, the data were checked for violations of statistical assumptions, missing data points and outliers, which were excluded from the analysis. In all cases, a two-tailed [Equation or mathematical symbol available in the original paper PDF]-level of .05 was used to determine statistical significance.
RESULTS
Driving performance For the driving performance measures, data were compared across the three driving environments (tunnel, freeway restricted sightlines and freeway unrestricted sightlines), the two speed limits (80 and 100 km/h) and across three merging conditions (non-merge (baseline), merge 1 and merge 2). The two merge segments were between 560 m and 580 m long, commencing 150 m before the end of the on-ramp wall (or equivalent in unrestricted sightline environment) to 60 m past the on-ramp vehicle merge point (where the vehicle that merges in front of the participant’s vehicle reaches the centre point of the left tunnel/freeway travel lane). A non-merging segment of each drive environment of approximately the same distance, curvature and gradient as the merging segments was selected as a baseline comparison.
Mean speed Two 3 (tunnel, fwy unrestricted sightlines, fwy restricted sightlines) by 3 (baseline, merge 1, merge 2) repeated measures ANOVAs were conducted to examine mean speed, one for each speed limit - 80 and 100km/h. For the 80km/h drive, there was a significant drive environment by merge segment interaction (F(4,84) = 10.15, p < .001, η2 = .09) (Figure 2a). For the first merge event, where a merging truck was present, mean speed was significantly slower in the freeway with unrestricted sight lines compared to the tunnel (p < .001) and the freeway with restricted sight lines (p < .001). There were no significant differences in mean speed across the three drive environments for the second merge, where there were only cars merging (F(2,42) = 0.15, p = .901), and for the baseline, non-merge segment (F(2,42) = 2.06, p = .141).
Similar results were found for the 100km/h drive, where there was a significant drive environment by merge segment interaction (F(4,68) = 2.51, p = .049, η2 = .02) (Figure 2b). For the first merge event, where only merging cars were present, mean speed was significantly slower in the freeway with unrestricted sight lines compared to the tunnel (p = .014) and the freeway with restricted sight lines (p = .007). There were no significant differences in mean speed across the three drive environments for the second merge segment, where both cars and a truck were merging (F(2,42) = 2.86, p = .069), or for the baseline non-merge segment (F(2,42) = 0.77, p = .471).
a. b.
Figure 3. Mean speed during the three (a) 80 km/h and (b) 100 km/h merge segments as a function of driving environment
Figure available in the original PDF paper.
Standard Deviation of Speed A 3 (tunnel, fwy unrestricted sightlines, fwy restricted sightlines) by 2 (80km/h, 100km/h) by 3 (baseline, merge 1, merge 2) repeated measures ANOVA was conducted to examined the standard deviation of speed. There was no significant 3-way interaction (F(4,52) = 0.70, p = .592) and no significant speed by environment (F(2,26) = 0.24, p = .792) or merge by environment (F(4,52) = 0.36, p = .835) interactions. There was, however, a significant merge by speed interaction, (F(2,26) = 15.39, p < .001, η2 = .05) (Figure 3). The standard deviation of speed was significantly higher in the 100 km/h drive during all three merging events (all p < .002) and was significantly higher during the first merge event compared to the second merge or baseline for both the 80 and 100 km/h drives (all p < .001). The difference in the standard deviation of speed across the two speed limits was, however, greater during the two merge events, than during the baseline segment.
7
6
5
4
80 km/h
3
100 km/h
SD speed (km/h)
2
1
0
Baseline Merge 1 Merge 2 Merging segment
Figure 4. Standard deviation of speed during the three merge segments as a function of speed limit
Figure available in the original PDF paper.
Standard Deviation of Lane Position The standard deviation of lane position (SDLP) was examined in a 3 (tunnel, fwy unrestricted sightlines, fwy restricted sightlines) by 2 (80km/h, 100km/h) by 3 (baseline, merge 1, merge 2) repeated measures ANOVA. There was no significant 3-way interaction (F(4,72) = 1.54, p = .201) and no significant speed by environment (F(2,36) = 1.65, p = .207) or merge by environment (F(4,72) = 2.22, p = .076) interactions. There was, however, a significant merge by speed interaction, (F(2,36) = 7.23, p = .002, η2 = .02) (Figure 4), whereby the SDLP was significantly higher in the 100 km/h drive compared to the 80 km/h drive during the first (t(22) = 3.25, p = .004) and second (t(22) = 2.46, p = .022) merge events. The SDLP was also significantly higher during the first merge event compared to the second merge and baseline segments for both the 80 and 100 km/h drives (all p < .001). There were no significant differences in SDLP across the 80 and 100 km/h drives for the baseline segment (t(22) = 0.61, p = .546).
0.28
0.26
0.24
0.22
0.2
0.18
SDLP (m)
0.16
0.14
0.12
0.1
Baseline Merge 1 Merge 2 Merging segment
Figure 5. Standard deviation of lane position during the three merge segments as a function of speed limit Human Aspects of Transportation I (2021)
Figure available in the original PDF paper.
Lane Excursions Given the large number of drivers with zero lane excursions, the number of lane excursions was converted to a binary measure (excursion vs. no excursion) and examined using a binary logistic regression, with merge segment, driving environment and speed limit as predictor variables. The overall model was significant (χ 2(5) = 48.79, p < .001), although only merge segment was a significant predictor of whether drivers made a lane excursion during the merging event. Compared to the baseline segment, drivers had over 13 times greater odds of making a lane excursion during the first merge event (46 vs. 5 excursions; Exp B = 13.64) and over 6 times greater odds of a lane excursion during the second merge event (25 vs. 5 excursions; Exp B = 6.26). Further, the odds of drivers making a lane excursion was over two times greater for the first merge event of each driving environment (Exp B = 2.18) compared to the second merge (46 vs. 25 excursions in total).
Time Headway to Lead Merging Vehicle Examining the time headway between the participant’s vehicle and the vehicle that merged in front of the participant’s vehicle provides insight into the forward safety margin that participants allowed during the merging event. One 3 (tunnel, fwy unrestricted sightlines, fwy restricted sightlines) by 2 (80km/h, 100km/h) by 2 (merge 1, merge 2) repeated measures ANOVA was conducted to examine time headway (in secs) to the lead merging vehicle at the point where the merging vehicle crossed the centre of the left travel lane. There was no significant 3-way interaction and no significant drive environment by speed or drive environment by ramp interactions for time headway to merging vehicle. There was, however, a significant speed limit by merge interaction (F(1,18) = 8.075, p = .011), where time headway was similar across the first (1.08s) and second (1.13s) merges in the 80 km/h drive, but lower for the first merge (0.76s) than the second merge (0.96s) in the 100km/h drive.
Brake and Accelerator Pedal Pressure Brake and accelerator pedal pressure was examined to determine if drivers reacted to the merging vehicles by braking or if they adopted a more subtle response of reducing pressure on the accelerator. The number of drivers who braked during each merging segment is displayed in Table 1. As shown, drivers did not brake during the non- merge, baseline segment. During the merging events, a greater number of drivers braked during the first merge event of each driving environment than the second merge, although numbers were too low to perform any statistical analysis. While few drivers braked during the merging events, a greater number of drivers reacted to the merging vehicle by reducing pressure on the accelerator pedal. Therefore, the mean percentage of acceleration pedal position was examined further.
Table 1 Number of drivers (n = 26) who braked during the merging events in the 80 and 100 km/h drives Merge Tunnel Fwy (unrestricted) Fwy (restricted) Speed Limit
80 km/h Baseline 0 0 0 Merge 1 5 6 5
Merge 2 1 1 1 100 km/h Baseline 0 0 0
Merge 1 7 10 9 Merge 2 6 7 5
The mean percentage of accelerator pedal pressure (100% equals maximum pedal pressure) was examined in a 3
(tunnel, fwy unrestricted sightlines, fwy restricted sightlines) by 2 (80km/h, 100km/h) by 3 (baseline, merge 1, merge 2) repeated measures ANOVA. There was no significant 3-way interaction (F(4,72) = 0.33, p = .855) and no significant speed by environment (F(2,36) = 2.26, p = .119) or merge by environment (F(4,72) = 0.82, p = .520) interactions. There was, however, a significant merge by speed interaction, (F(2,36) = 58.13, p < .001, η2 = .02) (Figure 5). Post-hoc tests revealed that the mean percentage of accelerator pedal pressure was stable across the three merging segments for the 80 km/h drive (F(2,44) = 2.64, p = .083), but was significantly lower compared to baseline during both merging events in the 100 km/h drive (both p < .001), suggesting that drivers reduced pressure slightly on the accelerator during these merge events to moderate their speed.
29
27
25
23
80 km/h
21
100 km/h
19
Mean % Accelerator Pedal Pressure
17
15
Baseline Merge 1 Merge 2 Merging segment
Figure 6. Mean percentage of accelerator pedal pressure during the three merge segments as a function of speed limit
Figure available in the original PDF paper.
Eye Glance Behaviour Glances to merging traffic
The mean number of fixations to the merging traffic under each condition is displayed in Table 2. As there was a large number of drivers who did not fixate on the merging vehicles, these data were converted to a binary measure (looked vs. did not look) and examined using a binary logistic regression, with merge segment, driving environment and speed limit as predictor variables. The overall model was not significant (χ 2(4) = 4.61, p = .330), indicating that the odds of drivers looking at the merging vehicles did not differ significantly across the driving environments, merging events or speed limits. To explore drivers’ glance behaviour to the merging vehicles further, the distance from the start of the merge segment to the first glance at the merging traffic and the mean duration of glances to merging vehicles, were examined for those drivers that did fixate on the vehicles.
Table 2 Mean number of glances to the merging vehicles in the 80 and 100 km/h drives Merge Tunnel Fwy (unrestricted) Fwy (restricted) Speed Limit
Mean (SD) distance to first glance A GEE model was fitted to examine if the distance from the start of the merge segment to the first glance at the merging traffic differed across the driving environments, merging events and/or speed limits. The model was specified with a normal error distribution, an identity link function and an unstructured correlation matrix. Results revealed no significant 3-way interaction and no significant drive environment by speed or drive environment by merge interactions. There was, however, a significant speed limit by merge interaction (Figure 6; p < .001), whereby the distance travelled within the merging segment before drivers glanced at the merging traffic was shorter in the 80 km/h drive than the 100 km/h drive for the first merge event. However, the distance to first glance was shorter in the 100 km/h drive compared to the 80 km/h drive for the second merge event.
160
150
140
130
120
80 km/h
110
100 km/h
100
90
80
Distance (m) to first glance at merging vehicles
70
Merge 1 Merge 2 Merging segment
Figure 7. Mean distance (m) to first glance at merging traffic across merge segments and speed limits Mean duration of glances to merging traffic
Figure available in the original PDF paper.
A GEE model was fitted to examine if the mean duration (msecs) of glances to the merging traffic differed across the driving environment, merging events or speed limits (see Table 3). The model was specified with a normal error distribution and an identity link function. An unstructured correlation matrix was first used, but model convergence problems were encountered; thus, the model was re-run using an exchangeable correlation matrix. No significant interactions or main effects were found, suggesting that the duration of glances to the merging vehicles did not differ across the driving environments, merge events or speed limits.
Table 3 Mean duration (msecs) of glances to the merging vehicles in the 80 and 100 km/h drives Merge Tunnel Fwy (unrestricted) Fwy (restricted) Speed Limit
Subjective Workload A one-way repeated-measures ANOVA with a Greenhouse-Geisser correction was run to examine differences in overall workload ratings across the four driving environments (tunnel 80 km/h, tunnel 100 km/h, freeway 80 km/h, freeway 100 km/h). Overall workload score did not differ significantly across the four driving environments (F(1.49, 31.40) = 1.819, p = .185), although there was a trend for workload to be higher in the 100 km/h drive and slightly higher in the tunnel compared to the freeway.
Table 4 Mean (SD) overall subjective workload score (max 20) across driving environments and speed limits
Tunnel Fwy 80 km/h 7.75 (3.6) 6.8 (3.2)
100 km/h 8.2 (3.6) 8.0 (3.7) Note: One NASA scale was filled in for both freeway segments combined given that explaining the difference between each environment (sightlines) might have affected subsequent behaviour
DISCUSSION
This study examined the effect on driver behaviour of restricted sightlines at on-ramps in tunnel and freeway environments. Of further interest was how the prevailing speed limit may moderate the effect of the restricted sightlines on merging issues.
Results suggest that when sight lines were not restricted on the freeway, drivers reduced speed during the first merge event only. As this same pattern was found for both speed limits (across which the appearance of the truck was counterbalanced for the two on-ramps), it appears that the reduction in speed is related to on-ramp order and not the presence or absence of the truck during the merging events. For the tunnel and freeway with restricted sight lines, there were no significant differences in mean speed across the merge segments, although even in these environments there was a trend for drivers to reduce speed at the first on- ramp. This suggests that drivers approached the first on-ramp of each segment cautiously as evidenced by a reduction in speed, with such behaviour particularly pronounced when greater sight lines allowed drivers more opportunity to adapt their speed to the merging traffic. By the second on-ramp, mean speed has increased (albeit not to baseline levels) suggesting that drivers may have been more familiar with the merging situation and approached it with less caution. The braking data confirm that a greater number of drivers braked during the first merging event compared to the second merge. From the accelerator pedal pressure results it appears that, rather than brake on the second merge, a greater number of drivers elected to simply ease pressure off the accelerator, at least in the 100 km/h drive, again suggesting that drivers adopted a less cautious approach to the second merging event. Standard deviation of speed and SDLP were significantly higher in the 100km/h drive compared to the 80 km/h drive and significantly higher during the first merge of each segment regardless of speed zone. Likewise, time headway to the lead merging vehicle was similar across the first and second merges in the 80 km/h drive, but lower for the first merge than the second merge in the 100km/h drive. Taken together, these findings suggest that driving performance was affected to a greater extent at the first merge of each driving environment than the second merge, but also suggests that the higher speed limit may further exacerbate these effects. During the merging events, drivers were far more likely to make a lane excursion than during the non-merge segment of the drive, suggesting that one of the behavioural responses to the merging traffic was to swerve out of the travel lane. Further, the odds of drivers making a lane excursion was over two times greater for the first merge event than the second merge, regardless of driving environment or speed limit. Neither the odds of glancing at the merging traffic or the duration of glances to the merging vehicles differed significantly across the driving environments, merge events or speed limits. For the distance to first glance at the merging traffic there was a significant speed limit by merge interaction. The distance to first glance was shorter in the 80 km/h drive for the first merge event (where the truck was present), but was shorter in the 100 km/h drive for the second merge event (where the truck was present). Interestingly, these results suggest that, for those drivers who looked at the merging vehicles, they did so faster when there was a truck present on the on-ramp than when there were only cars merging. However, the presence of a merging truck did not change the odds of drivers looking at the merging traffic, nor the length of time they glanced at them. There were no significant differences in the drivers´ subjective workload, although there was a trend for workload to be higher in the tunnel and in the 100km/h speed zone.
Overall, it appears that driving environment and the restricted sight lines played a limited role in drivers’ behavioural response to the merging vehicles. While there was some evidence that drivers may have had more opportunity to adapt their speed to the merging traffic on the freeway with greater sight lines, overwhelmingly, it appears that merge order and speed limit played a greater role in affecting drivers’ behaviour. The data indicate that driving performance was affected to a greater extent for the first merging event of each drive environment, possibly because of the unfamiliarity of the event, and that the higher speed limit appears to exacerbate these deleterious effects.
REFERENCES
Hart, S.G., Staveland, L.E. (1988), Development of NASA- TLX (task load index): results of empirical and theoretical theoretical research. In: Hancock, P.A., Meshkati, N. (Eds.), Human Mental Workload. Elsevier, Amsterdam, North Holland. Patten, C.J.D., Mårdh, S., Ceci, R.L. (in press), Stockholm bypass tunnel – merging traffic study. Technical report, ViP
publication. Rudin-Brown, C.M.,Young, K.L., Patten, C.J.D., Lenné, M.G., Ceci, R.L. , Driver distraction in an unusual environment: Effects of text-messaging in tunnels. Accident Analysis and Prevention, 50, 122-129. STA, 2013. The Stockholm bypass, from http://www.trafikverket.se/thestockholmbypass (retrieved 15.10.13). Seeing Machines 2007. faceLAB 4. Acton, ACT, Seeing Machines.
LISTED IN THE AHFE DIGITAL BOOKSTORE CATALOGUE
Explore the complete digital volume
Advances in Human Aspects of Transportation: Part I
Read this individual research paper free through the original publisher, or explore the full digital proceedings book.
ISBN 978-1-4951-2097-8
Explore this ISBN in the AHFE Bookstore ↗Listed in the July 2026 bookstore catalogue; search by ISBN to confirm current availability · Digital book purchase optional