Designing hospital modernisation projects is both a challenge and a necessity in view of the rapid development of medical technologies and treatment processes. In addition, ageing populations are driving an increasing demand for medical services. The quality of space has been proven to support treatment processes and the pace of patient recovery, as well as the comfort of staff and the organisational and economic efficiency of the hospital. It is therefore advisable to make very conscious investment decisions. A precise and objective assessment of the existing condition, including, above all, functional and spatial solutions, is very important in hospital modernisation processes. New technologies often necessitate changes to the existing functional layout, and sometimes the existing layouts are not without flaws. However, hospitals are highly complex facilities, where change management requires decision-making support and adequate tools.Research has demonstrated the applicability of mathematical graph theory to describe complex functions and the interrelationships between them, taking into account the lighting of selected rooms.Treating the functional layout of a building as a discrete structure with connections, i.e. as a simple graph, is a natural (though often unconscious) practice in the work of an architect. However, thinking of such a structure of connections as a dual graph to a certain flat graph provides additional opportunities for a deeper understanding of the ambiguous relationship between the functional layout of a building and its floor plan. This way of visualising data on the desired adjacencies of rooms, which in hospitals result from the necessary safety conditions and optimisation of medical processes through efficient space, shows enormous potential for supporting design decisions.The adopted method combines architecture and mathematics in a visual way, using graphs and matrices to illustrate the existing relationships between rooms.
In the face of dynamic changes in the healthcare system, the primary objective of this article is to demonstrate that the mathematical graph method can effectively support the modernization of existing hospitals. The modernization of service facilities, particularly hospitals, presents architects with a series of challenges related to their specific characteristics and functional requirements. Many hospitals built in the 1960s and 1980s have reached the limits of their usability. The increasing demand for healthcare services and changes in the organization of medical care mean that current functional layouts no longer meet the needs of patients. Modern facilities, such as the Received February 5, 2026; Revised April 5, 2026; Accepted April 24, 2026; Available online July 20, 2026
Designing Hospital Modernisation Using Mathematical Graph Methods 161 New North Zealand Hospital in Hillerød, Denmark, with 600 beds, and the New Karolinska Solna in Stockholm, with 630 beds, illustrate the latest trends in hospital construction that emphasize flexibility and adaptability to changing health needs.
The graph method, as an analytical tool, enables the understanding of functional layouts within individual hospital departments. Each department should be treated as a separate unit, which facilitates the identification of internal connections and interactions. This method allows for the development of effective solutions that will address future needs in the healthcare system. The increasing demand for investments in hospital facilities encourages the intensification of research and publications on hospital design. In Poland, many works have emerged, such as “The Hospital of the 21st Century – Design and Infrastructure Solutions,” which serve as significant sources of knowledge about modern solutions in hospital architecture. Michał Tomanek, in his publication “Improving Treatment Efficiency and Reducing Operating Costs through Proper Design of Healthcare Facilities,” emphasizes that the design of healthcare facilities aims to create optimal conditions for the implementation of medical procedures.
Despite the increasing number of studies, the literature lacks an analysis of the benefits of representing hospital rooms as vertices in a graph, with connections between them as edges. This approach could significantly impact the efficiency of design and spatial organization in hospitals.
The research objective of the authors of this text is to present the relationships in the functional layout of hospital departments intended for modernization. The aim is to encourage architects to utilize this method as a helpful tool for creating new layouts from existing structures. However, these layouts should not be treated as the entirety of the hospital, as an overly large scale could render them unclear.
The article presents the graph method using the example of the Emergency Department (ED). It is assumed that if it proves effective for the most diverse and complex department, it will be applicable to all cases of hospital space modernization.
MODERNIZATION OF FUNCTIONAL SYSTEMS IN HOSPITALS USING THE GRAPH METHOD The analysis focused on the functional layouts of hospitals in Poznań, an academic center with a highly qualified medical staff, renowned clinics, hospitals, and a century-old medical university, employing specialists with experience gained abroad. Recent investments, such as the construction of the Greater Poland Pediatric Center with nine departments, a modern Emergency Department (ED) for children, and 350 beds, as well as the ongoing construction of the Central Integrated Clinical Hospital with 900
beds, merging three existing hospitals, have made Poznań one of the leading medical centers in Poland and even Europe.
The history of healthcare in Poznań dates back to the 12th century, with some sources suggesting even the 10th century. In medieval Europe, hospitals combined care for the sick and the poor, while also isolating individuals with infectious diseases. In Poland, various types of facilities existed in the 12th century, including foundling homes, leper hospitals, and elderly shelters. In 1775, the state took over the administration of hospitals, contributing to the further professionalization of the healthcare system.
In the second half of the 19th century, the first hospitals in the modern sense began to emerge. The first hospital, dedicated to the Transfiguration of the Lord, was opened in 1823, followed by the establishment of a municipal hospital at the intersection of Szkolna and Kozia streets in 1833. In 1877, the first children’s hospital was founded, marking a significant step toward specialization in healthcare.
Currently, Poznań has 24 hospitals, including five clinical hospitals, three municipal hospitals, seven private hospitals, and one departmental hospital belonging to the Ministry of Internal Affairs and Administration. The research also utilized data from the Department of City Development and International Cooperation of the Poznań City Hall, indicating a 9% increase in the number of doctors from 2019 to 2023. The history of healthcare in Poznań reflects the evolution of the healthcare system, from simple care facilities to modern medical institutions that meet high standards and the demands of contemporary medicine.
Modernizing existing hospital structures often proves to be more challenging than executing new projects. Although any space can be transformed, a new-old concept rarely matches the quality of one designed from scratch.
This study focused on two emergency departments: the newly constructed Central Integrated Clinical Hospital and the Strus Municipal Hospital. The graph method was used to analyze the functional layouts. A graph, as a mathematical structure, allows for the representation and examination of relationships among elements. The graph was defined as a set of vertices connected by edges, and concepts such as planar graph, flat graph, and dual graph were introduced. This methodology enabled an understanding of the complexity of interactions within hospitals and highlighted potential areas for changes in their functional layouts.
The layout of a given department in the hospital is transformed into diagrams, which become vertices connected by edges. An analysis is then conducted, along with drawing conclusions. This process facilitates a better understanding of the functional layout of the department and helps identify areas that require changes.
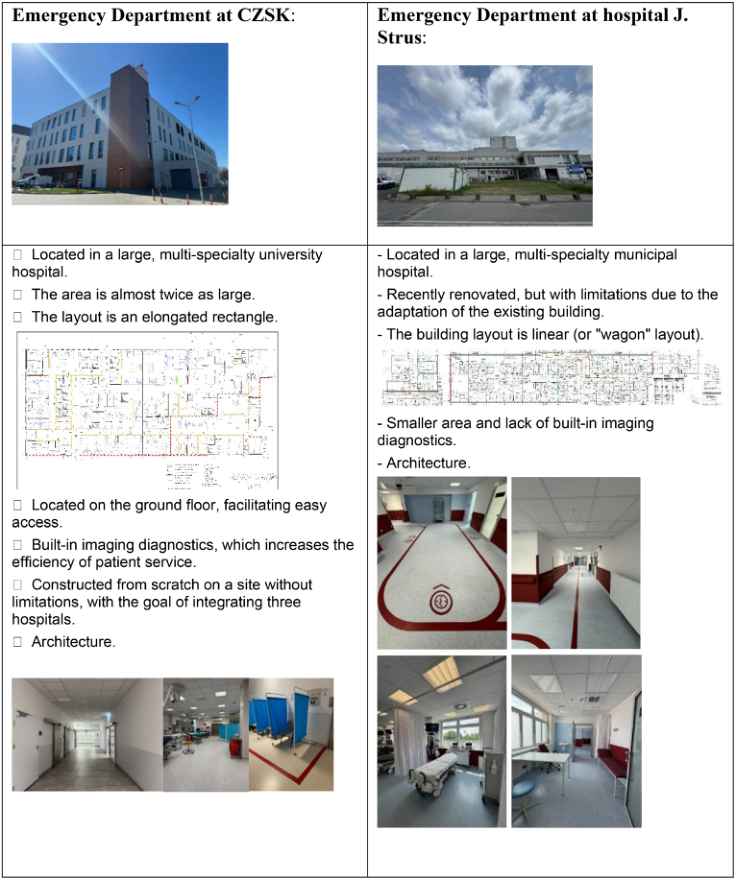
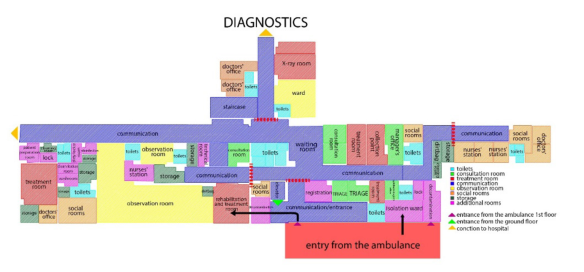
Figure 1: Comparison of emergency departments.Figure 2: Diagram of the emergency department at the Józef Struś multi-specialty municipal hospital.
The Emergency Department at the Józef Strus Municipal Multi-Specialty Hospital has undergone a thorough renovation, presenting a modern and cohesive space. The department is located on the first floor, requiring patients to use the elevator, while ambulances have direct access to the ramp. In front of the entrance, there is a registration area and two triage rooms. To the right, there is an isolation room with direct access for ambulances. After triage, patients are directed to the waiting area, where clear communication on the floor facilitates movement. The proximity of diagnostic facilities ensures efficient patient service. In case of a sudden deterioration in a patient’s health during triage or after being brought in by ambulance to the resuscitation and treatment room, there is a quick route from the triage entrance through decontamination to the observation room, which is quite large for the overall size of the Emergency Department.
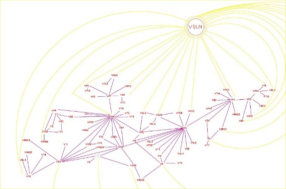
Figure 3: Graph connection.
Most rooms have more than one connection. The layout with connections appears cohesive and balanced. However, the situation changes when we look at the graph. We see many vertices with dense connections and several areas poorly lit by natural light. Long corridors force medical staff to take extended walks, leading to wasted time.
In the context of modernizing the hospital, as opposed to designing a new facility, altering the building’s structure is challenging. This necessitates creating the best possible functional layout within the existing conditions. The graph allows us to conduct additional analyses essential for improving connections within the Emergency Department’s structure.
Notably, there is a very high concentration of functions in corridors VK1 and VK6, indicating that these areas are heavily utilized. The high traffic intensity in these corridors also affects medical staff’s working comfort, which can, in turn, impact the quality of care provided. Additionally, there is noticeable congestion near the observation room, a critical area where patients require constant attention; a large number of people and equipment can lead to chaos and difficulties in managing crisis situations.
Another important point is the presence of intersecting edges, indicating a lack of logical connections between rooms. Ultimately, identified errors in the functional layout can have serious consequences for the entire hospital, affecting staff response times, operational efficiency, and patient satisfaction. Therefore, these observations, if not considered during modernization, can significantly impact response times, operational effectiveness, and patient satisfaction.
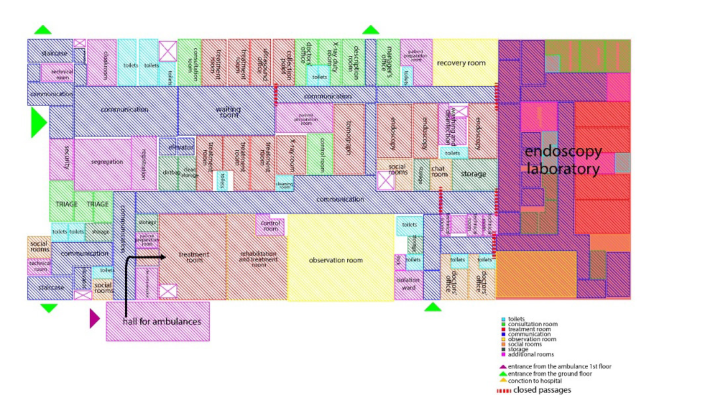
Figure 4: Diagram of the emergency department of the central integrated clinical hospital (CZSK).
On the ground floor of the Central Clinical Hospital, the Emergency Department comprises 33% of the total area dedicated to circulation. This area includes 69 rooms, consisting of 13 treatment rooms, 9 offices, and 15 restrooms. The Emergency Department has been designed logically, with clearly defined communication paths, waiting areas, and designated zones for ambulances. The “dirty” area flows smoothly into the “clean” area, which is also marked on the floors.
In the clean corridors, temporary patient areas have been designated. Unfortunately, these temporary patients are exposed to contact with critically ill patients due to their proximity to the resuscitation and treatment room. The treatment rooms do not have dedicated restrooms, which leads to additional time losses for medical staff. The proximity of imaging diagnostics, operating rooms, and the helicopter landing pad on higher floors provides a clear functional layout. However, significant shortcomings have been identified, such as the lack of separate communication from the treatment room and excessive space in the entrance hall, which serves no purpose.
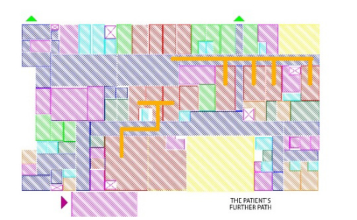
Figure 5: Paths of patients and medical staff.
In the clinical hospital, two patient streams are distinguished: those arriving independently through the waiting area and those transported medically. The transition from the ambulance to the treatment room is short and clear.
The independent patient route (marked in blue) is brief, ending at the waiting area. Their further journey (marked in orange) depends on the physician who will recommend specific tests or direct them to the resuscitation and treatment room. The medical staff’s pathway follows a separate route, distinct from that of the patients. Imaging diagnostics are located within the Emergency Department.
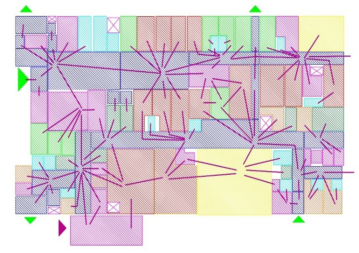
Figure 6: Graph connection.
In the Central Integrated Clinical Hospital (CZSK), the analysis of spatial connections reveals significant information regarding the organization of patient and staff movement. Identifying the paths with the highest usage intensity highlights the area’s most frequently utilized in daily communication, which is crucial for the department’s operational efficiency.
The areas with the highest traffic, referred to as the “most trodden,” serve as key communication routes, enabling quick access to essential medical zones. Conversely, waiting areas function as stopping points where patients and their families await further actions. These spots also act as transitional points, which can lead to congestion.
An interesting case is the acute treatment zone in the Emergency Department and the post-treatment observation area, both of which have more than two connections. This indicates their critical role in the hospital’s structure and intense interaction, which is vital for ensuring quick access to necessary resources.
The congestion in the nearly clean corridor (VK4) indicates a large or long space, potentially causing communication difficulties. Notably, the Emergency Department is a specific unit where virtually clean corridors do not exist. The same applies to the VK2 communication, which is considered the “dirty” area. The concentration of edges with vectors generates large spaces and high foot traffic.
The presence of intersecting edges signals potential design flaws that may complicate movement. Treatment and triage rooms lacking natural light, where medical staff spend extended periods, can negatively affect
Designing Hospital Modernisation Using Mathematical Graph Methods 167 work comfort. It is also worth noting the lack of connections between the ambulance communication (VSIEN) and the entrance (VK1), which prevents the mixing of patient streams arriving on foot with those from ambulances.
The entire structure of the hospital appears very extensive, emphasizing the importance of properly designing the space to ensure efficiency and comfort for both patients and medical staff.
The entrance communication (VK) is located in an area that includes segregation, registration, and the waiting area (VPO). The waiting area connects to five treatment rooms and preparation booths for patients before CT and X-ray examinations. This accumulation of edges leads to significant crowding in this area, which can negatively impact patient comfort and service efficiency.
From a design perspective, the current structure of the waiting area requires modernization to reduce the number of connections to treatment rooms. Future changes should focus on alleviating the waiting area of excessive edges, allowing for better traffic organization and reducing congestion.
The issue of natural lighting also requires attention. In some cases, there are opportunities to improve natural light in the waiting area and its surroundings; however, not all areas can be adequately illuminated with the current layout. Therefore, actions should be taken that consider both communication efficiency and patient comfort, which is a key element of future investments in the hospital’s infrastructure.
CONCLUSION
Analyses of layouts in the Central Integrated Clinical Hospital and the Multi-Specialty Municipal Hospital, by converting them into diagrams, edges, and vertices, provide significant insights into the structure of hospital departments, including emergency departments, which are among the most complex to operate. Good connections do not form by chance; they require in-depth analysis, in which graph methods prove to be extremely helpful.
Each room within the studied area can be treated as a vertex, while each connection between two vertices constitutes an edge. Based on this, research objectives can be established, focusing on whether graph methods enable architects to modernize hospital departments and identify weak connections.
The thesis states that graph methods allow for effective analysis of functional layouts in hospitals and support design decision-making, highlighting the relationships between individual units and effectively pinpointing weaker points in the analyzed system. In 1985, Robinson and Janjic demonstrated that given a functional layout with specified room areas and a maximum external graph as an outline, any convex polygon with the correct area can be divided into convex rooms that meet both adjacency and area requirements.
Thus, spatial analysis using graph methods is crucial for understanding movement dynamics in hospitals and optimizing processes, contributing to improved patient service quality. Therefore, modernization based on this mathematical method can yield the best results. Contemporary hospital modernization is a complex process that should be based on multiple factors,
including staff and patient participation, analysis of existing examples—both successful and unsuccessful—and, most importantly, thorough analysis. A key element in this analysis is the creation of diagrams using graph methods, which allows for a comprehensive view of errors, congestions, poor connections, and missing elements in the existing layout. Investing time in this analysis is worthwhile, as hospital modernization does not occur every decade, but much less frequently. The revised structure must be meticulously crafted to avoid being the result of a momentary impulse, but rather a product of well- considered decisions regarding each change.
Of course, one limitation of this process is the time needed for detailed analysis; however, this investment yields benefits in the form of better organization and operational efficiency of the hospital. The authors do not perceive limitations within the graph method itself, suggesting that it is a tool with significant potential for practical application, contributing to effective modernization and optimization of functional layouts in hospitals.
ACKNOWLEDGMENT
I would like to express my gratitude to Professor Gawlak and Doctor Rumież for their guidance, academic encouragement, and friendly critique. Their attitude and care have helped me to complete this article.
REFERENCES
Chronicle of the City of Poznań (2007) Hospital J. Wojciechowski, K.Pieńkosz (2016) Graph and networks Kumar, A. ., Dutta, K. ., Srivastava, A. (2023). “Generating Automated Layout Design using a Multi-population Genetic Algorithm. Journal of Web Engineering”, 22(02). Kumar, V., Shekhawat, K. (2024). “Uniqueness of rectangularly dualizable graphs”,
Communications in Combinatorics and Optimization. Liu J., Qiu Z., Wang L., Liu P., Cheng G., Chen Y. (2024). “Intelligent floor plan design of modular high-rise residential building based on graph-constrained generative adversarial networks”, Automation in Construction, Volume 159. Shekhawat K., Lohani R., Dasannacharya C., Bisht S., Rastogi S. (2023). “Automated
Generation of Floorplans with Non-Rectangular Rooms.” Graphical Models 127:101175. https://doi.org/10.1016/j.gmod.2023.101175. Wang L., Liu J., Zeng Y., Guozhong Cheng G., Hu H., Hu J., Huang X., (2023) “Automated building layout generation using deep learning and graph algorithms, Automation in Construction”, https://doi.org/10.1016/j.autcon.2023.105036. Weber R., Mueller C., Reinhart C. (2022). “Automated floorplan generation
in architectural design: A review of methods and applications, Automation in Construction”, https://doi.org/10.1016/j.autcon.2022.104385. Złotkowska A., Piotrowski M. (2022). “21st century hospital - design and infrastructure solutions”.
LISTED IN THE AHFE DIGITAL BOOKSTORE CATALOGUE
Explore the complete digital volume
Human Factors in Architecture, Sustainable Urban Planning and Infrastructure
Read this individual research paper free through the original publisher, or explore the full digital proceedings book.
ISBN 979-8-950676-05-5
Explore this ISBN in the AHFE Bookstore ↗Listed in the July 2026 bookstore catalogue; search by ISBN to confirm current availability · Digital book purchase optional