Georgios Papaioannou, Barys Shyrokau (2026). Does the testing environment matter? Carsickness across on-road, test-track, and driving simulator conditions. In: Advances in Human Factors of Transportation. AHFE Open Access, vol. 224, pp. 300–309. https://doi.org/10.54941/ahfe1007858
Carsickness has gained significant attention with the rise of automated vehicles, prompting extensive research across on-road, test-track, and driving simulator environments to understand its occurrence and develop mitigation strategies. However, the lack of carsickness standardization complicates comparisons across studies and environments. Previous works demonstrate measurement validity between two setups at most (e.g., on-road vs. driving simulator), leaving gaps in multi-environment comparisons. This study investigates the recreation of an on-road motion sickness exposure - previously replicated on a test track - using a motion-based driving simulator. Twenty-eight participants performed an eyes-off-road non-driving task while reporting motion sickness using the Misery Scale during the experiment and the Motion Sickness Assessment Questionnaire afterward. Psychological factors known to influence motion sickness were also assessed. The results present subjective and objective measurements for motion sickness across the considered environments. In this paper, acceleration measurements, objective metrics and subjective motion sickness ratings across environments are compared, highlighting key differences in sickness occurrence for simulator-based research validity. Significantly lower motion sickness scores are reported in the simulator compared to on-road and test-track conditions, due to its limited working envelope to reproduce low-frequency (<0.5 Hz) motions, which are the most provocative for motion sickness.
The engagement in non-driving related tasks (NDRT) is expected to be at the forefront for the wide acceptance of automated vehicles. However, all the envisaged designs of AVs are expected to provoke carsickness and discomfort. Yet, major challenges remain to address carsickness in AVs. Extensive research with human experiments is being carried out in different testing environments to understand the occurrence of carsickness and eventually develop countermeasures to mitigate it in the context of AVs (Papaioannou et al., 2025). However, comparison studies across testing environment are scarce, and limit the standardization of carsickness studies (Bos et al., 2022), making eventually difficult to compare results between different testing environments. This study focuses on comparing carsickness across testing environments.
Does the Testing Environment Matter? Carsickness Across On-Road 301 Testing environments for carsickness need to balance two requirements: replicability and realism. The motion stimulus shall be maintained as similar as possible across participants and conditions, especially different countermeasures are tested or passenger monitoring/observation over the ride is conducted. Common testing environments for carsickness research are driving simulators, test-tracks, or public roads, which achieve different compromises among these requirements. Simulators even employed with advanced motion cueing algorithms (Khusro et al., 2020), have been shown to provoke different MS levels compared to on-road driving (Dam et al. (2024), Mühlbacher et al. (2020), Talsma et al. (2023)). However, they provide high replicability and repeatability within-subjects. On-road and test-track experiments assess carsickness more realistically, but other disadvantages occur. Even with trained drivers or fully automated vehicles, driving behavior in public road studies is not consistently reproducible due to unexpected dynamic events (vulnerable road users, other vehicles, traffic lights etc.). Despite their high-risk, on-road studies are very costly and risky due to accidents probability. At the same time, test-tracks are a feasible solution since they allow higher replicability than on-road studies. However, test-tracks are not accessible to all researchers while they are relatively expensive. Recently, building upon motion planning methods to mitigate motion sickness (Jain et al., 2023; Htike et al., 2021), Harmankaya et al. (2025) developed a method which effectively replicated on-road sickness exposure in a compact test track. This method aimed to cancel the costs and the need for large test-tracks for motion sickness experiments. Pham Xuan et al. (2025) used this method to compare the methodological aspects of carsickness assessment and its modulating factors in two different testing environments (test-track and on-road). This paper extends this work further by exploring the carsickness assessment in a driving simulator compared to on-road and test-track.
One of the primary advantages of simulators is their capability to reproduce scenarios that are difficult or unsafe to evaluate in real-world driving conditions. They are intensively used for investigating vehicle dynamics, human-machine interaction, and driver behavior under controlled and repeatable conditions. For example, for steering feel evaluation, allowing detailed assessment of steering system tuning, on-center behavior, and subjective handling characteristics without the need for extensive road testing (Shyrokau, 2018). They also play a key role in the development and validation of advanced driver assistance systems, enabling safe testing of critical scenarios and control strategies (Rossi, 2020). Over the last decade, driving simulators have increasingly been adopted for motion sickness and comfort studies (Aykent, 2014), as they provide a controlled environment for systematic investigation of sensory conflicts and human perception. within a safe, controlled, and repeatable environment.
This paper is structured as follows: firstly, the methods of the experiment are explained, secondly the results are presented and discussed, and finally conclusions are extracted.
METHODS
Ethics statement: The study is approved by the Human Research Ethics Council of Delft University of Technology (Delft, The Netherlands; application number 5751). All participants gave their written informed consent before participation in the study.
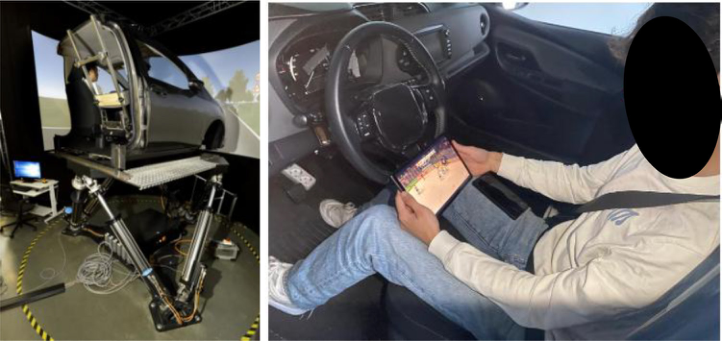
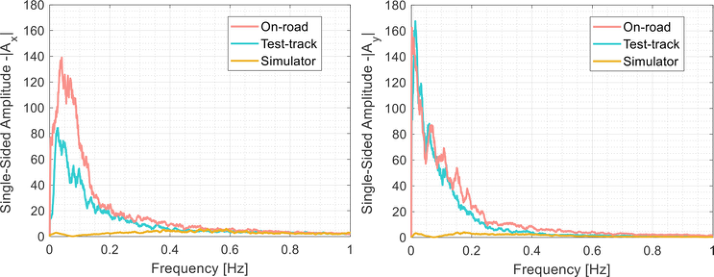
Stimulus: The experiment was conducted in Delft Advanced Vehicle Simulator (DAVSi) (Khusro et al. (2020) (Figure 1). The on-road drive recorded by Harmankaya et al. (2025) was replicated in DAVSi, by providing the longitudinal and lateral accelerations from the on-road experiment. DAVSi translated these to feasible accelerations within the simulator using an adaptive washout filter-based Motion Cueing Algorithm (MCA) [E2M Technologies, 2019]. The accelerations from the on-road, the test-track (as resulted by Harmankaya’s et al. (2025) method), and the simulator are presented and compared in Figure 2, as analysed in the frequency domain. The acceleration spectrum in the simulator signal exhibits lower amplitude in the lower frequencies, which are the most provocative for motion sickness.
Figure 1: (left) Delft Advanced Vehicle Simulator (DAVSi) (right) participants’ posture while being driven in the experiment.Figure 2: Power spectral density [m/s2Hz] of unweighted (left) longitudinal (Ax), and (right) lateral accelerations (Ay).
Does the Testing Environment Matter? Carsickness Across On-Road 303 Procedure: Prior to the experiment, the participants were informed about the general aim of the study and gave their written consent. Then, participants filled out a pre-drive questionnaire consisting of: Part 1: Anthropometrics, Part 2: Self-Assessment Manikin (SAM) questionnaire (Bradley and Lang, (1994)), and Part 3: Motion sickness assessment questionnaire (MSAQ) (Gianaros et al., 2001). Thereafter, the experimental session commenced. Participants gave their carsickness level on the MISC every minute. After reaching the end of the path or after stating a MISC level of 6 or higher, the experiment was terminated. Thereafter, participants filled out a post- drive questionnaire 3, which consisted of Part 1: SAM questionnaire, Part 2: Comfort (2.1 MSAQ, 2.2 Acceptance (Van Der Laan et al., 1997), 2.3 ARCA (Marberger et al., 2022)), Part 3: Trust and Part 4: Perceived Safety (Nordhoff et al., 2021). More details about the questionnaires are provided in detailed in Pham Xuan et al. (2025), whose experimental design was replicated in this work with minor modifications. The analysis of the psychological data is part of further work.
All participants were engaged in a video watching activity. More specifically, we used two videos from the same genre on a tablet held with the hands on the lap. Both videos depicted sporting events (a tennis and an ice-hockey game) to arouse similar emotional levels. To ensure and assess the participants engagement on the NDRTs, the videos were edited and included unexpected events. More specifically, a ball overlapped the tennis ball or hockey puck at random moments. The participants were required to count these events to verify their engagement in the NDRT. In total, sixteen events took place in both videos until the 25th minute.
Participants: For the selection of participants, the short Motion Sickness Susceptibility Questionnaire (MSSQ) is used. The overall MSSQ-Short Score as well as the item regarding the experience of carsickness in the past ten years were weighted equally to assess the current theoretical susceptibility to carsickness. Depending on this score, participants were assigned to one of five categories, as described in Pham Xuan (2023).
Participants from categories B, C, D and E are invited to the experiment. Gender balanced is attempted. The average susceptibility of simulator participants is 12.4 ± 10.4, compared to 13.0 ± 6.0 for test-track/on-road participants. The mean MSSQ scores between the experiments showed no significance using the Welch t-test (p = 0.783). In the current study, 28 participants joined, of which 15 identify as male, 11 female and 2 non- binary/third gender. The mean age of the participants was 22 ± 2.2 years. The on-road and test-track experiments had the same group of participants, consisting of 47 participants, of whom 29 identify as male, 17 female and 1 non-binary/third gender. The mean age of the participants in this study was 28 ± 13 years. Their focus level over the NDRT during the ride was similar in both conditions and relatively high. More specifically, the participants counted on average 16.54 out of 20 events in total during experiment.
Dependent variables: To measure carsickness during the actual experimental rides, the misery scale (MISC by Bos et al., 2005) was used. Participants were asked to verbally give their subjective motion sickness rating on the MISC
304 Papaioannou and Shyrokau scale once every minute. If participants reached a value equal to 6 (little nausea) or higher, the experimental session was terminated immediately. This was done due to ethical concerns. To analyse the MISC ratings between the conditions, the same procedure as Pham Xuan et al. (2025) was implemented.
Statistical analysis: A mixed-design ANOVA was conducted to assess the effects of the experimental condition (Between-Subjects factor: Simulator vs. Test-track, Simulator vs. On-road) and time (Within-Subjects factor: 0–25 minutes) on MISC scores. Mauchly’s test was used to evaluate the assumption of sphericity in the MISC Data. As the assumption was violated (p < 0.05), Greenhouse-Geisser corrections were applied to the degrees of freedom for the within-subjects’ effects. To identify the specific onset of divergence between conditions, post-hoc analysis was performed using series of independent Mann-Whitney U tests (rank-sum tests) at each minute. This non-parametric approach was selected due to the ordinal nature and non-normal distribution of MISC scores. Statistical significance was defined as p < 0.05, with multi-level significance indicated as follows: *p < 0.05, **p < 0.01, and ***p < 0.001.
RESULTS
Objective data analysis: For, the comparison of the two experiments, we explore the calculation of Motion Sickness Dose Value (MSDV) based on ISO-2631 (1997) and similarly with Harmankaya et al. (2025). The MSDV is calculated for all conditions: on-road, test-track and simulator. The MSDV in the Simulator condition is almost 9-10 times lower than the On-road and Test-track conditions. This difference in the MSDV is caused by the high differences identified in the low-frequency accelerations, which are the most provocative to carsickness. Despite these differences in MSDV, the analysis of the subjective motion sickness data is important to explore how the signal has perceived by the participants.
Combined MSDV: Simulator vs On-Road vs Test-Track
MSDV (m 1.5 /s 2 )
5
0
Time (min)
Figure 3: The calculation of the MSDV [m1.5/s2] for on-road, test-track and simulator data. The calculation was conducted based on ISO-2631 and as Harmankaya et al. (2025).
Figure available in the original PDF paper.
Does the Testing Environment Matter? Carsickness Across On-Road 305 Subjective data analysis: In this section, the MISC values are plotted and analysed per condition (Figure 4). The mean MISC values across all participants per condition are examined are plotted over the time of the experiment. By the end of the experiment, the mean maximum MISC values are 2.74 for the on-road condition and 2.34 for the test-track condition, compared to only 1.07 for the simulator. This is a reduction difference of ~61 % (towards on-road) and ~54 % (towards test-track). According to the linear mixed-effects (LME) model, the main effect of Environment was not statistically significant (F[2, 3712] = 1.47, p = 0.229, np
2 = .001). However, a highly significant main effect of Time was observed (F[1, 3712] = 155.71, p < .001, np 2 = 0.040), indicating a general progression of motion sickness symptoms across the sessions. Crucially, a highly significant Environment x Time interaction was confirmed (F[2, 3712] = 73.60, p < .001), demonstrating that the rate at which motion sickness developed over time was heavily dependent upon the specific testing environment. Based on Table 1 and Figure 3, there are no significant differences between the three groups during the initial stages of the sessions (Minutes 0–13), but a clear divergence in symptom intensity emerges as time progresses. However, significant differences between the Simulator vs. Test-track and On-road first appeared after Minute 14th. However, these differences do not persist after applying a global False Discovery Rate (FDR) correction adjusting for all comparisons (padj2) across the entire 25-minute timeline of the Motion Sickness Assessment (MISC). There are only differences for 15th and 25th minute.
5
4
3
MISC
2
1
0
0
1
2
3
4
5
6
7
8
9
Time (min)
Figure 4: Mean and standard error of the mean for MISC. Test significance based on post-hoc analysis using series of independent Mann-Whitney U tests (rank-sum tests) at each minute is presented by ∗ padj1 ≤ .05, ∗∗ padj2 ≤ .01, and ∗∗∗ padj2 ≤ .001. padj2 corresponds to a global False Discovery Rate (FDR) correction adjusting for all comparisons across the entire 25-minute timeline of the Motion Sickness Assessment (MISC).
Figure available in the original PDF paper.
DISCUSSION
In this section, we will discuss the results of the objective and subjective data analysis by exploring the replication of the on-road sickness exposure by the driving simulator.
Objective motion sickness assessment: The limited workspace envelope of the motion platform leads to reduced values of the MSDV, primarily because the platform cannot reproduce low-frequency motion components with sufficient amplitude. Low-frequency cues typically require large actuator strokes, which in this case significantly exceed the available travel of 670 mm. As a result, the motion cueing algorithm tries to wash out these components, leading to an underrepresentation of sustained accelerations in long-period motions.
This limitation is well known in the field of driving simulators and is commonly addressed through tilt coordination, where low-frequency translational accelerations are partially substituted by platform tilt. While this technique can effectively extend the motion perception of sustained accelerations, it introduces additional sensory cues that can be perceived by participants, inducing sensory conflicts. For this reason, in our study, the amount of tilt coordination was constrained to remain below human perception thresholds (Colombet, 2017), ensuring that participants did not detect artificial tilt cues. Nevertheless, restricting the tilt magnitude further reduces the achievable motion fidelity in the low-frequency domain, which contributes to conservative MSDV and limit the ability to fully reproduce real-world driving dynamics. A more advanced solution would be the use of a 9 DoF driving simulator architecture, in which the hexapod is mounted on a larger motion system, such as a tripod or a cable-driven platform (Cheli, 2022). This configuration enables substantially larger translational motion, allowing improved reproduction of low-frequency motion components.
Table 1: P-values for test significance based on a post-hoc analysis using a series of independent Mann-Whitney U tests (Wilcoxon rank-sum tests) comparing Test-track vs. Simulator and On-road vs. Simulator at each minute. Shaded cells correspond to time points with a statistically significant difference (p < 0.05). padj1 corresponds to a local Bonferroni correction adjusting for the two comparisons performed within each minute. padj2 corresponds to a global False Discovery Rate (FDR) correction adjusting for all comparisons across the entire 25-minute timeline of the Motion Sickness Assessment (MISC).
Table available in the original PDF paper.
Test-track vs. Simulator On-road vs. Simulator Minute (Padj1) (Padj2) (Padj1) (Padj2)
1 0.031 0.560 0.175 1.000
2 0.137 1.000 0.250 1.000
3 0.279 1.000 0.316 1.000
4 0.328 1.000 0.406 1.000
(Continued)
Table 1: Continued.
Table available in the original PDF paper.
Test-track vs Simulator On-road vs. Simulator Minute (Padj1) (Padj2) (Padj1) (Padj2)
5 0.289 1.000 0.184 1.000
6 0.322 1.000 0.409 1.000
7 0.495 1.000 0.256 1.000
8 0.477 1.000 0.265 1.000
9 0.093 1.000 0.185 1.000
10 0.051 0.855 0.137 1.000
11 0.096 1.000 0.088 1.000
12 0.070 1.000 0.129 1.000
13 0.056 0.900 0.067 1.000
14 0.002 0.120 0.013 0.328
15 0.000 0.020 0.001 0.051
16 0.001 0.050 0.000 0.017
17 0.003 0.120 0.002 0.117
18 0.004 0.170 0.002 0.117
19 0.017 0.411 0.031 0.560
20 0.005 0.194 0.007 0.214
21 0.019 0.455 0.039 0.680
22 0.020 0.455 0.023 0.485
23 0.024 0.485 0.030 0.560
24 0.006 0.196 0.008 0.222
25 0.005 0.192 0.007 0.214
Subjective motion sickness assessment: The high standard deviation of the average subjective carsickness is caused by the inclusion of susceptible and non-susceptible participants in this calculation. At the same time, the duration of the provocation had a significant effect on carsickness accumulation in the simulator condition. This result underlines the time-dependence development of motion sickness as presented across all testing environments (Pham Xuan, 2023; Pham Xuan et al., 2025). According to the results, the interaction between time and environment demonstrated that the progression of MISC over time was significantly influenced by the testing environment, providing robust statistical evidence that the simulator induced a significantly different sickness profile (i.e., lower levels) compared to the test-track and on-road conditions.
Interestingly, our analysis illustrated that the differences between the simulator and the other conditions became significant over time and as the amplitude increased. This might imply that the simulator data could be valid until a specific MISC level, which can be limited based on the simulator capabilities, i.e. workspace. Similar behavior was noticed by Talsma et al. (2023), where the simulator matched the on-road carsickness exposure for the first 5 mins. After this period, the divergence from the on-road exposure
308 Papaioannou and Shyrokau also occurred. Talsma et al. (2023) also illustrated significant differences between simulator and their “car” condition, which was in a closed test-track without any other users. Interestingly, Himmels et al. (2024) presented that MISC differs across simulators with more advanced simulators provoking less MISC on the same driving scenario, but this difference was also dependent on the scenario.
Despite the concrete outcomes in terms of p-values, there are some limitations that need to be addressed. First, the participant samples were different between the two studies (N = 28 vs. 47) making them partly between- subject. Secondly, the motion was not fully reproduced by the simulator due to the workspace limitations.
CONCLUSION
To sum up, this paper extended previous work by replicating on-road sickness exposure in a driving simulator and exploring the carsickness assessment across all testing environments (on-road, test-track and simulator). The assessment included objective (accelerations and MSDV) and subjective (MISC) data analysis. The results illustrated that the driving simulator was unable to replicate the on-road sickness exposure in low-frequencies resulting in 10 times lower MSDV compared to the on-road and test-track conditions. At the same time, the perceived carsickness based on MISC had smaller but significant differences across the testing environment. The significant differences rise from the moment the exposure reached higher amplitudes.
Further work is in progress to increase the participant samples to match the on-road study, to explore the differences in the carsickness assessment across testing environments in more depth and to evaluate the differences between various psychological factors across testing environments.
REFERENCES
Aykent, B., Merienne, F., Guillet, C., Paillot, D., and Kemeny, A. (2014). Motion sickness evaluation and comparison for a static driving simulator and a dynamic driving simulator. Proceedings of the Institution of Mechanical Engineers, Part D: Journal of Automobile Engineering, 228(7), 818–829. Bos, J. E., Diels, C., & Souman, J. L. (2022). Beyond seasickness: A motivated call
for a new motion sickness standard across motion environments. Vibration, 5(4), pp. 755–769. Bos, J.E., MacKinnon, S.N. and Patterson, A. (2005) ‘Motion sickness symptoms in a ship motion simulator: Effects of inside, outside, and no view’, Aviation, Space, and Environmental Medicine, 76(12), pp. 1111–1118. Cheli, F., Gobbi, M., Melzi, S., Previati, G., Somma, A., Del Linz, L., and Minen, D.
(2022). Subjective/Objective Assessment of a Cable-Driven Simulator Immersivity and Realism. International Munich Chassis Symposium, pp. 144–153. Colombet, F., Fang, Z., and Kemeny, A. (2017). Tilt thresholds for acceleration rendering in driving simulation. Simulation, 93(7), 595–603. Dam, A., Sanford, C. and Jeon, M. (2025) ‘Verifying Motion Sickness Induction
in Automated Vehicles Using Motion-Based Driving Simulators’, International Journal of Human–Computer Interaction, 41(12), pp. 7854–7872.
Does the Testing Environment Matter? Carsickness Across On-Road 309 E2M Technologies B.V., eMoveRT controller manual, 2019. Gianaros, P.J., Muth, E.R., Mordkoff, J.T., Levine, M.E. and Stern, R.M. (2001) ‘A
questionnaire for the assessment of the multiple dimensions of motion sickness’, Aviation, Space, and Environmental Medicine, 72(2), pp. 115–119. Harmankaya, H., Brietzke, A., Xuan, R.P., Shyrokau, B., Happee, R. and Papaioannou, G. (2025) ‘Efficient motion sickness assessment: Recreation of on-road driving on a compact test track’, IEEE Transactions on Intelligent Transportation Systems. Himmels C, Venrooij J, Parduzi A, Peller M, Riener A (2024) The bigger the better?
Investigating the effects of driving simulator fidelity on driving behavior and perception. Transportation research part F: Traffic psychology and behaviour 101:250–266 Htike, Z., Papaioannou, G., Siampis, E., Velenis, E., & Longo, S. (2021). Fundamentals of motion planning for mitigating motion sickness in automated vehicles. IEEE Transactions on Vehicular Technology, 71(3), 2375–2384. ISO-2631 (1997) Mechanical Vibration and Shock-Evaluation of Human Exposure
to Whole-Body Vibration-Part 1: General Requirements. Geneva: International Organization for Standardization. Jain, V., Kumar, S. S., Papaioannou, G., Happee, R., & Shyrokau, B. (2023).
Optimal trajectory planning for mitigated motion sickness: Simulator study assessment. IEEE Transactions on Intelligent Transportation Systems, 24(10), 10653–10664. Khusro, Y.R., Zheng, Y., Grottoli, M. and Shyrokau, B. (2020) ‘MPC-based motioncueing algorithm for a 6-DOF driving simulator with actuator constraints’, Vehicles, 2(4), pp. 625–647. Mühlbacher, D., Tomzig, M., Reinmüller, K. and Rittger, L. (2020) ‘Methodological
considerations concerning motion sickness investigations during automated driving’, Information, 11(5), p. 265. Papaioannou, G., Shen, C., Rothhämel, M. and Happee, R. (2025) ‘Occupants’ comfort: what about human body dynamics in road and rail vehicles?’, Vehicle System Dynamics, 63(7), pp. 1241–1299. Pham Xuan, R. (2023) Evaluation multimodaler physiologischer Merkmale zur
objektiven Detektion von Kinetose im Pkw. PhD thesis. Technische Universitaet Berlin. Pham Xuan, R., Brietzke, A., Koerber, H., Metzulat, M., Edelmann, A., Happee, R.
and Papaioannou, G. (2025) ‘Test-track and On-road studies: Methodological Insights on the Assessment of Carsickness and its Modulating Factors’. [Unpublished/Preprint]. Rossi, R., Gastaldi, M., Biondi, F., Orsini, F., De Cet, G., and Mulatti, C. (2020). A driving simulator study exploring the effect of different mental models on ADAS system effectiveness, International Conference on Augmented Reality, Virtual Reality and Computer Graphics, pp. 102–113. Shyrokau, B., De Winter, J., Stroosma, O., Dijksterhuis, C., Loof, J., Van Paassen, R.,
& Happee, R. (2018). The effect of steering-system linearity, simulator motion, and truck driving experience on steering of an articulated tractor-semitrailer combination, Applied Ergonomics, 71, 17–28. Talsma, T.M., Hassanain, O., Happee, R. and de Winkel, K.N. (2023) ‘Validation of a moving base driving simulator for motion sickness research’, Applied Ergonomics, 106, p. 103897.
LISTED IN THE AHFE DIGITAL BOOKSTORE CATALOGUE
Explore the complete digital volume
Advances in Human Factors of Transportation
Read this individual research paper free through the original publisher, or explore the full digital proceedings book.
ISBN 979-8-950676-00-0
Explore this ISBN in the AHFE Bookstore ↗Listed in the July 2026 bookstore catalogue; search by ISBN to confirm current availability · Digital book purchase optional