Juyoung Kim (2025). Commute time analysis using mobile location information. In: Human Interaction and Emerging Technologies (IHIET 2025). AHFE Open Access, vol. 197, pp. 88–99. https://doi.org/10.54941/ahfe1006702
In this paper, authors indicate that 95% of the South Korean population owns a mobile device. Telecom providers can collect an individual's location data at short intervals by utilizing communication information from their mobile devices. By continuously tracking daily location data, it is possible to estimate an individual's residential location, employment status, and workplace location. Based on residential and workplace locations, the purposes of trips—such as commuting, work-related travel, leisure, and returning home—can be inferred.This study develops a methodology for constructing a personal trip chain database (DB) that includes trip purposes using mobile location data and analyzes commuting conditions by city in South Korea. It examines factors such as the average commuting time, standard deviation, and the proportion of individuals experiencing poor commuting conditions based on city-specific commuting time distributions. Additionally, it analyzes urban commuting self-sufficiency levels based on the consistency between residential and workplace locations.By assessing the commuting environments of those with particularly challenging commutes, this study aims to propose transportation infrastructure investment policies (SOC) to improve travel conditions.
Travel time to a destination is an important indicator used to evaluate urban mobility. In particular, commuting time during peak hours - when traffic demand is most concentrated - is a critical metric for assessing the efficiency of an urban transportation network. In the early stages, due to limitations in traffic data collection, indicators such as travel speed or time on road links were mainly used to evaluate urban mobility. However, with the advent of mobility big data - such as mobile phone data, vehicle GPS, and public transportation card data - these metrics have been expanded into more detailed and comprehensive travel indicators. Unlike traditional traffic data collected through point-based detectors, mobility big data is based on continuous location information of individual travelers. This allows for the construction of individual trip chains and the development of technologies to estimate travel purposes and modes of transport based on continuous travel patterns and routes. In particular, mobile data is highly useful for understanding human travel behavior. Since most people own a mobile device, near-complete records of travel history can be obtained. In Korea,
Commute Time Analysis Using Mobile Location Information 89
approximately 97% of the population owns a mobile phone, and regardless of which of the three major telecom providers’ data is used, the sampling rate exceeds 20%. This indicates a high level of representativeness for analyzing national travel patterns (Kim et al., 2024).
This study presents a methodology for constructing a trip chain database using individual location data collected by telecom companies through mobile devices. It also presents validation results of travel purpose and travel time estimation based on mobile data, in conjunction with a diary survey of 1,000 individuals. By analyzing commuting time based on home and workplace locations, the study aims to present practical results. The analysis of commuting time using mobile data is expected to be highly useful for formulating transportation policies that improve commuting conditions.
Literature Review
Recently, various organizations have been conducting studies that generate urban mobility indicators to compare and evaluate cities globally (Costa et al., 2016.7; World Bank, 2017; Morfoulaki et al., 2021; SUMI, 2020). To assess sustainable urban mobility, it is suggested that we move beyond the conventional perspective focused solely on access to workplaces and amenities, and instead consider whether the transportation system is equitable, efficient, safe, and climate-responsive. The World Bank (2017) outlines four key dimensions for sustainable transport systems: universal access to ensure equitable access to economic and social opportunities, efficiency to enhance the performance of the transportation system, safety in the use of transport modes, and green to address climate change.
Commuting time is one of the most representative indicators used to assess traffic congestion and the efficiency of urban spatial structure, as it reflects travel during the most congested periods. Several studies have used commuting time data to analyze peak-hour traffic characteristics or to forecast peak traffic demand (Kim, 2019b). Other studies have examined urban spatial efficiency through analyses of commuting patterns and times (Wang, 2015; Crane, 2000; Clark et al., 2005), and have explored the economic implications of commuting, including how it influences residential location and transport mode choices (Levinson, 1998; Van Ommeren et al., 2000). Various methods exist for measuring commuting time. Some studies have relied on user surveys, such as household travel surveys, to analyze commuting behavior. More recently, studies using location data from mobile devices, credit card transactions, and transit card usage have analyzed commuting patterns by time and day of the week. These studies also construct big data-based OD (Origin-Destination) matrices and interpret traffic volumes and movement trajectories during commuting hours (Park et al., 2019; Wang, 2015; Kim et al., 2019a, 2019b). Other research maps geographic information about origins and destinations (e.g., workplaces/schools and residences) to visualize commuter sheds based on travel time and distance, identify commuting centers, or use network-based
90 Kim
routing algorithms on road or public transport networks to calculate actual travel times or congestion levels (Miller et al., 2015).
Location data collected from mobile devices and vehicle GPS systems constitute big data that can continuously track the movements of individuals or vehicles. Recently, numerous studies have utilized this type of location- based big data to construct trip chain databases for analyzing travel time and transportation demand (Kim et al., 2019a, 2019b, 2024; Wang, 2015). These studies classify travel segments using second-by-second individual location data and estimate home and workplace locations to conduct various analyses on commuting behavior.
Trip Chain DB Construction Using Mobile Data Sighting Data & CDR (Call Detailed Recorder) Data Mobile data collected by telecommunications companies can largely be categorized into two types. Sighting data refers to the location information of base stations that the mobile device communicates with at short intervals, even when the device is not actively in use. Call Detail Records (CDR), on the other hand, are location data recorded when the user actively operates the device—such as during calls, text messaging, or internet use (Won et al., 2021).
Sighting data does not provide the exact location of the mobile device but rather the location of the nearest base station; however, it is collected at very short intervals, even as frequently as every second. In contrast, CDR allows for the identification of the user’s mobile location but has the limitation of being collected at irregular intervals. Major telecommunications companies in Korea - SKT, KT, and LG - collect either one or both of these types of data. The Korea Transport Database (KTDB) utilizes both types to construct national trip data.
Correction of Signal Jump and Handover The accuracy of mobile location information varies depending on the type of data - Sighting data or CDR. While sighting data is expected, in principle, to be transmitted to and from the nearest base station, the actual connected base station can change frequently due to environmental factors such as terrain and weather. This phenomenon can distort the actual location of the mobile user (Won et al., 2021; Chen et al., 2016). A representative example is the handover phenomenon, which includes ping-pong handovers - where a stationary user is repeatedly connected to multiple base stations - and signal jump handovers, where the device connects to distant base stations beyond the detectable signal range (Chen et al., 2016; Kim et al., 2019a; Won, 2020, 2021). Algorithms can be developed to detect and correct such handover effects. For example, if the mobile location data repeats consistently or shows sudden changes faster than the standard human travel speed, it can be flagged as a handover event and corrected to the most frequently recorded location. Several studies have proposed preprocessing methods that formalize or patternize these signal distortion phenomena (Lee and Hou, 2006; Iovan et al., 2013; Kim et al., 2019a, 2019b). CDR data, recorded when
Commute Time Analysis Using Mobile Location Information 91
a user actively operates their mobile device, corresponds to GPS location data. The accuracy of GPS-based data can vary significantly depending on multiple factors. The precision of GPS-based location estimation depends on the underlying location acquisition technology, and more satellites generally allow for greater accuracy. Depending on the intended application of mobile location data, GPS collection methods can be applied in a cost-effective manner. For example, a particular telecom provider in Korea collects GPS data within a 50m by 50m grid for location estimation. Although mobile GPS data may still contain positional errors, these can be corrected through map-matching processes that align the estimated paths to a digital map.
In this study, a trip database was constructed using base station data collected at one-second intervals, and commuting times for the entire Korean population were analyzed based on this dataset.
Identifying Home and Work Locations Mobile location data is continuously collected at short time intervals. This characteristic enables the estimation of users’ home and workplace locations. In general, a location can be inferred as a person’s home if it meets the following three criteria most frequently: It is the place where the individual stays the most throughout the year. It is the location where the individual stays most frequently during late- night hours, when mobile activity is typically low.
It is the location where the individual spends the most time on weekends and holidays (Kim et al., 2019a, 2019b).
In contrast, determining whether a mobile user is employed and identifying their workplace is a more complex task than estimating home locations. Commuting behavior varies greatly among individuals, making it difficult to define with fixed rules. At the Korea Transport Database (KTDB), workplace locations are estimated based on a logic in which a place is defined as a commuting destination if the user travels to the same location more than three times a week and stays there for more than three hours per day.
Construction of a Trip Chain Database To construct an individual Trip Chain Database using high-frequency mobile location data, it is first necessary to distinguish between trips. Trip segmentation is typically based on dwell time at a single location. In this study, by comparing with a diary survey, a 30-minute dwell time threshold was found to be the most appropriate criterion for differentiating between trips and stays. However, some exceptions may arise. For instance, if a person spends more than 30 minutes while transferring between modes of transportation, it may be mistakenly identified as a stay. Conversely, trips involving short-duration visits - such as meeting someone for less than 30 minutes - may not be correctly recognized as distinct trips. The Korea Transport Database (KTDB) has developed a logic for constructing Trip Chain Databases using mobile location data. We have developed a methodology for constructing a trip chain database at the individual level by analyzing the continuous changes in a person’s location data to identify the duration of stay at a given point, classify individual
92 Kim
trips, and estimate travel purposes using home and workplace location information. Within the framework of the Personal Information Protection Act, KTDB builds a database that allows for the analysis of nationwide travel behavior while protecting individual privacy.
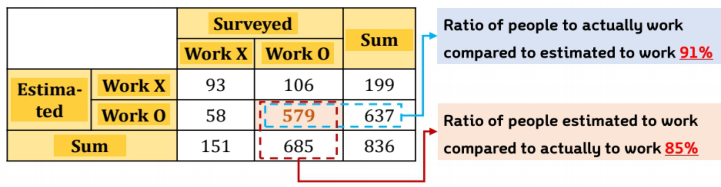
Verification A diary survey was conducted with 1,000 participants who provided prior consent, and the resulting trip chain DB - constructed using their mobile data - was subsequently validated. Among the 1,000 participants, data from 836 individuals who completed all survey responses were analyzed. The results showed that the estimation of home locations achieved 100% accuracy. In contrast, the estimation of workplace status (i.e., whether or not the individual is employed and their workplace location) was accurate for 672 out of 836 participants, resulting in an accuracy rate of approximately 80.4%.
Figure 1: Accuracy of employment status estimation.
As a result of estimating the accuracy of home and workplace identification by occupation type, it was found that home locations were accurately identified regardless of job type, with an average location error of 1.59 km. In contrast, the accuracy of estimating employment status was relatively lower for individuals without a fixed workplace schedule - such as freelancers - or for those who were unemployed. The average error for workplace location estimation was approximately 1.57 km. These location errors in estimating home and workplace positions are likely due to the analysis being based on the location of mobile base stations with which devices communicate. The distance between base stations can vary significantly - being as close as 50 meters in urban areas, but up to approximately 2 kilometers in rural areas - which contributes to the observed inaccuracies.
Table 1: Accuracies on classification and estimated locations of each types of stays.
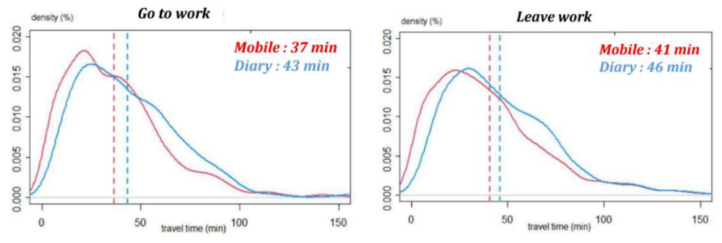
* In cases where freelancers or individuals in other occupations commuted - either temporarily or irregularly - during the survey period, the analysis was conducted based on the address of the company they worked for (Won et al., 2021) A comparison of travel times based on commuting periods revealed that, for morning commutes, there was an average error of approximately 6 minutes, while for evening return trips, the error was about 5 minutes.
Figure 2: Estimation accuracy by commuting time period.
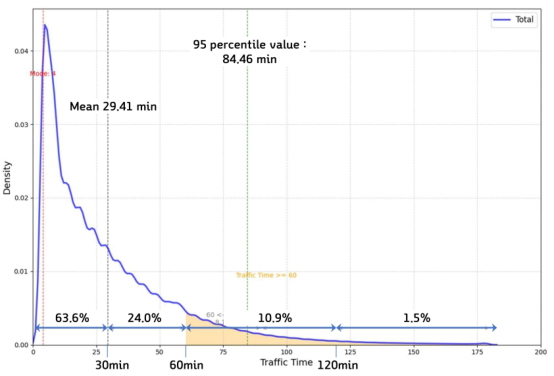
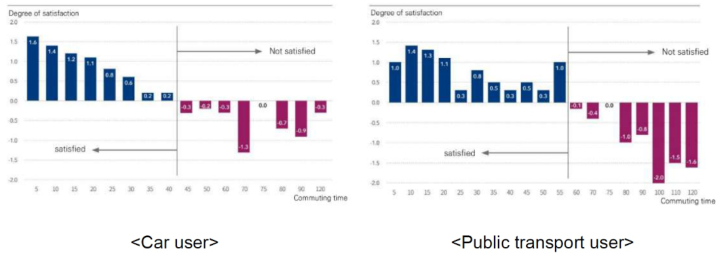
ANALYSIS Commuting time is considered one of the most important indicators for evaluating urban mobility. Traffic conditions during commuting hours are generally the most congested due to concentrated travel demand, making commuting time a key metric for assessing how effectively mobility supports a city’s economic functions and how efficient the transportation system is. Traditionally, commuting time indicators were derived from nationwide surveys, with average values published by region. In contrast, the mobile data analyzed in this study covers a national sampling rate of approximately 23%, enabling a wide range of analyses based on the distribution of commuting times. As shown in Figure 3, the average commuting time(go to work) for the entire Korean population is 29.41 minutes. The distribution is as follows: Less than 30 minutes: 63.6%, 30 minutes to 1 hour: 24%, 1 to 2 hours: 10.9%, More than 2 hours: 1.5% A survey on commuting time satisfaction among commuters in the Seoul metropolitan area revealed that public transportation users tended to express dissatisfaction with their commuting conditions when their commute
94 Kim
exceeded 60 minutes. In contrast, private car users reported dissatisfaction when their commute exceeded 45 minutes.
Figure 3: National distribution of commuting (go to work) times.Figure 4: Survey on commuting time satisfaction in major metropolitan areas of Korea.
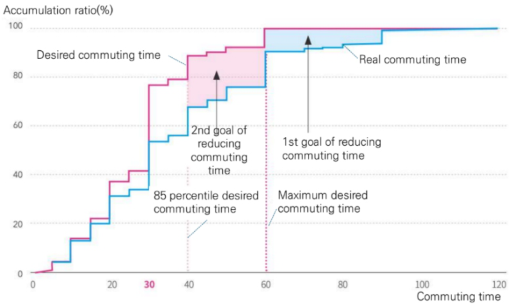
As shown in the cumulative distribution in Figure 5, which compares actual commuting times with desired commuting times, the maximum acceptable commuting time among Korean citizens is approximately 1 hour, while the 85th percentile value for desired commute time is 30 minutes.
In traditional analyses based on surveys, average commuting times by region were used to inform urban transportation policies. However, by leveraging mobile data with a high sampling rate, it is now possible to conduct more detailed and diverse analyses of commuting behavior - based not only on averages but on distributions of indicators such as residential location, workplace location, commuting time, departure time, and commuting distance at the individual level. Two key indicators for developing effective urban transport policies include the rate of commutes under poor conditions and the job-housing balance by city.
Commute Time Analysis Using Mobile Location Information 95
Figure 5: Comparison of actual and desired commuting times.
According to a nationwide study in Korea, the maximum commuting time desired by citizens is one hour. Therefore, individuals with a commute time exceeding one hour are defined as commutes under poor conditions.
PCIi = Li
(1)
Ni
Rate of Commutes Under Poor Conditions: Here, PCIi (poor commuter index): Rate of commutes under poor conditions in city i.
Li : Number of commuters in city i with a commute time of one hour or more.
Ni : Number of commuters in city i. When formulating urban transportation policies to improve commuting conditions, it is more desirable to focus not on simply reducing the average commuting time across a city (e.g., from 30 minutes to 25 minutes), but rather on identifying the causes of commuters who face poor commuting conditions - those whose commutes exceed one hour - and developing targeted policies to reduce their commuting times to within one hour. For such commute zones under poor conditions, it is necessary to analyze commuting times by mode of transportation (e.g., private car vs. public transit) and the underlying causes of long commutes, in order to devise appropriate improvement measures. Secondly, the job-housing balance serves as a key indicator in evaluating a city’s economic self-sufficiency. A higher proportion of residents who both live and work within the same city generally indicates shorter commuting distances and higher satisfaction with commuting conditions.
Based on mobile data analysis across Korea’s 17 metropolitan and provincial regions, the results show that average commuting times are longer in major metropolitan areas such as Seoul, where travel volumes are higher, compared to rural regions. The rate of commutes under poor conditions was found to be highest in Gyeonggi-do and Incheon, largely due to the high number of commuters traveling to Seoul. The job-housing balance was lowest in Gyeonggi-do, Incheon, and Sejong City. For Gyeonggi-do and Incheon, this is attributable to the large number of residents commuting to Seoul. In
96 Kim
the case of Sejong, a planned administrative city developed about a decade ago, it was found that approximately 40% of its residents commute to the neighboring metropolitan city of Daejeon.
Table 2: Commuting time, commuting distance, and job-housing balance by region in Korea’s 17 metropolitan and provincial areas.
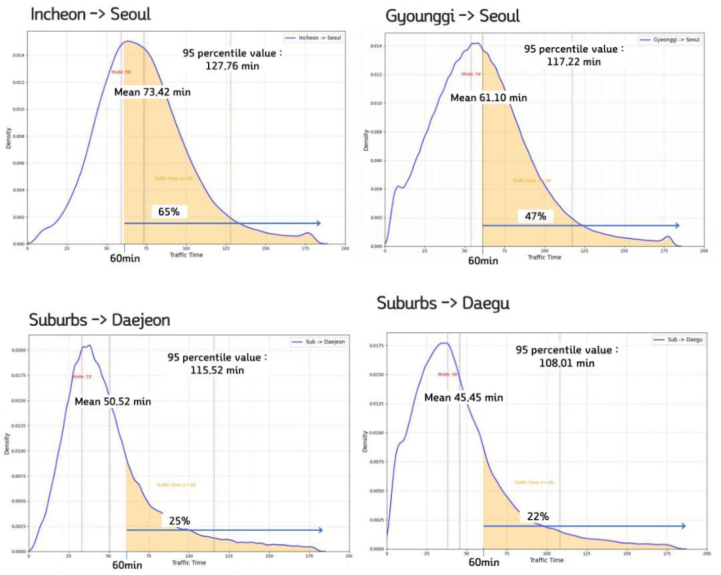
Analysis of commuting zones under poor conditions reveals that they are predominantly concentrated in large metropolitan areas experiencing severe traffic congestion. In particular, a significant number of such commutes occur from neighboring cities into major metropolitan centers. Figure 6 presents an analysis of commuting zones under poor conditions in major metropolitan areas. In Korea’s Seoul metropolitan region, Seoul is at the center, surrounded by Incheon and Gyeonggi-do. For commuters traveling from Incheon to Seoul, the average commuting time is 73.42 minutes, with approximately 65% of commuters classified as experiencing commutes under poor conditions (i.e., commutes longer than one hour). Similarly, commuters from Gyeonggi-do to Seoul have an average commuting time of 61.10 minutes, with about 47% falling into the burdensome commute category. In comparison, metropolitan cities located outside the capital region generally show better commuting conditions. For instance, the proportion of commuters under poor conditions is 25% in Daejeon and 22% in Daegu, both of which are lower than those found in the capital region.
These findings suggest that when analyzing commuting conditions and establishing transportation policies for improvement, it is essential to focus on zones with poor commuting conditions, analyzing commuting behavior in order to evaluate the potential for expanding transportation
Commute Time Analysis Using Mobile Location Information 97
infrastructure (SOC) or improving the transportation system. To address traffic congestion in the capital area, Korea is currently constructing a Great Train Express (GTX) high-speed rail network connecting major parts of the Seoul metropolitan region. Mobile data can be effectively used to conduct pre- and post-construction monitoring of the GTX network’s impact on commuting patterns and efficiency.
Figure 6: Analysis of commuting zones under poor conditions in major metropolitan cities of Korea.
CONCLUSION
Travel time analysis using mobile data can be extremely useful. With its high sampling rate and ability to construct continuous, individual-level trip chain databases, it enables the analysis of commuting zones under poor conditions for specific time periods or days, as well as detailed examinations of individual travel behavior. The Korea Transport Database (KTDB) has developed technologies over several years to construct individual-level trip chains including travel purposes, based on raw mobile data collected by telecommunications company. It has also conducted validation studies by comparing results with actual diary survey data.
Mobile data can be effectively utilized to build Origin-Destination (O/D) datasets that include travel purposes and modes - key inputs for
98 Kim
transportation demand forecasting. By integrating mobile data with vehicle GPS data from navigation systems and public transportation card data, it is possible to identify commute zones under poor conditions, compare travel conditions between private cars and public transport, and determine the underlying causes of congestion and formulate appropriate improvement strategies.
KTDB is currently building a nationwide database covering all interregional travel in Korea, including commute time, travel duration by car and public transit, and travel volume, using mobile data, vehicle GPS, and transit card records. Going forward, continuous research and validation will be necessary for the construction of individual-level trip databases using mobile data. This includes improving the accuracy of preprocessing short- interval location data, trip segmentation, and workplace location estimation, while also ensuring compliance with personal data protection laws and creating a database that is both policy-relevant and privacy-respecting. As various forms of mobility big data containing personal information are being generated not only by the government but also by private companies, there is a growing need to carefully consider data governance frameworks for the integration of transportation data and its effective use in policymaking.
ACKNOWLEDGMENT
This study was prepared using the results of national mobility analysis and Transport SOC investment policy research project conducted by the Korea Transport Institute.
REFERENCES
Clark, W. A. V., & Wang, W. (2005). “Job access and commute outcomes: An empirical study in Los Angeles.” Journal of Transport Geography. Crane, R. (2000). “The influence of urban form on travel: an interpretive review.”
Journal of Planning Literature. J. Y. Kim, D. H. Kim, D. I. Jang, National Mobility Analysis and Transport SOC Investment Policy, Korea Transport Institute, 2024. Kim J. Y., Kim D. H., Kim B. K., Seong H. M. (2019a), Upgrading Reliability of
Estimating Big Data-Driven Transport Demand, the Korea Transport Institute. Kim J. Y., Song T. J., Seong H. M., Kim D. H. (2019b), A Study on the Reliability of Traffic Demand Prediction Based on Big Data, the Korea Transport Institute. Levinson, D. (1998). “Accessibility and the journey to work.” Journal of Transport
Geography. Maria morfoulaki, Jason papathanasiou, Use of the sustainable mobility efficiency index (SMEI) for enhancing the sustainablel urban mobility in Greek cities, Sustainability 2021, 13, 1709, https://doi.org/10.3390/su13041709. P. B. Costa, G. C. Morais Neto, A. I. Bertolde, Urban mobility indexes: A brief review
of the literature, World conference on transport research, 2016.7. Sumi, Technical support related to sustainable urban mobility indicators; Harmonisation guideline final (web) version, 2020, 8. Van Ommeren, J., Rietveld, P., & Nijkamp, P. (2000). “Job moving, residential moving, and commuting: A search perspective.” Journal of Urban Economics. Wang, Q. (2015). Big data in urban and regional analysis. Annals of GIS.
Commute Time Analysis Using Mobile Location Information 99
Won, Minsu, Choi, Jeongyoon, Lee, Haesun, Kim, Juyoung, Development of an Algorithm to Analyze Home-based Work Trips Using Mobile Phone Data, Korean Society of Transportation, 2021. World Bank, Global Mobility Report 2017: Tracking sector performance, 2017
(http://www.sum4all.org).
LISTED IN THE AHFE DIGITAL BOOKSTORE CATALOGUE
Explore the complete digital volume
Human Interaction and Emerging Technologies (IHIET 2025)
Read this individual research paper free through the original publisher, or explore the full digital proceedings book.
ISBN 978-1-964867-73-1
Explore this ISBN in the AHFE Bookstore ↗Listed in the July 2026 bookstore catalogue; search by ISBN to confirm current availability · Digital book purchase optional