Javier Fernández Troncoso, Santiago Muiños Landin, Ramon Angosto Artigues, Eero Anttila, Juha Maunula, Andrea Fernandez Martinez (2025). Generative AI for Sustainable and Efficient Layout Designs. In: Human Interaction and Emerging Technologies (IHIET 2025). AHFE Open Access, vol. 197, pp. 67–77. https://doi.org/10.54941/ahfe1006700
Generative Artificial Intelligence (GenAI) is emerging as a transformative tool in industrial design, offering novel pathways to optimize functionality, resource efficiency, and sustainability. This paper explores the application of generative AI in 2D layout optimization through the development and evaluation of a specialized tool: the EcoStorage Architect. EcoStorage Architect leverages a Conditional Tabular GAN (ctGAN) to generate optimized layout configurations that not only enhance spatial efficiency and accessibility but also integrate sustainability constraints from the outset. By embedding eco indicators—such as energy efficiency and resource optimization—directly into the generation process, the model ensures that environmental performance is a core driver of design outcomes. The tool is evaluated on a dedicated dataset, with results demonstrating the feasibility of integrating generative AI into early stages of the industrial design process. Quantitative and qualitative assessments highlight gains not only in layout efficiency but also in key sustainability indicators. This work showcases how generative models can drive more adaptive, sustainable, and intelligent design practices in industrial contexts, and proposes a path forward toward AI-driven optimization in facility planning aligned with circular economy principles.
The convergence of Artificial Intelligence (AI) and design is reshaping how in-dustrial systems address complexity, performance, and sustainability. In particu-lar, generative AI has emerged as a transformative tool in industrial design, offer-ing novel capabilities to automate and optimize the creation of layouts, compo-nents, and product forms, along with new opportunities for customization (Shafiee, 2025). By learning from high-dimensional data distributions, generative models can create new, constraint-compliant content (Goodfellow et al., 2020). In industrial contexts, their integration into design workflows leads to faster development cycles and more informed decision- making, while reducing the time and material costs traditionally associated with manual design iterations (Shafiee, 2025).
The need for sustainable industrial design has become a central focus of re-search and innovation in recent years, playing a pivotal role in guiding the transi-tion toward more resource-efficient and circular manufacturing systems. Current efforts aim to reduce material usage, minimize energy consumption, and embed circularity principles throughout the value chain (Kirchherr, Reike & Hekkert, 2017). Generative models, when aligned with sustainability-driven design indicators, can actively support these objectives by enabling early-stage estimation of eco-KPIs, contributing to im-proved efficiency, circularity, and adaptability in manufacturing environments.
This paper presents a generative AI-based approach to sustainable industrial layout design through the development of Eco-Storage Architect (Figure 1). The tool employs a Conditional Tabular GAN (ctGAN) to generate optimized 2D warehouse configurations, focusing on the spatial arrangement of aisles and stacker cranes to maximize space utilization, improve process accessibility, and reduce resource inefficiencies. By learning from existing layout data and synthesizing new, high-performing alternatives, Eco-Storage Architect supports data-driven decision-making in the early stages of facility planning. Its integration of environmental performance metrics into the design process reflects a broader goal: aligning industrial layout optimization with sustainability and circular economy principles.
The remainder of this paper is structured as follows. Section 2 presents the related work on generative AI for design. Section 3 describes the methodologies and technical details of the proposed tools. Section 4 includes experimental setup and evaluation results. Section 5 discusses the implications for industrial practice and sustainable design. Finally, Section 6 outlines future research directions and concludes the work.
Figure 1: Schematic of the eco-storage architect framework: from site-specific input to AI-driven layout generation and eco-efficiency evaluation.
RELATED WORK
Generative AI has gained significant attention in recent years for its capacity to synthesize new and meaningful content in a variety of domains (Gonzalez-Val & Muinos-Landin, 2020, Gregores Coto et al., 2023). At the core of many generative models are architectures such as Generative Adversarial Networks (GANs), Variational Autoencoders (VAEs), and more recently, Transformer-based Large Language Models (LLMs), which have demonstrated the ability to generate highly structured outputs from unstructured input data (Goodfellow et al., 2020). These models are increasingly being employed due to their capacity to explore large spaces that would be computationally or cognitively impractical to address manually.
Generative AI for Sustainable and Efficient Layout Designs 69
In layout optimization, generative approaches have been explored to automate the configuration of spatial arrangements in architectural and factory environments. Early works focused on architectural layout generation using GAN-based models under functional and topological constraints (Nauata et al., 2020). More recently, generative design methods have also been applied to factory layout planning, enabling the development of creative and efficient configurations that account for complex planning constraints in industrial settings (Süße & Putz, 2021). Overall, the use of conditional GANs for applications in architectural layout generation and infrastructure planning have gained interest in recent years (Wu, Stouffs & Biljecki, 2022; Aalaei et al., 2023), and GAN-based approaches are starting to be used not only to generate feasible configurations, but also to explore unconventional layout alternatives that challenge traditional heuristics.
Despite growing interest in sustainable manufacturing, the integration of AI-driven design methods with circular economy objectives is still in its early stages. Within circular economy frameworks, AI has been mainly applied to tasks such as resource flow tracking, production optimization, and multi-objective trade-off analysis (Noman et al., 2022). However, relatively few studies have established a direct connection between generative models and environmental metrics. Recent literature has highlighted the importance of embedding sustainability indicators directly into AI systems, proposing comprehensive frameworks to evaluate environmental, social, and economic impacts (Rohde et al., 2024).
METHODOLOGY
Overview. The Eco-Storage Architect is a generative design tool developed to optimize warehouse layout configurations with respect to both technical efficiency and sustainability criteria. This tool focuses on the spatial arrangement of aisles and stacker cranes in industrial warehouses. In this context, a warehouse is structured around two key elements: i) aisles, which are the longitudinal corridors used for movement and access within the storage system, and ii) stacker cranes, which are automated machines that travel along these aisles to store and retrieve materials. The Eco- Storage Architect targets the optimization of automated warehouses, where space utilization, accessibility, and efficiency are critical. The layout and arrangement of aisles and stacker cranes significantly influence storage capacity, accessibility, and structural requirements. For example, increasing the number of aisles may improve accessibility at the cost of spatial efficiency. The Eco-Storage Architect explores these trade-offs by generating multiple warehouse layout candidates under varying technical and environmental constraints. It is designed to assist design decision-makers in balancing key performance indicators (KPIs) against sustainability metrics, including steel consumption and CO2 footprint by exploiting the use of generative AI.
Generative Modelling and conditional tabular GANs. Generative modelling (Nareklishvili, Polson & Sokolov, 2024) aims to learn the underlying data distribution pdata (x) of a dataset and generate new samples x
′ ∼pmodel (x) that resemble those in the original dataset. Among generative
approaches, Generative Adversarial Networks (GANs) (Salehi, Chalechale & Taghizadeh, 2020) have become widely adopted due to their ability to produce high-quality synthetic data. A standard GAN consists of two neural networks:
A generator G (z) that maps a random latent vector z ∼pz to the data space.
A discriminator D (x) that attempts to distinguish between real data x ∼ pdata and synthetic data generated by G (z).
The objective is formulated as a two-player minimax game, where the generator learns to produce samples that the discriminator cannot reliably distinguish from real data, thereby approximating the true data distribution. The equation is shown in Eq. (1).
Min
log D (x)
log (1 −D (G (z)))
+ Ez∼pz(z)
Equations and mathematical formulas are available in the original paper PDF.
G max
(1) Conditional GANs (cGANs) (Bourou, Mezger & Genovesio, 2024; Gandhi, Rana & Bhatt, 2025) extend the GAN framework by allowing both the generator and discriminator to receive additional information c, such as class labels or target attributes. This enables directed sample generation, allowing the generation of samples conditioned on user-defined constraints, which is particularly useful in design optimization tasks. The objective within this formulation is shown in Eq. (2):
Min
log D (x | c)
G max
log (1 −D (G (z | c)))
Ez∼pz(z)
While most GAN applications focus on image or sequential data, industrial data often takes tabular form, comprising numerical and categorical features. Conditional Tabular GANs (ctGANs) (Xu et al., 2019) are specialized architectures designed to handle mixed-type tabular data. In this way, during training, the ctGAN learns to model the joint distribution p (x|c) , where x includes layout parameters e.g., number of aisles, while c includes user- defined indicators such as storage capacity. Once trained, the generator of the ctGAN can be conditioned on a set of specified indicators, such as storage capacity or space usage, to generate new design candidates. At inference time, the generator G (z|c) receives a random latent vector z∼N (0, I) and a conditioning vector c -representing the user-defined target indicators- as inputs. Based on this, it then produces synthetic layout descriptions x that adhere to the statistical patterns learned during trained.
Evaluation Metrics for Synthetic Data Quality. To assess the quality of the synthetic warehouse layouts generated by the ctGAN, we employed a suite of statistical metrics designed for mixed-type tabular data containing both numerical and boolean features using the Synthetic Data Vault (SDV) library (SDV Team, 2024). These metrics evaluate the marginal distributions, pairwise dependencies, and multivariate similarity between real and synthetic data.
Generative AI for Sustainable and Efficient Layout Designs 71
Global Distribution and Dependency Metrics. Dataset-level scores were firstly computed to assess how well the ctGAN could capture the distributional and structural properties of the original dataset.
The Column Shapes Score (CSS) assess how well the marginal distributions of each individual feature are preserved in the synthetic dataset. For numerical variables, the Kolmogorov–Smirnov Complement (KSComplement) is used, which is defined in Eq. (3).
KSComplement (FR, FS) = 1 −DKS (FR, FS) (3) Where FR and FS are the empirical cumulative distribution functions (CDFs) of the real and synthetic datasets for a given feature, and DKS (FR, FS) = supx |FR (x) −FS (x)| is the Kolmogorov–Smirnov statistic, which measures the maximum difference between two CDFs. For categorical and Boolean variables, the Total Variation Complement (TVComplement) is applied, defined in Eq. (4).
X
|PR (x) −PS (x)| (4)
Where PR and PS are the probabilities of outcome x in the real and synthetic datasets, respectively. This corresponds to the complement of the Total Variation Distance (TVD). The final score is measured as the average similarity across all columns. A core of 1 means perfect distributional similarity, whereas low score corresponds to underrepresented values, or sampling inconsistencies.
The Column Pair Trend Score (CPTS) evaluates how well the synthetic data replicates the join distribution of each pair of features. For pairs of numerical variables, the metric is based on the similarity between the Pearson correlation coefficients (ρ) computed on the real and synthetic data, defined in Eq. (5).
ρreal −ρsyn
(5) For categorical and Boolean feature pairs, a contingency table is constructed, and the TVD is applied between the two joint distributions, as shown in Eq. (6).
Similarity = 1 −TVD (6) A score near 1 indicates strong agreement in the joint frequency patterns of the two features. The final Column Pair Trends Score is the average of all pairwise similarities across all combinations of features, using the appropriate comparison method based on data type.
The Overall Score (OS) is computed as the arithmetic mean of Column Shapes and Column Pair Trends.
The Mean Absolute Correlation Difference (MACD) quantifies the average absolute difference between the correlation matrices of the real and synthetic data, shown in Eq. (7).
X
ij −ρsynthetic ij
ρreal
i,j
Lower MACD values indicate better preservation of linear relationships between features. The squared Maximum Mean Discrepancy (MMD2) is a kernel-based statistical test that measures the distance between the multivariate distributions of real and synthetic samples. Using a radial basis function (RBF) kernel, it captures both first- and higher-order differences between distributions. Eq. (8) expresses the MMD2 metric.
′i
Equations and mathematical formulas are available in the original paper PDF.
k
+ Ey, y
k
y, y
k
x, y
′ h
′ h
−2Ex,y (8)
where k (, ) is a positive-definite kernel function e.g., Gaussian RBF. An MMD2 value close to 0 implies high similarity between the datasets.
Per-Feature Distributional Metrics. In addition to global evaluation metrics, per-feature statistical comparisons between the real and synthetic datasets were conducted to assess how accurately individual feature distributions were reproduced, including the KS Statistic (described in the previous section), and the well-known p-value of the KS test and Wasserstein distance.
Implementation Details. This section describes the dataset used for training, including input features (e.g., spatial constraints, user needs, eco- indicators) and target layout variables, as well as the ctGAN configuration used to generate synthetic layouts.
Dataset. To train the ctGAN, each warehouse layout is encoded as a structured vector combining design parameters and performance indicators. The design parameters include: i) the number of aisles, ii) the number of cranes per aisle, iii) the number of storage levels (height), iv) aisle orientation (X or Y), v) space usage along each axis, and vi) edge aisle presence. These variables define the geometric and operational structure of the warehouse. For each layout configuration, key performance indicators were computed, including: i) storage capacity, ii) space usage ratio, iii) aspect ratio, iv) rolls accessibility, v) steel consumption, vi) CO2 footprint, and vii) disassembly complexity. A synthetic dataset of 20,000 configurations was generated through randomized sampling within plausible design ranges. Each sample is labelled with its calculated performance and sustainability indicators, forming a tabular dataset suitable for training the conditional generative model. The inputs of the ctGAN, shown in Table 1, define the conditioning vector c that constrain the layout generation.
Table 1: Inputs of the eco-storage architect.
Table available in the original PDF paper.
Indicator Unit Description Required Available space m2 Total floor area Yes Aspect ratio - Ratio of width to height of the space Yes Storage capacity tons Total roll mass that can be stored Optional
Continued
Generative AI for Sustainable and Efficient Layout Designs 73
Table 1: Continued Indicator Unit Description Required
Table available in the original PDF paper.
Space usage % Area efficiency (used vs. available) Optional Rolls accessibility % Rolls reachable under partial failure Optional Steel used kg Structural steel required Optional CO2 footprint Tons Emissions based on material use Optional To ensure robustness and diversity, the Eco-Storage Architect generates multiple candidate layouts for each user request, which are evaluated using a set of pre-defined metrics based on the resulting technical and environmental indicators of the layouts. The top three candidates that most closely satisfy user’s input constraints are selected. This process ensures that: i) the outputs are technically feasible and aligned with user priorities, ii) trade- offs among conflicting indicators can be easily visualized and compared, iii) the generative process avoids convergence to local optima, as traditionally observed in evolutionary or heuristic approaches. The list of outputs is described in Table 2.
Table 2: Outputs of the eco-storage architect.
Table available in the original PDF paper.
Outputs Format Description Layout .png Visualization of the crane and aisle configuration. Technical report .csv Report including the design parameters. KPIs .csv File including the performance indicators.
ctGAN Model Configuration. To generate realistic and constraint-aware layout configurations, we employed a Conditional Tabular GAN (ctGAN) from the Synthetic Data Vault (SDV) framework. The generator was configured with two hidden layers of 64 units each and used ReLU activation functions with Batch Normalization enabled. The learning rate was set to 0.0002 with a weight decay of 1e-6, and training was carried out over 250 epochs using a batch size of 500. The discriminator comprised a single hidden layer of 48 units, with identical learning rate and decay settings. The model applied min–max normalization during preprocessing to ensure stable convergence and compatibility with mixed data types. This configuration allowed the ctGAN to capture both structural patterns and conditional dependencies within the layout dataset effectively.
RESULTS
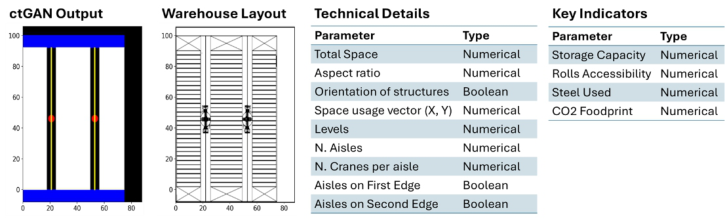
Figure 2 shows one of the candidate layouts generated by the Eco-Storage Architect for a warehouse design scenario with fixed available space and aspect ratio. On the left, the spatial configuration is visually rendered, while the right presents the associated technical and eco indicators as output by the tool. The warehouse layout includes three aisles (in black), three stacker cranes (in red), and three storage areas (in white), with the blue sections representing the buffer zones. The structured output includes both technical specifications and sustainability indicators, which are automatically
computed for the generated design. The CO2 and steel metrics are particularly useful for sustainability assessments, while the disassembly score and rolls accessibility relate to maintenance and resilience under failure conditions.
Figure 2: Overview of the eco-storage architect pipeline. From left to right: (1) ctGAN output, (2) warehouse layout, (3) technical details, and (4) key indicators.
To quantitatively assess the quality of the synthetic data generated by the Eco-Storage Architect, a set of evaluation metrics were computed using the SDV library. Table 3 shows the statistical analysis of the generated data with respect to the original dataset.
Table 3: Global statistical comparison between real and synthetic data using metrics such as CSC, CPTS, OS, MACD, and MMD2 to evaluate distributional similarity and pairwise trends.
Table available in the original PDF paper.
CSC CPTS OS MACD MMD2 Value 94.52 % 89.64 % 92.08 % 0.0668 0.0002
The results shown in Table 3 demonstrate strong overall fidelity to the original dataset. The model achieved a Column Shapes Score of 94.52%, indicating strong alignment between the marginal distributions of individual features in the real and synthetic datasets. The Column Pair Trends Score achieved 89.64%, reflecting solid preservation of pairwise relationships such as correlations and co-occurrence patterns. These two scores combine to yield an Overall Score of 92.08%, reflecting a high degree of fidelity across both univariate and bivariate distributional properties. In addition, the Mean Absolute Correlation Difference (MACD) was 0.0668, showing that the overall correlation structure is well maintained. Finally, the squared Maximum Mean Discrepancy (MMD2) was found to be as low as 0.0002, confirming a high degree of multivariate similarity between real and synthetic data. Together, these results validate the reliability of the ctGAN model in generating realistic warehouse layout configurations suitable for design tasks and sustainability-focused analysis.
In addition to global evaluation metrics, we examined the fidelity of individual features using the Kolmogorov–Smirnov (KS) statistic, corresponding p-values, and the Wasserstein distance normalized by the standard deviation of each real feature, shown in Table 4.
Generative AI for Sustainable and Efficient Layout Designs 75
Table 4: Per-feature evaluation of real vs. synthetic data using the Kolmogorov– Smirnov statistic, p-value, and Wasserstein distance.
Table available in the original PDF paper.
Indicator KS Statistic p-Value Wasserstein/σ Orientation of Supporting structures 0.0716 0.0000 0.1467 Space Usage Along X-direction 0.0615 0.0000 0.1207 Space Usage Along Y-direction 0.0381 0.0000 0.0751 Levels 0.0267 0.0002 0.0439 N. aisles 0.0494 0.0000 0.0893 N. cranes per aisle 0.0808 0.0000 0.2301 Aisles on First Edge 0.0143 0.1307 0.0290 Aisles on Second Edge 0.0213 0.0048 0.0431 Storage capacity 0.0470 0.0000 0.1040 Rolls Accessibility 0.0702 0.0000 0.1232 Steel used in structure 0.0267 0.0002 0.0634 CO2 footprint 0.0455 0.0000 0.0821
Most features exhibited low KS statistics (below 0.08), indicating a strong alignment between real and synthetic distributions at the marginal level. Normalized Wasserstein distances remained below 0.15σ for nearly all features, further confirming high distributional similarity. Notably, the variables “Orientation of Supporting Structures”, “Space Usage Along X-direction”, and “Rolls Accessibility” presented slightly higher divergence values, though still within acceptable limits. The feature “Number of Cranes per Aisle” showed the highest Wasserstein distance (0.2301), likely due to its low cardinality and sparse representation, which are known to be challenging for generative models in tabular domains. Overall, these results demonstrate that the ctGAN model performs well not only at a multivariate level but also in accurately reproducing the statistical properties of key technical and sustainability indicators individually.
CONCLUSION
The results obtained with Eco-Storage Architect demonstrate the potential of generative models to enhance early-stage industrial layout design by balancing operational efficiency with sustainability goals. By leveraging a Conditional Tabular GAN (ctGAN), the tool is able to explore a high- dimensional design space and generate feasible warehouse configurations that satisfy spatial constraints while optimizing for key performance indicators (KPIs) such as space utilization, material accessibility, and process flow. Compared to baseline layouts or heuristic-based planning, the ctGAN-generated configurations exhibit increased layout diversity and better alignment with eco-efficiency criteria.
One of the most significant contributions of Eco-Storage Architect is its ability to incorporate sustainability-related metrics—such as energy, material flow optimization, and space usage efficiency—directly into the generation process. This enables a shift from reactive evaluation to proactive generation of sustainable layouts. Furthermore, by integrating domain- specific constraints, the tool ensures that the generated configurations are not
only theoretically optimal but also practically deployable within real-world facility limitations.
Nevertheless, the model’s effectiveness is dependent on the quality and representativeness of the training data. While synthetic data generation helps to augment the training set, real-world warehouse datasets with annotated performance indicators remain limited. Additionally, the current version does not yet account for dynamic operational factors such as time-based logistics flows or varying storage demands, which may limit its applicability to static layout optimization scenarios.
Future enhancements to Eco-Storage Architect will include multi- objective optimization to balance trade-offs between space, cost, and sustainability, and dynamic hyperparameter tuning to improve model adaptability across scenarios. Modelling temporal factors (e.g., fluctuating demand), incorporating simulation feedback, and adding human-in-the-loop interaction, will make the tool more robust and usable. Finally, expanding to other facility types and integrating with digital twins will support real-time, adaptive layout optimization.
ACKNOWLEDGMENTS
This work has been supported by the project “Digital assets and tools for Circular value chains and manufacturing products” (DaCapo), which has received funding from the Euro-pean Union’s Horizon Europe research and innovation programme under grant agreement No. ID: 101091780. Views and opinions expressed are however those of the author(s) only and do not necessarily reflect those of the European Union o HADEA. Neither the European Union nor the granting authority can be held responsible for them.
REFERENCES
Aalaei, M., Saadi, M., Rahbar, M. & Ekhlassi, A., 2023, ‘Architectural layout generation using a graph-constrained conditional Generative Adversarial Network (GAN)’, Automation in Construction, 155, 105053. Bourou, A., Mezger, V. & Genovesio, A., 2024, ‘GANs Conditioning Methods: A Survey’. Gandhi, S., Rana, H. & Bhatt, N., 2025, ‘Conditional GANs in Image-to-Image
Translation: Improving Accuracy and Contextual Relevance in Diverse Datasets’, Procedia Computer Science, 252, 954–963. Gonzalez-Val, C. & Muinos-Landin, S., 2020, ‘Generative design for Social Manufacturing’, EU Open Research Repository. Goodfellow, I., Pouget-Abadie, J., Mirza, M., Xu, B., Warde-Farley, D., Ozair, S., Courville, A. & Bengio, Y., 2020, ‘Generative adversarial networks’, Communications of the ACM, 63(11), 139–144. Gregores Coto, A., Precker, C. E., Andersson, T., Laukkanen, A., Suhonen, T.,
Rodriguez, P. R. & Munos-Landn, S., 2023, ‘The use of generative models to speed up the discovery of materials’, Computer Methods in Material Science, 23(1). Kirchherr, J., Reike, D. & Hekkert, M., 2017, ‘Conceptualizing the circular economy: An analysis of 114 definitions’, Resources, Conservation and Recycling, 127, 221–232. Nareklishvili, M., Polson, N. & Sokolov, V., 2024, ‘Generative Modeling: A Review’.
Generative AI for Sustainable and Efficient Layout Designs 77
Nauata, N., Chang, K. H., Cheng, C. Y., Mori, G. & Furukawa, Y., 2020, ‘House- GAN: Relational Generative Adversarial Networks for Graph-constrained House Layout Generation’, Lecture Notes in Computer Science (including subseries Lecture Notes in Artificial Intelligence and Lecture Notes in Bioinformatics), 12346 LNCS, 162–177. noman, A. A., Akter, U. H., Pranto, T. H. & Haque, A. B., 2022, ‘Machine Learning
and Artificial Intelligence in Circular Economy: A Bibliometric Analysis and Systematic Literature Review’, Annals of Emerging Technologies in Computing, 6(2), 13–40. Rohde, F., Wagner, J., Meyer, A., Reinhard, P., Voss, M., Petschow, U. & Mollen, A., 2024, ‘Broadening the perspective for sustainable artificial intelligence: Sustainability criteria and indicators for Artificial Intelligence systems’, Current Opinion in Environmental Sustainability, 66. Salehi, P., Chalechale, A. & Taghizadeh, M., 2020, ‘Generative Adversarial Networks
(GANs): An Overview of Theoretical Model, Evaluation Metrics, and Recent Developments’. SDV Team, 2024, Synthetic Data Vault (SDV), https://sdv.dev/. Shafiee, S., 2025, ‘Generative AI in manufacturing: A literature review of recent applications and future prospects’, Procedia CIRP, 132, 1–6. Süße, M. & Putz, M., 2021, ‘Generative design in factory layout planning’, Procedia
CIRP, 99, 9–14. Wu, A. N., Stouffs, R. & Biljecki, F., 2022, ‘Generative Adversarial Networks in the built environment: A comprehensive review of the application of GANs across data types and scales’, Building and Environment, 223, 109477. Xu, L., Skoularidou, M., Cuesta-Infante, A. & Veeramachaneni, K., 2019, ‘Modeling
Tabular data using Conditional GAN’, Advances in Neural Information Processing Systems, 32.
LISTED IN THE AHFE DIGITAL BOOKSTORE CATALOGUE
Explore the complete digital volume
Human Interaction and Emerging Technologies (IHIET 2025)
Read this individual research paper free through the original publisher, or explore the full digital proceedings book.
ISBN 978-1-964867-73-1
Explore this ISBN in the AHFE Bookstore ↗Listed in the July 2026 bookstore catalogue; search by ISBN to confirm current availability · Digital book purchase optional