Hermann Prossinger, Silvia Boschetti, Tomas Hladky, Daniel Riha, Martin Stachon, Jan Slavik, Jakub Binter (2025). Personality Traits in 12 Countries Defined by the ‘Big Five’ are Found to Have a Culture Dependency: Implications for Modeling Citizens’ Personalities. In: Human Interaction and Emerging Technologies (IHIET 2025). AHFE Open Access, vol. 197, pp. 182–192. https://doi.org/10.54941/ahfe1006711
1 Faculty of Social and Economic Studies, University of Jan Evangelista Purkynˇe, Ústí nad Labem, Czech Republic; Department of Evolutionary Anthropology, University of Vienna, Vienna, Austria ↗
2 Faculty of Social and Economic Studies, University of Jan Evangelista Purkynˇe, Ústí nad Labem, Czech Republic ↗
3 Faculty of Social and Economic Studies, University of Jan Evangelista Purkynˇe, Ústí nad Labem, Czech Republic; Faculty of Humanities, Charles University, Prague, Czech Republic ↗
4 Faculty of Social and Economic Studies, University of Jan Evangelista Purkynˇe, Ústí nad Labem, Czech Republic; Faculty of Science, Charles University, Prague, Czech Republic ↗
This study critically evaluates the reliability and validity of the widely used Five Factor Model (FFM) or 'Big Five' personality traits framework across 12 Latin American countries. Conventional psychometric assessments based on factor analysis have significant methodological limitations when applied to categorical data. Addressing these concerns, we employed a Bayesian statistical approach utilizing Dirichlet and Beta distributions for categorical responses obtained from 5,175 participants who completed the IPIP-R questionnaire. Our novel methodology includes Monte Carlo simulations, confusion matrices, and probability density function estimations, effectively compensating for inherent sample size imbalances. Findings demonstrate substantial cultural variations in the distribution of personality traits, contradicting the presumed universality of the FFM. Additionally, notable differences were observed between male and female respondents, influenced by nationality. Furthermore, natural language processing techniques combined with the UMAP dimensionality reduction algorithm revealed that linguistic clustering of questionnaire items does not explain cultural differences. Our results demonstrate the inadequacy of factor analysis for analyzing categorical psychometric data, necessitating instead rigorous Bayesian methods. This study significantly impacts how personality assessments should be utilized in policymaking, corporate environments, and artificial intelligence applications, emphasizing the necessity of culturally sensitive and statistically robust approaches. The outcomes are discussed in relation to creation of citizen profiles and advanced personality modelling.
Personality Traits in 12 Latin American Countries Show Cultural Dependencies 183
INTRODUCTION
Political and economic decision-makers have long sought for functional methods to gain deeper insights into the thoughts, attitudes, and behaviors of their citizens. By now, the decision-makers have found ways to directly query preferences but also found that structured psychological assessments provide a partial solution. One of the most significant tools in this regard is studying personality, which plays a crucial role in shaping human behavior, human choice preferences, and decision-making processes. This includes their tendency to take part in local government interaction and their expectations from it (Hjortskov, 2021; Hugg & LeRoux, 2019; Zhao, 2023). Personality traits, as measured by established models such as the Big Five (Openness, Conscientiousness, Extraversion, Agreeableness, and Neuroticism), have been linked to political preferences, economic choices, and social attitudes (Puech et al., 2020). Large-scale surveys and psychometric questionnaires allow governments, corporations, and policymakers to analyze patterns of collective behavior, predict societal trends, and tailor policies to better align with public needs. Moreover, advancements in computational social science, such as AI-driven sentiment analysis and psychographic profiling, enhance the ability to infer personality-related traits from digital footprints, even modelling impact of suggested changes (Binter et al., 2025).
In the FFM (‘Five Factor Model’), first proposed by Goldberg et al. (1992), human personalities can be psychometrically determined by a questionnaire, with five response options (from A “strongly agree”to E “strongly disagree”). The currently used 50 queries enable the characterization of the afore- mentioned five personality traits. Subsequently, there have been two threads of debate. One, whether psychometrics is a valid tool in psychology (as some fundamentally negate the quantitative/numerical approach to psychological aspects of humanness), and two, whether the FFM is valid across different cultures (Church, 2016) — not only because of the issue of translatability of the queries originally formulated in English.
Artificial intelligence and machine learning gave us, researchers, the possibility to approach many problems differently because previously the computational power and method available were a bottleneck. This has led to inconsistent results, replication crisis, and lack of trust in scientific methods. Among these: how to handle the questionnaire data. Currently still an issue since psychometric methods are prone to be developed and performed by those well-versed in the humanities rather than in statistics and applied mathematics. This leads to rules of thumb being perceived as hardwired and change is considered problematic as comparison would then be impossible.
An increasing number of analyses of human attitudes, behaviors and personality features (‘traits’) are being published, due to the vast data sets available. If the rejection of the psychometrics paradigm is accepted, then FFM analyses are naught. If the psychometric paradigm is accepted (as we do in this paper), then the challenge is two-fold: whether there are cultural differences (thereby questioning the claim of universal presence of five traits, for example) and whether the statistical method of factor analysis is fallacious (we claim it is in this paper).
The five possible responses to each query are categorical variables. These can be converted into ordinal numbers, but not cardinal numbers. For factor analysis, the conversion from ordinal numbers to cardinal numbers is necessary, because factor analysis relies on matrix operations (which include additions/subtractions and multiplications/divisions). If, due to Bayes Theorem, this conversion is not permitted, the factor analysis outcomes are invalid (Prossinger et al., 2023). In most uses of factor analysis of categorical data, the ordinal numbers {1, 2, 3, 4, 5} are (fallaciously) directly converted to (mapped into) cardinal numbers (1, 2, 3, 4, 5). We supply a (limited) survey of various maps from ordinal numbers into cardinal numbers in the Discussion section. In sports, the application of point systems shows that governing bodies are acutely aware of this fallacy. Likewise, in medicine, the conversion of pain scales or cancer stages to cardinal numbers is notorious and the attendant misdiagnoses has been pointed out (Fritsch et al., 2024; Prossinger et al., 2023).
There is no necessity of converting the categorical responses to cardinal numbers, and not doing so prevents fallacious statistical inferences (despite ostentatious protests by adherents of factor analysis methodology). In the cases of query response items {A, B, C, D, E}, Bayes Theorem leads to the observation that the responses for each query are Dirichlet-distributed (Silvia, 2008). If there are nA responses to category A, nB responses to category B, etc., then the n responses
Equation reproduced from the original PDF.
are distributed as a Dirichlet distribution Dir(α, β, γ , δ, ε) with a pdf (probability density function)
with α = nA + 1, β = nB + 1, γ = nC + 1, δ = nD + 1, ε = nE + 1, and 0(· · · ) is the Gamma function (Abramowitz & Segun, 1968). We note that the nA, etc. are cardinal numbers, because they are the frequencies of occurrences of the response categories to a given query. Therefore, the fallacy of converting ordinal numbers to cardinal numbers does not occur. As we elaborate in the Methods section, the Dirichlet distributions of each query, for each (biological) sex, for each country are determined separately.
A further way to deal with the (dis)similarity that may be independent of the human responses is to use the natural language processing; concretely, using embeddings from a pre-trained LLM (large language model). These vector representations of queries are high-dimensional; they can be mapped into a lower-dimensional space (Fig. 1(right)), allowing for efficient comparison and similarity estimation (Mars, 2022).
We are not the first to use these embeddings; there have been repeated attempts since 2020 (for descriptions of first attempts, see Fang et al., 2022)
Personality Traits in 12 Latin American Countries Show Cultural Dependencies 185
and they are ongoing (Milano et al., 2025). Thus, what is missing is freeing the method of the factorial structure, such as SEM (Structural Equation Modeling), as criticized by Prossinger et al. (2023) for lack of mathematical rigor.
MATERIALS
The data set consists of the responses to the BIG FIVE (IPIP-R, Cupani & Lorenzo-Seva, 2016) questionnaire: 50 queries in five trait subdivisions. (Questionnaires rarely contain questions; they always contain queries — questions being a subset of queries. The participants always respond; they only answer when a query is a question.) The queries were posed in Spanish to 5175 persons from 12 Latin American countries: Argentina, Bolivia, Chile, Colombia, Costa Rica, Ecuador, Honduras, Mexico, Paraguay, Peru, Uruguay, and Venezuela. In addition to the responses on a five-point scale from E (“strongly disagree”) to A (“strongly agree”), we also included, in our analysis, the respondents’ biological sex. The distribution of respondents is shown in Table 1.
The sentence transformer used for embedding is paraphrase-multilingual- MiniLM-L12-v2 (https://huggingface.co/sentence-transformers/paraphrase- multilingual-MiniLM-L12-v2) which maps sentences and paragraphs into a 384-dimensional (dense) vector space and consists of a BertModel and a Pooling layer. It is often the model of choice for multilingual topic modelling and so the proposed method can be applied to numerous other supported languages.
Table 1: The distribution of the 5145 respondents to the 50 queries in the 12 Latin American countries. The ratios of males to females indicate a considerable range of imbalances.
Each response was given on a five-category scale, so the cumulative responses for a given country and a given biological sex would be a Dirichlet distribution with five parameters. Because, for our analyses of comparing response distributions of country X with country Y, the five-parametric distributions require larger sample sizes than are available in the data set, we converted to three-parametric Dirichlet distributions by combining response categories A and B, as well as D and E: each individual’s response to each query was thus converted to AB (“agree”), C (“neutral”), and DE (“disagree”).
For each of the 50 queries, there are 66 comparisons for the 12 countries, and 2 × 66 comparisons for the biological sexes (F/F and M/M).
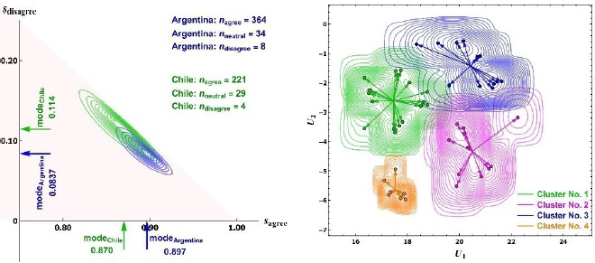
We detail the further methodology using a specific example. We compare the three-parametric response distribution of 409 females from Argentina with the 257 females from Chile to the query “I care about the well-being of others” (Figure 1(left)). For Argentina, the Dirichlet distribution is DirArgentina(365 35 9) = distA while that for Chile is DirArgentina(365 35 9) = distB. We compute the confusion matrix by a Monte Carlo method, with a further random sampling correction which we describe in detail as well, after the general outline.
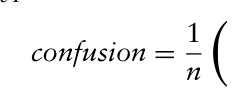
For country X, we generate n = 1000 random numbers ranX from distX and, likewise, n = 1000 random numbers ranY from distY. A confusion matrix is computed by, first, computing ntrueX = pdf(distX, ranX) > pdf(distY, ranX) and nFalseX = n −nTrueX. Likewise, for country Y, we compute ntrueY = pdf(distY, ranY) > pdf(distX, ranY) and nFalseY = n −nTrueY. The confusion matrix is then
.
Equation reproduced from the original PDF.
nTrueA nFalseA nFalseB nTrueB
If both off-diagonal elements are (for some threshold threshold chosen prior to the investigation), 1
nnFalseX < threshold and 1
nnFalseY < threshold, then distributions distX and distY are significantly different. At 95% significance level, threshold = 0.10 (Caelen, 2017). Significantly different distributions infer that the distribution of response samples from country X versus country Y are significantly different, indicating (possibly) a cultural effect (see Discussion).
However, this inference of a significant difference is valid only if the sample sizes of both countries for a comparison are equal — which they are not (for none of the country comparisons, for all queries, and for both biological sexes; Table 1). We deal with this imbalance in a novel way.
To correct for this imbalance in sample sizes, we use the method of repeated, random sampling. In this example, sampleX > sampleY, so we randomly sample from sampleX a sample of size sampleY repeatedly (in this manuscript 100 repeats). We therefore obtain 100 confusion matrices. The 100 off-diagonal elements nFalseX and nFalseY are each Beta-distributed (because 0 ≤nFalseX ≤1 and 0 ≤nFalseY ≤1). From the 100 Monte-Carlo generated nFalseX we estimate the parameters α and β of the ML (most likely) distribution Beta (αX, βX), and for nFalseY also Beta (αY, βY). For each of these we obtain the modes modeX = αX −1 αX + βX −2 and modeY = αY −1 αY + βY −2.
These modes are the ML off-diagonal elements, and they are both used to test whether the distributions from country X and country Y are significantly different. Only if both ML nodes of the off-diagonal elements are less than threshold is there a significant difference and therefore a culture effect. This computational load is 660 million confusion matrix computations and 264 analyses of significant versus non-significant distributions in the heat maps.
Personality Traits in 12 Latin American Countries Show Cultural Dependencies 187
We further investigate the linguistic meaning of the queries by embedding the 50 queries (in Spanish) into 50 384-dimensional embedding vectors. We dimension-reduce the embedding vectors to 2 dimensions by using the UMAP dimension-reducing algorithm (McInnes et al., 2018). The distribution of the 50 resulting points in the plane is not uniform (Fig. 1(right)) and we search for possible clustering. We use the nearest-neighbor clustering algorithm and then apply KDE (kernel density estimation) with an Epanechnikov kernel to each of the clusters. We again use the method of confusion matrices (pairwise, because we have four likelihood functions, one for each cluster) to determine whether the likelihood functions are significantly different and, therefore, the outcomes of the clustering algorithm are significantly different.
RESULTS
In Fig. 1(left), we show the overlap of the likelihood functions (the pdf of the 3-parametric Dirichlet distribution) of females from Argentina versus the females from Chile. The likelihood functions are significantly different.
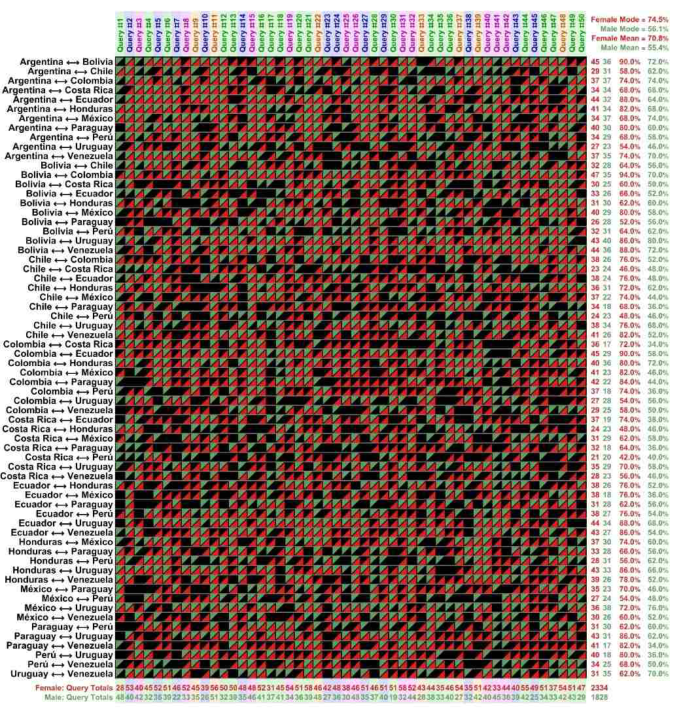
There are 66 country comparisons for each of the 50 queries, so there 3300 comparisons for females and 3300 comparisons for the males. The results are shown in Fig. 2. For each query and each (biological) sex, the number of significant differences is entered below the query column. Of the 3300 comparisons for the females, 2334 (70.7%) significant differences have been detected; for the males 1828 (55.4%) are significantly different. We also list the results as country comparisons (rows) across all queries along with their percentages. These percentages are beta-distributed, and we compute the mode and mean (the expected value) of the male and the female beta distribution. We note that the mode for the females is higher than that of the males; this is due to the imbalance in the number of queries in each country — an issue we address in the Discussion section. We also note that mode and mean are different, because both Beta distributions are asymmetric — the one for females more strongly so.
Figure 1: The likelihood functions as contour plots. Contours are in steps of 1/10 the maximum likelihood. Left: detail in the region of the modes. The confusion matrix is used to calculate the significance of overlap. Right: contour plots of the clusters of the dimension-reduced embeddings of the 50 Spanish queries. The 2-dimensional vectors that result from dimension reduction are the points in the graph. The colored vectors to these points are from the center of mass of these points (not: the mode of the likelihood function).Figure 2: The heat maps for the significantly different likelihood functions for the females’ and the males’ responses to the 50 queries for all 66 country comparisons. Red triangles show the comparisons that are significantly different for the females, green triangles those for the males. The numerical entries at the base of the graph show the totals of significant differences for each query and each biological sex — therefore inferring the frequency of a culture effect for each query. The columns in the right margin show the color-coded totals of significant cultural differences per country comparison as well as the fraction of 50 queries. Because these sex-specific fractions are Beta-distributed, we estimate the ML (most likely) Beta distribution for each of these. The expectation values (means) and modes of these two Beta distributions are listed in the upper right-hand corner. We observe that the cultural effect is much larger in females than in males.
In Fig. 1(right), we have color-coded the embedding cluster membership. We test whether the clustering may influence the significance of cultural differences between countries. We simply collect the entries (female totals, say) at the base of the heat map(s) as a fraction of 50 for one embedding cluster versus a different one. Again, these fractions are Beta-distributed. We obtain six female-female comparisons, six male-male comparisons, and six female-male comparisons. All these 18 comparisons
Personality Traits in 12 Latin American Countries Show Cultural Dependencies 189
are tests using confusion matrices and for all 18 comparisons we find no significant differences. We thus can infer that the clustering of the Spanish in the queries is not the reason for the cultural differences. Because none of these comparisons are significantly different, we need not make comparisons subscale-subscale. (If some comparisons had been significantly different, we would have needed to test for significance of subscale comparisons).
DISCUSSION
We contrast and critique the factor analysis approach to analyzing the data set. Based on the fallacy of mapping ordinal variable scores {A, B, C, D, E} as ordinal numbers {1, 2, 3, 4, 5} into cardinal numbers (1, 2, 3, 4, 5) none of the conclusions that have been found by using factor analysis are valid. A different way of identifying this fallacy is to repeat the factor analysis using other maps, such as: (a) Formula I point system {A, B, C, D, E} → (25, 18, 15, 12, 10); (b) Fibonacci numbers above 2 {A, B, C, D, E} → (3, 5, 8, 13, 21); (c) the first five sexy primes (OEIS A023201 and A046117; Weinstein, online) {A, B, C, D, E} → (5, 7, 11, 13, 17); (d) FIS Alpine skiing {A, B, C, D, E} →(100, 80, 60, 50, 45); (e) the first odd Thâbit ibn Kurrah numbers (OEIS A055010; Weinstein, online) {A, B, C, D, E} → (5, 11, 23, 47, 95); (e) the first five exponents of Cullen primes n×2n+1 (OEIS A005849; Cullen, 1905) {A, B, C, D, E} →(1, 141, 4713, 5795, 6611) - and so on. One should, if the map of the categorical variables into this suite of cardinal numbers is not fallacious, obtain six congruent outcomes, namely the results obtained by Cupani et al. (2025) for the maps (a) to (e).
There is another serious shortcoming in the analysis presented by Cupani et al. (2025). The data set is not balanced as per males versus females. Rather than discarding some female entries (a wide-spread approach), we present the novel, proper way of dealing with this imbalance by repeatedly (here: 100 times) randomly sampling the larger set and drawing conclusions from the beta distributions of the off-diagonal entries.
A further shortcoming is based on the biased data collection: education level, etc. of the respondents were not balanced in any of the 12 countries. Because we have detected cultural effects, this shortcoming cannot be construed as a confirmation of FFM.
The inferences presented by Cupani et al. (2025) involving recreational activities (drug consumption, creativity, and so on) cannot be relied on. The Bayesian method presented here shows why. If these six recreational activities are included, then the Dirichlet distributions are 11-parametric — the curse of dimensionality. Sample sizes in the millions would be needed because the pdfs of the 11-parametric Dirichlet distributions are so ‘spread out’ in parameter space.
We have fastidiously avoided including age as a variable, because it is a metric one. Converting age into a categorical variable, as Cupani et al. (2025) have done (one category is 18 to 30 years, the second is above 30 years — what is the statistical justification of this boundary choice, if one accepts conversion to categorical variables?), is difficult to comprehend. First, one
converts a metric variable into a categorical one, then maps the resultant categorical variable into two cardinal numbers — in effect converting any cardinal number between 18 and 30 to 1 and any cardinal number above 30 into 2. Analysis of the combination of metric and categorical variables (called the ‘Titanic problem’) is notoriously difficult and necessitates a tailored approach which must be done on a data set by data set basis (Binter et al., 2025).
CONCLUSION
Despite the long list of publications dealing with numerous populations in very many geographically distinct regions that seem to confirm the existence of five traits, there is no overwhelming evidence that FFM inferences and conclusions are valid, because of the (erroneous) mapping of ordinal numbers into cardinal numbers. Publications assert that, by and large, the five personality traits can be found irrespective of cultures of which the people are members. We find, quite the contrary, that there is an overwhelming cultural effect; it can only be found by statistical methods compatible with Bayes Theorem — which factor analysis is not. We could not identify the cultural effect in greater detail than we have done here, if we restrict ourselves to Dirichlet distributions (because of the nature of the data set and small sample sizes).
For the above-mentioned reasons, future attempts for modeling citizen behavior or attitudes relying on the questionnaire data should use Dirichlet distributions as model input and rely on the relevant features being selected in a process as described in Binter et al. (2025).
Personality traits (irrespective of their cultural dependencies) are important attributes not only for psychological research. Knowledge of these attributes modulate political and societal policies. Consider the scenario of different suburbs in a city: one in an affluent neighborhood, another in a poverty- stricken one. Any intervention with the intent of motivating the inhabitants of the poor neighborhood (to pursue a healthier lifestyle, say) will depend on how such interventions can be perceived by them; knowledge of their personality traits is imperative. Our findings that the personality traits have a cultural dependency most emphatically stress that the FFM model cannot be used because such decisions would be based on an unjustified method. Relevant method-driven decision making and fine-tuning the best methods to describe and classify personality traits or to use specifically chosen sets of queries permit considerable insight into populational psychology. This approach aligns with the emerging field of computational psychometrics. It is of utmost importance to base the applied decision-making on statistically valid methodologies and thereby foster transparency and accountability during the decision-making process.
ETHICS STATEMENT The data used for this manuscript were generated using random number generators (Wolfram Technologies®) applied to the data set available at https://doi.org/10.17605/OSF.IO/JU2YQ.
Personality Traits in 12 Latin American Countries Show Cultural Dependencies 191
ACKNOWLEDGMENT
This publication is an output of the RUR project (RUR — Region to University, University to Region), reg. no. CZ.10.02.01/00/22_002/0000210, funded by the European Union. D. ˇR. is also funded by the Ministry of Education, Youth and Sports, Czech Republic, and the Institutional Support for Long-term Development of Research Organizations, Faculty of Humanities, Charles University, Czech Republic (Grant COOPERATIO “Arts and Culture”).
REFERENCES
Abramowitz, M. & Segun, I. A. (1968) Handbook of Mathematical Functions with Formulas, Graphs, and Mathematical Tables. Dover, New York, NY, USA. Binter, J., Hladký, T., ˇRíha, D., Stachon, M., Slavík, J., & Prossinger, H. (2025).
Citizen2Vec: A Serious Game for Simulating Policy Impacts on Urban Populations. In: Proceedings of the 7th International Conference on HCI in Games (HCI- Games), HCI International 2025, Gothenburg, Sweden, June 22–27, 2025. Caelen, O. (2017). A Bayesian interpretation of the confusion matrix. Annals of Mathematics and Artificial Intelligence, 81(3), 429–450. Church, A. T. (2016). Personality traits across cultures. Current Opinion in
Psychology, 8, 22–30. Cullen, J. (1905), “Question 15897”, Educ. Times. 534. Cupani, M., & Lorenzo-Seva, U. (2016). The development of an alternative IPIP inventory measuring the Big-Five factor markers in an Argentine sample. Personality and Individual Differences, 91, 40–46. Cupani, M., Lorenzo-Seva, U., & Morán, V. (2025) Personality Traits in Latin America: A Cross-Cultural Study of the Big Five Factor Structure and its Relationship with Self-Reported Daily Behaviors. Journal of Personality Assessment, 107(1), 89–99. doi: 10.1080/00223891.2024.2353139. Fang, Q., Nguyen, D., & Oberski, D. L. (2022). Evaluating the construct validity of
text embeddings with application to survey questions. EPJ Data Science, 11(1), 39. Gerhard Fritsch, G., Steltzer, H., Oberladstaetter, D., Carolina Zeller, C., & Prossinger, H. (2023) Artificial intelligence algorithms predict the efficacy of analgesic cocktails prescribed after orthopedic surgery. PLoS ONE, 18(2): e0280995. https://doi.org/10.1371/journal.pone.0280995. Goldberg, L. R. (1992) The Development of Markers for the Big-five Factor Structure. Psychological Assessment, 4(1), 26–42. doi: 10.1037/ 1040-3590.4.1.26. Hjortskov, M. (2021). Personality traits in citizen expectations towards public
services. Journal of Behavioral Public Administration, 4(1). Hugg, V. G., & LeRoux, K. (2019). Personality traits as predictors of citizen engagement with local government. Journal of Behavioral Public Administration, 2(2). Mars, M. (2022). From word embeddings to pre-trained language models: A stateof-the-art walkthrough. Applied Sciences, 12(17), 8805. McInnes, L., Healy, J., & Melville, J. (2018). Umap: Uniform manifold approximation and projection for dimension reduction. arXiv preprint arXiv:1802.03426. Milano, N., Luongo, M., Ponticorvo, M., & Marocco, D. (2025). Semantic Analysis
of test items through Large Language Model embeddings predicts a-priori factorial structure of personality tests. Current Research in Behavioral Sciences, 100168.
Prossinger, H., Boschetti, S., ˇRíha, D., Pacovský, L., & Binter, J. (2023). From Stone Age to New Age Statistics: How Neural Networks Overcome the Irreproducibility Problems in Choice-Based Profile Creation. In: International Conference on Human-Computer Interaction (pp. 273–284). Cham: Springer Nature Switzerland. Puech, C., Dougal, J., Deery, C., Waddell, C., & Mõttus, R. (2020). Openness is related to pro-environmental behavior both within and across families. Environment and Behavior, 52(9), 996–1011. Roccas, S., Sagiv, L., Schwartz, S. H., & Knafo, A. (2002) The Big Five Personality
Factors and Personal Values. Personality and Social Psychology Bulletin. 28(6), 789–801. doi: 10.1177/0146167202289008. Silvia, D. S. (with Skilling, J.) (2008) Data Analysis. A Bayesian Tutorial. Oxford University Press, UK. Weinstein, E. W. “Sexy Primes.” From MathWorld — A Wolfram Web Resource.
https://mathworld.wolfram.com/SexyPrimes.html. Weinstein, E. W. “Thâbit ibn Kurrah Number.” From MathWorld — A Wolfram Web Resource. https://mathworld.wolfram.com/ThabitibnKurrahNumber.html. Zhao, Y. (2023). The correlation between the Big Five personality traits and political
information exposure. Chinese Public Administration Review, 14(1), 39–53.
LISTED IN THE AHFE DIGITAL BOOKSTORE CATALOGUE
Explore the complete digital volume
Human Interaction and Emerging Technologies (IHIET 2025)
Read this individual research paper free through the original publisher, or explore the full digital proceedings book.
ISBN 978-1-964867-73-1
Explore this ISBN in the AHFE Bookstore ↗Listed in the July 2026 bookstore catalogue; search by ISBN to confirm current availability · Digital book purchase optional