Kenneth Y T Lim, Amy Low, Isabella Lim (2025). Evaluating the Effectiveness of Machine Learning Algorithms in Stock Price Prediction Across Different Time Frames. In: Human Interaction and Emerging Technologies (IHIET-FS 2025): Future Systems and Artificial Intelligence Applications. AHFE Open Access, vol. 196, pp. 33–42. https://doi.org/10.54941/ahfe1005952
Financial markets, characterized by their volatility, uncertainty, complexity, and ambiguity (VUCA), pose significant challenges for accurate predictions. Investment has become increasingly intertwined with technological advancements, as machine learning models revolutionise the field of stock market trend predictions, offering potential solutions by processing large datasets, identifying trends, and minimizing human bias. While machine learning is increasingly applied in financial forecasting, understanding the relative strengths and weaknesses of different algorithms across varying time frames remains underexplored. This is especially relevant given the rise of algorithmic trading and new stock markets such as cryptocurrencies, underscoring the need for precise, data-driven predictions. The aim of this study is to evaluate the performance of machine learning algorithms in predicting stock prices within Singapore’s banking sector. The study explores how each algorithm performs when trained on different amounts of data, comparing its effectiveness for short-term, mid-term and long-term stock price predictions. To do this, historical stock prices were collected using the Yahoo Finance API, focusing on closing prices as the target variable. Using the data collected from major Singaporean banks, namely DBS, OCBC and UOB, this study evaluated the performance of various machine learning algorithms: Random Forest (RF), Support Vector Regression (SVR), K-Nearest Neighbors (KNN), Artificial Neural Networks (ANN), and Long Short-Term Memory (LSTM). The various models were all trained on different datasets, and its predictions for the closing price on a specific date was recorded. Each model was evaluated using rigorous performance metrics, including percentage error, R² values, mean absolute error, and mean squared error, to determine their efficacy in capturing trends and minimising predictive inaccuracies. Different algorithms have distinct methods of learning patterns and handling data variability, and thus will perform differently under the same conditions. Hence, we hoped to gain greater insight into each model’s performance and assess their adaptability to the various time frames. This study contributes to the growing body of research on AI-driven financial forecasting by providing a comparative analysis of machine learning algorithms in Singapore’s banking sector. It highlights the need for flexibility in one’s approach to algorithmic trading to enhance prediction accuracy across diverse scenarios. The insights gained can aid financial analysts, traders, and decision-makers in developing data-driven strategies for stock market investments, ultimately promoting more informed decision-making and risk management in a volatile financial landscape.
In this day and age, the acronym VUCA has become more and more widely used. Volatility, uncertainty, complexity, and ambiguity. These are the foremost distinct characteristics of financial markets today. With the advent of machine learning and artificial intelligence (AI), the ability to analyse vast amounts of historical data and predict market trends has become increasingly sophisticated. Through this project, we aim to evaluate the accuracy of various machine learning algorithms in predicting stock prices, specifically in the banking sector of Singapore, over different time periods.
In financial markets, real-time and accurate forecasting enables traders to optimize their buying and selling strategies. The ability to predict trends, whether to buy, hold, or sell determines profit and loss, especially when dealing with large sums of money. These critical decisions are based on numerous factors and sizable data sets, contributing to the upward trend of algorithmic trading. Algorithmic models can analyze large datasets faster and more accurately than humans, offering predictions that minimize human bias and emotional decision-making.
For this project, the primary focus will be on Singapore’s banking sector, as banking stocks typically have large trading volumes and consistent reporting, which ensure the availability of reliable, high-frequency data. Moreover, stock prices in the banking sector often reflect not only the companies’ internal performance but also broader economic indicators like interest rates, inflation, and geopolitical events. These characteristics make them ideal for testing machine learning algorithms.
Through our project, we aim to analyse the performance of various machine learning algorithms in predicting trends in the Singapore stock market over different time frames, namely Random Forest (RF), Support Vector Regressions (SVR), K-Nearest Neighbors (KNN), Long Short-Term Memory (LSTM), and Artificial Neural Network (ANN). Additionally, we will evaluate which models are more accurate in their predictions and their reliability in identifying trends in stock prices, based on various markers such as percentage error, R2 value, mean absolute error, and mean squared error.
HYPOTHESIS In short-term predictions, stock prices are often driven by immediate market reactions, noise, or small fluctuations. Algorithms such as RF, SVR, and KNN may perform better in capturing these short-term trends. However, long-term trends are shaped by more complex factors, and algorithms like LSTM and ANN that are designed to model longer dependencies in time-series data may perform better.
METHODOLOGY
Each algorithm was trained on historical stock data from three prominent Singaporean banks - DBS, OCBC, and UOB, and since each machine learning algorithm functions differently, they all utilise unique computational methods
Evaluating the Effectiveness of Machine Learning Algorithms in Stock Price Prediction 35
to identify patterns and trends in the data. When collecting the data, each algorithm was run 5 times for consistency.
The Random Forest (RF) algorithm is a supervised learning model that aggregates predictions from multiple decision trees, each trained on random subsets of the data and features (Simplilearn, 2023). It randomly selects subsets of the training data (X_train, y_train) with replacement, or otherwise known as bootstrapping. If one has N training examples, each subset will contain N samples, but some instances may be repeated due to sampling with replacement.
For each subset, a Decision Tree is trained. First, the data at each node is split based on a feature that minimizes the Mean Squared Error (MSE). For each node, a random subset of features is selected to evaluate the best split. The tree is grown until a stopping criterion is met. Then, the algorithm creates an ensemble of kkk trees (controlled by n_estimators). Each tree is trained independently on its subset of data (Donges, 2021).
To predict the stock price for a target date, each tree in the ensemble provides a prediction for the given input x. The final prediction for the Random Forest is the average of all the tree predictions, utilising the formula below. Taking the average reduces overfitting and variance, making the Random Forest more effective than individual Decision Trees.
k X
Equations and mathematical formulas are available in the original paper PDF.
where:
k: Number of trees in the forest
fj(x): Prediction from the jth tree.
Support Vector Regression (SVR) aims to find a function that approximates the relationship between input features (x) and target values (y), while tolerating small deviations (ϵ) and penalizing larger ones (Chang & Lin, 2001).
Firstly, the model standardizes the features by removing the mean and scaling to unit variance. It then solves the SVR optimization problem using the RBF kernel. It identifies support vectors (training points that lie on or
outside the ϵ-margin) and learns the coefficients αi, αi* (Platt, 2000).
−γ ∥x −xi∥2
γ : Kernel coefficient (controls how far the influence of a single training sample reaches).
∥x −xi∥2: Squared Euclidean distance between two points.
Using this, it predicts the value of the price of the stock using the following formula. For each test point x, the RBF kernel computes its similarity to each support vector xi, weighted by the learned coefficients (αi-αi*), and adds the intercept b.
i : Lagrange multipliers (dual coefficients).
K (x, xi): Kernel function (RBF in this case).
b: Intercept term, learned during training.
xi: Support vectors, the key data points influencing the prediction.
In the K-Nearest Neighbors (KNN) Regression, the prediction is based on the average of the target values of the k-nearest neighbors of the input data point.
First, the algorithm computes the distance, the Euclidean Distance between the input Xpredict and all points in Xtrain (Cunningham & Delany, 2021).
n X
2
xi −yi
where x and y are feature vectors of two points, and n is the number of features.
Next, all the training points are sorted by their distances to Xpredict, and the k-closest points are selected. The average of their target values is used as the prediction for Xpredict.
k X
Long Short-Term Memory (LSTM) networks are a type of Recurrent Neural Network (RNN) specifically designed to address the vanishing and exploding gradient problems that standard RNNs face. LSTMs are ideal
Evaluating the Effectiveness of Machine Learning Algorithms in Stock Price Prediction 37
for tasks involving sequential data, such as stock price predictions, because they can retain and use information over long time intervals (van Houdt et al., 2020). A LSTM consists of the Forget Gate (ft) which determines what information from the previous cell state (Ct-1) should be discarded. This is calculated using a sigmoid function, outputting values between 0 (forget) and 1 (keep). It also includes an input Gate (it) which decides what new information to add to the cell state. It works with the candidate cell state (Ct), which represents potential updates. This is followed by a Cell State Update (Ct): Combines the forget and input gates to update the cell state (Hochreiter & Schmidhuber, 1997):
Finally, the Output Gate (ot) Controls what information from the cell state is passed to the next step as the hidden state (ht) that serves as the output of the current cell.
The cell state acts as memory, helping the model retain relevant trends over long periods while the forget gate ensures that only valuable historical information is used, avoiding unnecessary noise. LSTM’s design makes it inherently suited for time-series tasks like stock price prediction, where data order matters.
Finally, Artificial Neural Networks (ANN) are computational models inspired by the structure of the human brain. They excel at learning patterns and relationships from data, making them useful for stock price prediction by identifying complex interactions between features (Tian et al., 2021). The input layer receives features, such as historical stock prices or technical indicators, and passes them to interconnected hidden layers. These hidden layers use weighted transformations and nonlinear activation functions, like ReLU or sigmoid, to detect complex, nonlinear patterns within the data. Finally, the output layer produces the prediction, such as a forecasted stock price, based on the learned patterns.
To evaluate the performance of the above algorithms for predicting stock closing prices, we utilized Python’s scikit-learn library to implement, train, and test our models. The workflow involved data preprocessing, model training, and performance evaluation using selected metrics, ensuring a robust and systematic approach. We used the yahoofinance library to populate our dataset with historical stock prices of DBS UOB and OCBC, which were cleaned and prepared for analysis. Missing values were handled by manually inputting the values from other historical stock prices databases where necessary. Each model was initialized with default hyperparameters. Once trained, the predictions generated by each model were compared against the actual stock prices using the following evaluation metrics: Based on the predicted closing price and the absolute closing price, we then calculated these metrics, Percentage Error, R-squared (R2), Mean Absolute Error (MAE), and Mean Squared Error (MSE). These metrics were chosen to provide insights into the accuracy, reliability, and explanatory power of the models.
Percentage error measures the absolute deviation of the predicted price from the actual price as a percentage. A lower percentage error signifies better prediction accuracy. R2 quantifies the proportion of variance in the actual stock price explained by the model. R2 values closer to 1 suggest a stronger explanatory power, indicating the model’s ability to account for variations in the stock prices.
2
P
MAE measures the average absolute differences between predicted and actual values. Smaller MAE values indicate a higher level of prediction accuracy by minimizing overall errors.
MSE evaluates the average squared differences between predicted and actual values. MSE squares the residuals, giving disproportionately higher weights to larger errors.
RESULTS
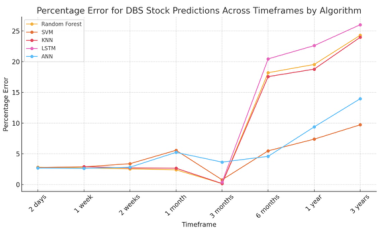
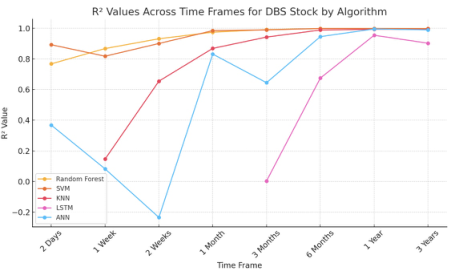
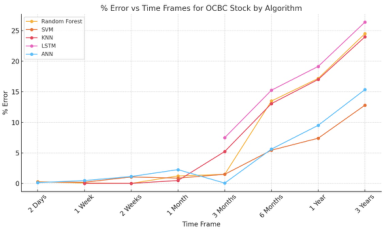
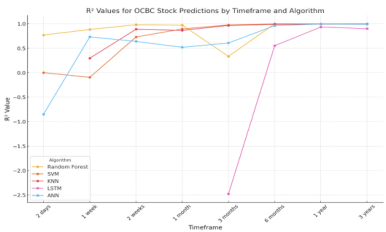
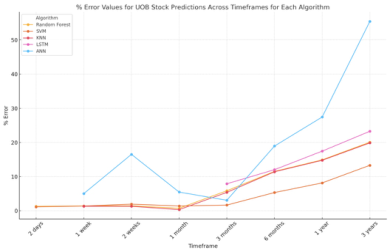
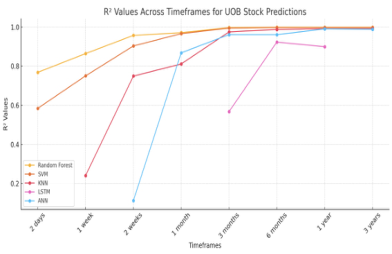
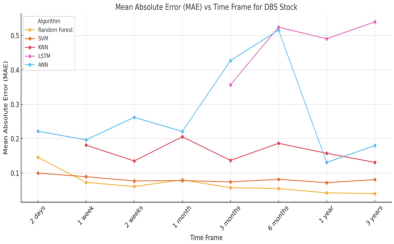
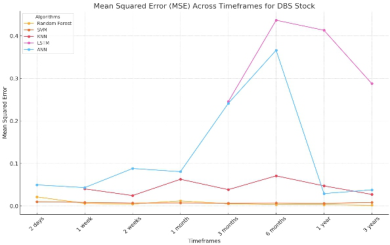
The results of our analyses are depicted in the figures below.
Figure 1: Percentage error for DBS stock predictions.Figure 2: R2 values for DBS stock.
Evaluating the Effectiveness of Machine Learning Algorithms in Stock Price Prediction 39
Figure 3: Percentage error for OCBC stock predictions.Figure 4: R2 values for OCBC stock.Figure 5: Percentage error for UOB stock predictions.Figure 6: R2 values for UOB stock.
As can be seen, RF consistently shows high R2 values and low percentage errors across all three stocks in short-term predictions, emphasizing its strength in capturing immediate trends. As the timeframe increases, its percentage error generally increases while R2 value remains relatively constant. Despite maintaining relatively constant R2 values in mid-term and long-term predictions, its percentage errors increase significantly. This suggests that RF may overfit to training data, making it less adaptive to the volatility and unpredictability of long-term financial data. Hence, RF is highly effective for short-term forecasting but less reliable for long-term predictions due to its deterministic nature and sensitivity to overfitting.
SVR shows a consistent trend of having the lowest percentage errors amongst all other algorithms, with a general increasing trend with increasing time frame. It also maintains high R2 values across all stocks, but tends to have a slightly lower R2 value for short-term predictions as compared to mid- term and long-term predictions. This may suggest that it prioritizes accuracy over generalizability in this timeframe, restricting its adaptability in highly volatile markets.
KNN generally maintains low percentage errors for short-term predictions, but has a significant increase in error for long-term predictions. Additionally, its R2 value for short-term predictions is significantly lower than that for mid-term and long-term predictions, indicating that it struggles to capture the overall variability in stock price trends in the short term. However, for longer time frames, the R2 values improve significantly, indicating its ability to generalize better with larger datasets and longer trends, but comes at the cost of increasing percentage errors, particularly for long-term predictions. This suggests that its reliance on proximity-based relationships becomes less effective in highly dynamic and volatile environments.
LSTM was unable to capture trends for shorter time frames, performing poorly when given data for less than one month. For longer time frames, it consistently showed high percentage errors and low R2 values. This suggests its limited capability to handle the volatility and non-linear relationships inherent in stock price data over extended periods.
ANN had a general increasing trend of percentage errors with increasing time frames, with a few notable anomalies. Its R2 value was the lowest amongst all the algorithms for short-term predictions, but significantly improved for mid-term and long-term predictions. This shows that it struggles to capture meaningful variability in small datasets, but is able to generalize trends over time, albeit at the cost of accuracy. ANN is adaptable for mid-term and long-term predictions but requires extensive optimization of hyperparameters and datasets to enhance its accuracy and minimize errors.
Random Forest and SVR consistently outperform other models, demonstrating low error rates and stable results across short- to long-term predictions. For example, Random Forest achieves an MAE of 0.1464 and MSE of 0.0216 for DBS stock over 2 days and maintains strong performance even over 3 years. SVR shows similarly effective performance, only being slightly worse than Random Forest in longer time horizons.
Evaluating the Effectiveness of Machine Learning Algorithms in Stock Price Prediction 41
Figure 7: Mean absolute error for DBS stock.Figure 8: Mean squared error for DBS stock.
In contrast, ANN and LSTM are less reliable, with error rates increasing significantly in long-term predictions. LSTM, while theoretically strong for time-series data, struggles to outperform other models consistently. It performs poorly in both medium and long-term predictions, with high error rates. These results suggest that LSTM’s requirement for large datasets and careful tuning limits its practical applicability in this context. KNN performs inconsistently, with its error rates rising noticeably in the long term. Overall, Random Forest and SVR are the most effective, while ANN and LSTM require improvements in tuning and data handling for better long-term accuracy.
CONCLUSION
In conclusion, this project highlights the performance of various machine learning algorithms in predicting stock price trends within Singapore’s banking sector over different time frames. Among the models analysed, Random Forest (RF) and Support Vector Regression (SVR) consistently performed remarkably across both short and long-term horizons, with RF excelling in short-term predictions and SVR maintaining high accuracy and adaptability over longer timeframes. While K-Nearest Neighbors (KNN) shows potential in mid to long-term predictions, its reliability diminishes in volatile market conditions. On the other hand, Artificial Neural
Networks (ANN) and Long Short-Term Memory (LSTM) models, although theoretically well-suited for time-series data, struggle with higher error rates and lower R2 values, particularly for long-term predictions. These results underline the importance of balancing algorithm choice with the specific demands of prediction timeframes and data variability.
REFERENCES
Chang, C.-C. and Lin, C.-J., “LIBSVM: A Library for Support Vector Machines,”
2001. Available: https://www.csie.ntu.edu.tw/∼cjlin/papers/libsvm.pdf. Cunningham, P. and Delany, S. J., “k-Nearest Neighbour Classifiers - A Tutorial,” ACM Computing Surveys, vol. 54, no. 6, pp. 1–25, Jul. 2021, doi: https://doi.org/ 10.1145/3459665. Donges, N., “Random Forest: A Complete Guide for Machine Learning,” Built in,
Jul. 22, 2021. https://builtin.com/data-science/random-forest-algorithm Hochreiter, S. and Schmidhuber, J., “Long Short-Term Memory,” Neural Computation, vol. 9, no. 1, pp. 1–42, Jan. 1997, doi: https://doi.org/10.1162/ neco.1997.9.1.1. Platt, J. C., “Probabilistic Outputs for Support Vector Machines and Comparisons to Regularized Likelihood Methods,” vol. 10, no. 3, Jun. 2000. Simplilearn, “Random Forest Algorithm,” Simplilearn.com, Nov. 07, 2023. https://www.simplilearn.com/tutorials/machine-learning-tutorial/ random-forest-algorithm Tian, Y., Shu, M., and Jia, Q., “Artificial Neural Network,” Encyclopedia of
Mathematical Geosciences, pp. 1–4, 2021, doi: https://doi.org/10.1007/978-3- 030-26050-7_44-1. van Houdt, G., Mosquera, C., and Nápoles, G., “A review on the long shortterm memory model,” Artificial Intelligence Review, vol. 53, no. 8, May 2020, doi: https://doi.org/10.1007/s10462-020-09838-1.
LISTED IN THE AHFE DIGITAL BOOKSTORE CATALOGUE
Explore the complete digital volume
Human Interaction and Emerging Technologies (IHIET-FS 2025): Future Systems and Artificial Intelligence Applications
Read this individual research paper free through the original publisher, or explore the full digital proceedings book.
ISBN 978-1-964867-72-4
Explore this ISBN in the AHFE Bookstore ↗Listed in the July 2026 bookstore catalogue; search by ISBN to confirm current availability · Digital book purchase optional