Thimo Florian Schindler, Tammo Francksen, Jan-Hendrik Ohlendorf (2025). Effects of uncertain knowledge in water level prediction using an LSTM Neural Network. In: Human Interaction and Emerging Technologies (IHIET-AI 2025): Artificial Intelligence and Future Applications. AHFE Open Access, vol. 161. https://doi.org/10.54941/ahfe1005922
This article endeavours to demonstrate how uncertainty in the knowledge base and input data of artificial neural networks affects the accuracy of their predictions. In this paper, we introduce a new approach dealing with the omnipresent prediction error of machine learning methods. Our approach consists of specifically identifying and decreasing uncertainty in various scenarios in the knowledge base and database to increase the accuracy of the model forecasts. The data manipulation experiments in this paper prove that uncertainty in the model forecasts can be measured by observing the change in the prediction error. The use case is a water level prediction model for a closed harbour basin based on a Long short-term memory neural network. Our model, developed using standardised AI modules, predicts future water levels based on historical data and thus optimises energy efficiency and logistical processes for a tide-independent industrial port. Various scenarios for the origin of uncertainties in the datasets are simulated through the targeted manipulation of the historical dataset. We were able to show the significant impact of uncertainty on accuracy, which supports the idea of dealing with uncertainty to enhance artificial neural networks in logistic processes.
Machine learning methods are already frequently used in many fields of application, such as image processing for object recognition, autonomous driving or the prediction of power load peaks in energy supply (LeCun et al., 2015). A large amount of data is necessary to approximate the underlying process through machine learning methods. Another important factor besides the quantity is the data quality, which significantly influences the model accuracy (The et al., 2020).
The new approach presented in this article is to put uncertain knowledge of artificial neural networks (ANN) into perspective. Therefore a new theory is established here. It is assumed in this article that a perfect knowledge-based system with complete and specific knowledge about the surroundings can
make accurate predictions. The prediction error of such a hypothetical system would be zero. This assumption is based on the theory of a deterministic universe (Rummens and Cuypers, 2009). The prediction error of today’s existing knowledge-based systems is never zero. There is always some deviation. If the previous assumption is reversed, it can be concluded that today’s knowledge-based systems have neither a complete nor specific knowledge base, which is why they show prediction errors. Furthermore, by following this logic, the extent of uncertain knowledge in the knowledge base of an ANN can be measured based on the shown prediction error. The higher the error, the more uncertainty there may be in the knowledge base. To examine this theory, experiments were conducted in which uncertainty was simulated in labeled data of a port water level forecast model. Uncertain labels represent one way in which uncertain knowledge may be introduced into the knowledge base of an ANN.
This paper aims to demonstrate the impact of uncertainty on the accuracy of artificial neural networks. The basis for the experiments is a model based on machine learning for predicting water levels in a closed harbour basin in northern Germany. The model is constructed as a recurrent neural network in form of a Long short-term memory (LSTM) and, as such, shows promise in the prediction of time series-based water level forecasts. This type of neural network architecture has proven to be predestined for predicting time series-based datasets (Elsworth and Uettel, 2020). The underlying use case for the predictions is the early estimation of the necessity for irrigation of the port facility via cost and time intensive pumps for the sustainable and economically more advantageous use via the harbour lock.
RELATED WORKS Many studies and research in the application and use of machine learning methods deal intensively with the challenges of data preprocessing by filtering and reconstruct the data provided to the model in advance and preparing them that they are available to the model as ideally as possible (Miranda et al., 2012; Kotsiantis et al., 2006; Nabati et al., 2022).
However, the research has also shown that many of these works need to more sufficiently consider the possible effects of uncertain knowledge in process modelling. In particular, established procedures are used, for example, for outlier identification, but any threshold values are selected in a way that possible process-relevant features are removed during filtering. The paper presented here aims to show to what extent different scenarios in the underlying database affect the quality of model predictions when modelling with machine learning methods.
Kotsiantis et al. (2006) describe that the priority for a successful application of machine learning is the representation and quality of the data. Furthermore, they describe potential procedures such as data cleaning, normalisation and others for the necessary preprocessing of the data provided to the model (Kotsiantis et al., 2006). The impacts of inadequate preprocessing of the data or uncertain knowledge already during data collection are not investigated.
Effects of Uncertain Knowledge in Water Level Prediction Using an LSTM Neural Network 303
In their work, Baumann et al. (2018) show which methods can be used to identify, categorise and appropriately treat prediction-biased outliers in flight operations data. The advantages and disadvantages of each method are described and discussed concerning operational flight data (Baumann, 2018). Any non-system dynamic parameter variations are mentioned as the cause for statistically remarkable data points. Furthermore, they show that model accuracy can be improved by identifying and correctly handling outliers.
This paper uses a systematic approach to investigate the effects of uncertain knowledge and the associated uncertain or fuzzy database on prediction accuracy in the modelling of an artificial recurrent neural network.
METHODOLOGY OVERVIEW The experiments and results on the effects of uncertain knowledge presented in this paper are based on a machine learning model that predicts water levels of a locked industrial port.
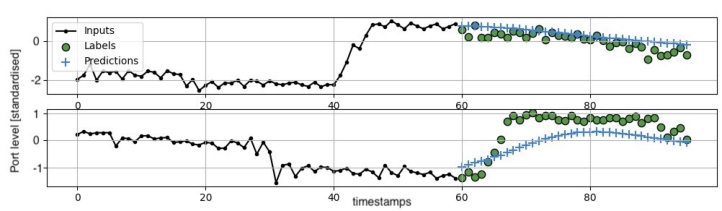
Therefore the model utilises real-time data from four different data features. This data is collected continuously and is made available to the model. For prediction, the model utilises data that was collected over the preceding ten hours. Out of that, the port water level forecast predicts the water levels of the harbour basin for the following six hours. Figure 1 shows two examples of such predictions. For simplicity, the time is shown in minutes times ten in the plot on the abscissa. The first ten hours, or 600 minutes shown, are measured port water level data of the past ten hours before the prediction. The following six hours, or 360 minutes shown are the predicted water levels for each ten-minute timestamp. A cross presents each predicted water level value. These predictions are based on historical test data without knowledge of information from the future. These are represented as circles in Figure 1. The cross and circle differences represent the prediction error of the port water level forecast.
Figure 1: Prediction examples of the implemented LSTM-neural network.
As can be seen in the graphic, the first prediction is entirely accurate. The second one depicts a different expectation of the port water level forecast of what occurs. The machine learning model underestimates the speed at which the port water level rises. Such a substantial increase in the water level occurs when the gates of the waterway locks are opened to refill the harbour basin.
While the model did not expect the opening of the waterway locks, it still predicts an upcoming increase in the water level. Therefore, the prediction is partially correct but more inaccurate than the first one, leading to a higher prediction error.
As Figure 1 depicts, the port water level forecast gets input and outputs data as ten-minute timestamps. So the model gets 60 input values (six values per hour times 10 hours) of each feature for a prediction. It generates 36 output values (six values per hour times six hours) out of this input. The port water level forecast receives 240 single dates (60 of each feature). The continuously collected data has a much higher resolution. The multiple values are interpolated to one single value for each ten minute timestamp.
The port water level forecast processes historical data only. Four features were selected as inputs, which have an major impact on the development of the port water level:
Weser (river on which the port is located) water level
Port water level
Lock activity (Is a harbour locking taking place? yes/no)
Pumps on/off Weser- and port water levels represent the height of the water level to the gauge points of the Weser and the harbour basin. This data is available in meter at chart zero. In contrast, data about lock gates and pumps are binary. Pumps are either active (= 1) or inactive (= 0). Analogously this applies to the lock gates. They pass ships (= 1) or not (= 0) through the lock.
While also tested with different types of neural networks, a Long Short-Term Memory neural network was chosen for the port water level forecast. LSTMs are a particular type of recurrent neural network (RNN). Additionally to the usage of feedback loops, an LSTM utilises an LSTM cell which enables the RNN to remember important scenes and also forget unimportant information. Among others, the Keras minimalistic modular open-source library was used to implement, train and test the forecasting model. The LSTM of the port water level forecast consists of 16 layers.
A dataset collected between 2020 and 2021 was used to train the neural network. As mentioned above, interpolation into ten-minute timestamps is performed as part of data preprocessing. The preprocessed dataset consists of 36,275 timestamps, equivalent to 251.9 days of collected data. This dataset is divided into 70% training data, which is equal to 25,393 timestamps or 176.3 days, 20% validation data, which is similar to 7,255 timestamps or 50.4 days and 10% test data, which is equivalent to 3,627 timestamps or 25.2 days.
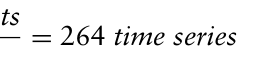
The port water level forecast needs 96 timestamps to create a training prediction. Sixty of them serve as input data, while 36 serve as label data. The deviation between the label and prediction is the prediction error which is used for backpropagation during training. While 96 timestamps are used for a single training prediction, these timestamps can serve for multiple training predictions because of time series-based training. Along the timeline, as a window function, the training algorithm moves one timestamps forward after each training period. One timestamp can be part of 96 time series, and
Effects of Uncertain Knowledge in Water Level Prediction Using an LSTM Neural Network 305
therefore 96 training predictions. Only the first and last 96 timestamps of the dataset are part of fewer than 96 time series. With this, it is possible to train
Equation reproduced from the original PDF.
25, 393 data points −
96data points time series −1
That means the LSTM model of the port water level forecast makes 25,298 six-hour long training predictions in one epoch. There are 36 prediction errors for each training prediction which means that 25, 393 data points
Equation reproduced from the original PDF.
96 data points time series
are calculated and backpropagated in each epoch.
Additionally to the interpolation, the input data values are mathematically standardised. Due to the standardisation, the arithmetic mean of the data becomes zero, and the variance becomes one. The standardisation is carried out because of the input features different value ranges and scales. After standardisation, the value range of the input data is the same for all features. The features value range also becomes small, making training and prediction more stable (Zheng et al., 2019; Shi, 2000). To standardise the arithmetic mean (µ) and the standard deviation (σ) of the training dataset is required. The standardisation follows the following equation for each value: 25, 298 predictions × 36prediction errors prediction = 910, 728 prediction errors
The training data as well as the validation and test data are standardised using the arithmetic mean and the standard deviation of the training data. To obtain interpretable output data, the standardisation has to be redone for the predicted port water level values. Therefore the equation is reversed: datai −µtraining data
= datai, standardised Straining data
The values in Table 1 (Appendix), which contains the results of the carried- out experiments, are presented in a standardised form. The mean squared error (MSE) and mean absolute error (MAE) given in this table are calculated out of standardised values, which makes them uninterpretable in this form. Therefore, the MAE standardisation is redone, leading to the interpretable value given in meters in the last column of the table.
The validation loss of the last training period is used to measure the accuracy of the port water level forecast. This allows an evaluation of the accuracy based on a statistical performance indicator. Because of that, the experiments are carried out without real-time data. The advantage of using a historical dataset is the possibility of getting more predictions for each experiment. Since there is only a prediction every ten minutes (using real-time data), getting a significant number of forecasts for an experiment
would be much more time consuming. As described above, more than 7,000 predictions can be made during the validation period, providing statistical significance. It is crucial for the experiments that the model is tested with data that was not part of the training. By definition the validation and the subsequent implementation of the dataset fulfils this requirement.
The standardised validation loss of the port water level forecast is usually around 0.57 and 0.61. This is the last training periods mean squared error. The MSE is a statistical performance indicator that compares different models but is not interpretable. Therefore the mean absolute error is used. The MAE of the forecast model is usually around 0.43 and 0.46. This MAE is a standardised mathematical value, and the standardisation can be reversed. The restandardised value of the validation loss is then interpretable, around 3.3 and 3.6 cm. All prediction error values of every single prediction of the last training epoch are included in this mean value.
EXPERIMENTS OF DATA MANIPULATION For each experiment the following steps must be performed:
Manipulation of label data following the predetermined experimental plan,
generate and train LSTM model with training dataset and
examine the validation loss of the last epoch In this particular test series, different influencing factors of uncertainty on the label data of the forecast model are observed. Since the label data are crucial for the computation of prediction errors during the training period and are therefore decisive for the backpropagation, we assume that uncertainty in the data has a particularly negative impact on the accuracy of the trained model. Using incorrectly labelled data, the model is taught a negative expected outcome, resulting in inaccurate predictions. This will be further discussed in the following sections.
The label of this model is the port water level, and the port water level is also one of the input features. By manipulating the dataset used for training, it is impossible to change the labels without simultaneously altering the input feature since it is the same data that serves as input and label. The results would be different when tested with correct feature data while labels are solely manipulated. Different kinds of uncertainty can be simulated in label data. For this test series, three are chosen:
Unreliable data,
inconsistent data and
incomplete data.
The test series is divided into six subseries. The first four subseries (1.1 to 1.4) are about constant offsets added to the values. Different portions of the total label data are manipulated. This simulates unreliable data as well as inconsistent data for the partially manipulated subseries. Subseries number 2 examines the impact of random offsets. As well as the first subseries this simulates unreliability but, most important, inconsistency. The last subseries,
Effects of Uncertain Knowledge in Water Level Prediction Using an LSTM Neural Network 307
number 3, is about gaps in the label data. This one simulates incompleteness. All the subseries including their results, are displayed in Table 1 (appendix).
RESULTS
Table 1 (Appendix) shows all the test series results. As described before, a total of six subseries of experiments were done. The first column gives the experiment number, the second column describes the manipulation of the label data, and the last three columns show the results of the previous training epoch. Three different performance indicators are resulting. First, there is the mean squared error. This value is usually between 0.57 and 0.61 for the port water level forecast. Next is the mean absolute error, which is generally between 0.43 and 0.46. The MSE and MAE are mathematically standardised values which are therefore not interpretable. And lastly, there is the interpretable value of the validation loss for which the standardisation was redone, which is usually between 3.3 and 3.6 cm. This value describes the absolute average difference between the predicted water level of the harbour basin and the actual measured water level. This indicates the accuracy of the generated forecast model.
All the test subseries, except the tests with simulated gaps, show that uncertainty in label data impacts the accuracy of the port water level forecast LSTM model. The most significant impacts are observable when all the used label data is manipulated and therefore uncertain (compare series 1.1 and 2). Even the lowest offsets of −0.2 m and +0.2 m (experiment 1.1.7 and 1.1.8) lead to an increase in the validation loss and, for that, lower the accuracy of the model. Also, the lowest range of random offsets of −0.1 to +0.1 m (experiment 2.8) leads to an increase in the validation loss. But it is observable that random offsets on the label data are less impactful than constant offsets. The highest range of customarily distributed random offsets tested (−2 to +2 m in experiment 2.1) leads to a validation loss of only 0.376 m. Which is unexpectedly low compared to a validation loss of 0.52 m and 0.57 m for constant offsets of −2 m and +2 m (experiments 1.1.1 and 1.1.14). In the subseries 1.2 to 1.4, the impacts of a partially manipulated label database were tested instead of an entirely manipulated database. The results show a lower increase in the validation loss compared to the test series 1.1 and 2. Still, the increase of the validation loss and, vise versa, the decrease of the accuracy is explicit. All the tests from series 1.1 to series 2 show that the set offset height is crucial for increasing the validation loss. Lower offsets lead to smaller increases in the validation loss. Test series 3 shows that gaps in the label database have no recognisable impacts on the results. The MSE and MAE are smaller when offsets and fluctuations are more extensive. At the same time, the absolute validation loss in meters is higher. The reason for this is standardisation. The bigger the offsets and fluctuations, the more significant become the standard deviation of the label data. For standardisation, the values are divided by the standard deviation and become smaller when the standard deviation is higher. Smaller input values result in more minor differences between predicted values and labels, which lead to a lower MSE and MAE. The smaller MAE is multiplied by the high
standard deviation to redo the standardisation. The interpretable values are then higher, as to be expected. The accuracy of the port water level forecast has decreased even though the MSE and MAE are lower than before.
CONCLUSION
The experiments prove the assumption that uncertain label data affects the prediction error and, therefore, the models accuracy negatively. There were three kinds of uncertainty tested. These are falsified (and therefore unreliable) data, inconsistent, and incomplete data. One discovery from the results is that consistent offsets significantly impact the accuracy of the port water level forecast more than random (inconsistent) offsets. It is concluded from this that the model is more likely to learn a wrong pattern, which leads to consistently wrong predictions during in its later work. Randomized offsets cannot lead to incorrect model training since there is no recognizable pattern. Nevertheless, inconsistency has a measurable impact on the prediction error. This is represented in the results of test series 2. The test series 1.2 to 1.4 also represent inconsistency because the constant offsets are partially applied only. Comparing test series 1.1 to the following subseries, it is observable that the impact on the validation loss gets smaller if the proportion of falsified data decreases.
Gaps in the label data that represent incompleteness have almost no observable impact on the accuracy of the port water level forecast model. Even reducing the total data (experiment 3.5) by deleting 4 hours of data every 8 hours in the collected raw data does not significantly increase the prediction error. There might be two reasons for this. First, removing single values from the raw data (available in two-minute timestamps) has no significant effect since these multiple values from ten minutes get interpolated into one. The only difference is that a ten-minute timestamp value is calculated out of four instead of five single values. The resulting ten-minute timestamp values only differ slightly in decimal places. Another effect could be that the reduced training dataset is still more extensive than needed to properly train the LSTM model. This contradicts the common assumption that more training data usually leads to better trained models or that ANN struggle with small amounts of training data (Doebel et al., 2018; Maheswari, 2019). The port water level forecast training dataset still seems sufficient, even if it is reduced or full of gaps. What is concluded from this is that falsified and inconsistent label data leads to more uncertainty in the knowledge base of the model than incompleteness. Because of that, the focus should be on reducing false data and inconsistency rather than collecting more data or caring a lot about gaps in the database. The results back up the proposed approach to intentionally target uncertain knowledge if higher accuracies are desired.
Effects of Uncertain Knowledge in Water Level Prediction Using an LSTM Neural Network 309
ACKNOWLEDGMENT
The authors would like to thank their project partners and the anonymous reviewers for their valuable input. This research has been funded by the Federal Ministry for Digital and Transport of Germany (BMDV) in the “Innovative Port Technologies” (IHATEC II) program as part of the projects Port2Connect (19H22008) and Tide2Use (19H18004).
REFERENCES
Baumann. (2018). Identifikation und Behandlung von Ausreißern in Flugbetriebsdaten für Machine Learning Modelle. Deutsche Gesellschaft für Luft- und Raumfahrt - Lilienthal-Oberth e. V. Elsworth, S., & Üttel, S. (2020, March). Time Series Forecasting Using LSTM Networks: A Symbolic Approach. Döbel, I., Leis, M., Vogelsang, M. M., Neustroev, D., Petzka, H., Riemer, A.,
Rüping, S., Voss, A., Wegele, M., & Welz, J. (2018). Maschinelles Lernen: Eine Analyse zu Kompetenzen, Forschung und Anwendung. Fraunhofer-Gesellschaft. Kotsiantis, S., Kanellopoulos, D., & Pintelas, P. (2006). Data Preprocessing for Supervised Learning. International Journal of Computer Science, 1, 111–117. LeCun, Y., Bengio, Y., & Hinton, G. (2015). Deep learning. Nature, 521(7553),
Reconstructing Missing Data in State Estimation With Autoencoders. IEEE Transactions on Power Systems, 27(2), 604–611. https://doi.org/10.1109/tpwrs. 2011.2174810 Nabati, E. G., Nieto, M. T. A., Bode, D., Schindler, T. F., Decker, A., & Thoben, K.-D.
(2022). Challenges of manufacturing for energy efficiency: towards a systematic approach through applications of machine learning. Production, 32. https://doi. org/10.1590/0103-6513.20210147 Shi, J. J. (2000). Reducing Prediction Error by Transforming Input Data for Neural Networks. Journal of Computing in Civil Engineering, 14(2), 109–116. https://doi.org/10.1061/(ASCE)0887-3801(2000)14:2(109) Rummens, S., & Cuypers, S. E. (2009). Determinism and the Paradox of Predictability. Erkenntnis, 72(2), 233–249. https://doi.org/10.1007/s10670-009- 9199-1 Teh, H. Y., Kempa-Liehr, A. W., & Wang, K. I.-K. (2020). Sensor data quality: A
systematic review. Journal of Big Data, 7(1). https://doi.org/10.1186/s40537-020- 0285-1 Zheng, A., Alice AND Casari. (2019). Merkmalskonstruktion für Machine Learning
- Prinzipien und Techniken der Datenaufbereitung. O’Reilly.
APPENDIX
Table 1. Experimental results.
Table available in the original PDF paper.
Experiment Number Port Water Level Manipulation [m]
Effects of Uncertain Knowledge in Water Level Prediction Using an LSTM Neural Network 311
Table 1. Continued Experiment Number Port Water Level Manipulation [m]
Table available in the original PDF paper.
MSE MAE Validation Loss [m] random offsets all label data 2.1 −2 to +2 0.5293 0.3466 0.376 2.2 −1.5 to +1.5 0.5255 0.3383 0.276 2.3 −1.0 to +1.0 0.5319 0.3657 0.200 2.4 −0.8 to +0.8 0.5349 0.3567 0.157 2.5 −0.6 to +0.6 0.5199 0.3657 0.123 2.6 −0.4 to +0.4 0.5371 0.3824 0.088 2.7 −0.2 to +0.2 0.5457 0.3954 0.052 2.8 −0.1 to +0.1 0.5648 0.4229 0.039 gaps in label data 3.1 every 10th value 0.5810 0.4305 0.033 3.2 every 2nd value 0.5921 0.4365 0.034 3.3 1 h gap every 8 h 0.5794 0.4372 0.034 3.4 2 h gap every 8 h 0.5809 0.4315 0.033 3.5 4 h gap every 8 h 0.5891 0.4360 0.034
LISTED IN THE AHFE DIGITAL BOOKSTORE CATALOGUE
Explore the complete digital volume
Human Interaction and Emerging Technologies (IHIET-AI 2025): Artificial Intelligence and Future Applications
Read this individual research paper free through the original publisher, or explore the full digital proceedings book.
ISBN 978-1-964867-37-3
Explore this ISBN in the AHFE Bookstore ↗Listed in the July 2026 bookstore catalogue; search by ISBN to confirm current availability · Digital book purchase optional