Guoqiang sun (2024). Analysis of the influence of HUD brightness adjustment on pilots' information perception. In: Advances in Human Factors of Transportation. AHFE Open Access, vol. 148, pp. 128–138. https://doi.org/10.54941/ahfe1005203
In order to study the visual effects of the external visual environment and HUD character brightness design on HUD information recognition, a 2×2 within-subject experimental design with two factors of character display brightness and environmental illumination was used, and the subjects were required to operate under experimental conditions. Complete the complete flight simulation process. The experiment collected subjects' performance data, SART scale data and physiological data. The experimental results show that the brightness factor is significant for the accuracy rate, and the environmental illumination factor is significant for the reaction time; among them, the environmental illumination factor is significant for the heart rate variability index SDNN, CV, and is borderline significant for the breathing index.
In the day/night operating environment, the brightness of the HUD is kept within the appropriate range to help the pilot accurately and quickly iden- tify the flight information, so that the pilot has a good level of situational awareness at the information receiving port. Therefore, how to optimize the information display of HUD in different use environments has become one of the key issues in the development and application of HUD in combination with the pilot’s situational awareness evaluation.
There has been a lot of research into the brightness design of the HUD. Thomas et al. designed computer simulation model experiments for hel- met displays (HMDs) to evaluate the brightness requirements of symbols, and after testing white symbols relative to static backgrounds, they came up with a minimum contrast requirement relative to the background (Harding et al., 2016). Amandeep et al. studied a new HUD bilateral electronic raster scanning technique, which increased the longitudinal lookback period from 1.2800 ms to 5.8304 ms compared to the traditional unilateral scanning tech- nique (Moddal et al., 2016). Vinod et al. investigated that the difference in visual synthesis of the display area caused by the inconsistent brightness of the HUD can cause pilots to inappropriately allocate attention to the information and exterior of the HUD interface, and their results proved that the bright- ness of the HUD image, the brightness of the surrounding environment, and
Analysis of the Influence of HUD Brightness Adjustment on Pilots’ Information Perception 129
their interaction will have a considerable impact on the HUD interface infor- mation and the perception of the exterior (Karar & Ghosh, 2014). Jianying et al. have shown that the character brightness of the HUD is the key factor that determines the performance of the HUD, and the appropriate character brightness ensures that the pilot can recognize the information comfortably and clearly (Xiejianying et al., 2014). Yongtian of Beijing University of Tech- nology designed a HUD with an irregular perspective that can shorten the development cycle (Peng et al., 2014). Chunliang et al. conducted a corre- sponding study on the brightness of HUD characters, and the results showed that the characters on the HUD should meet the requirements of “clear and legible”. A clearly discernible quantitative criterion is contrast, not bright- ness. A contrast ratio of 0.2 to 0.5 meets the standard, i.e., the characters in the HUD are legible when the contrast ratio is 1.2:1. When the contrast ratio reaches 1.5:1, it is possible to read characters more comfortably and quickly (Lichunlaing, 1997). Zhiwei developed a HUD information color matching performance evaluation simulation system for the visual impact of external environmental color on HUD display information during dynamic flight, which achieved no jitter, no distortion, and no obvious visual delay in image quality (Wangzhiwei et al., 2017).
Based on the previous research, combined with the manual flight simu- lation, and based on the situational awareness theory (Fengchuanyan et al., 2020), the influence of character brightness and environmental illuminance is analyzed, so as to provide new theoretical basis and experimental data for the optical design of HUD interface.
EXPERIMENTAL PROGRAM Experimental Methods
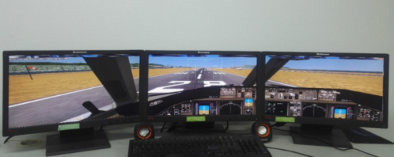
Flight Gear 3.4.0 software was used to simulate the flight simulation task and HUD interface. The study takes the cockpit of Boeing 777-200ER airplane as a prototype, and based on this, we design and simplify the HUD interface reasonably by ourselves, and the experimental interface is shown in Fig. 1, and the picture quality of the simulation interface is free of jitter, distortion, and obvious visual delays, so as to be able to satisfy the research requirements.
Figure 1: Experimental simulation interface.
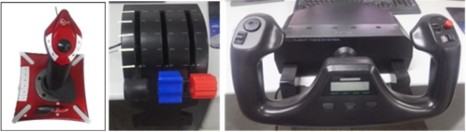
Subjects controlled the flight by operating the joystick system to simulate a real flight situation for pilots, as shown in Figure 2. The keyboard and mouse were used during the experiment for the subjects to answer questions.
Figure 2: Flight joystick.
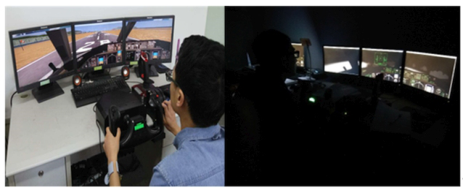
Experimental Design The 2×2 two-factor within-subjects design used in this experiment was designed to investigate the effect of the brightness of the HUD character information display on subjects’ situational awareness under different light- ing environments. Specifically, two factors were included: character display brightness and ambient illuminance. Among them, the ambient illumination was set at two illumination levels: daytime (1600 Lx) and nighttime (0.05 Lx), and the brightness of HUD characters under each illumination level was divided into two levels: high brightness and low brightness.
By gradually adjusting and fine-tuning within the appropriate range, the brightness parameters suitable for HUD characters were selected for the experiment. The contrast between the measured characters and the HUD interface display brightness (character brightness) is shown in Table 1. The daytime and nighttime experimental scenarios are shown in Figure 3.
Experimental Tasks The experimental task was a manual flight simulation experiment, and the flight task was divided into five stages: takeoff, climb, cruise, turn and descent. The subjects operated manually to complete the whole flight pro- cess, and paid attention to the HUD interface information, i.e., the values of each instrument and the trend information.
Analysis of the Influence of HUD Brightness Adjustment on Pilots’ Information Perception 131
The experiment was conducted using the SAGAT method. During the experiment, the flight interface will be randomly frozen, and pop-up ques- tions related to the HUD information interface in the current flight state will be asked, and the subjects will select the answers with the mouse, and the system will record the correctness of the subjects’ answers and the response time as the objective performance evaluation indexes.
In the experiment, the subjects were required to answer 48 context- awareness questions.
In order to overcome the practice effect and the fatigue effect, the experi- mental order of the subjects was sorted by Latin square.
Subjects Fourteen graduate students (10 males and 4 females) enrolled in Beijing University of Aeronautics and Astronautics were selected as subjects. The subjects all had relevant aviation knowledge background, were between 22–25 years old, had corrected visual acuity of 1.0 and above, were right- handed, and were free of color blindness, color weakness and other diseases. They were informed and consented to the content of the experiment before the start of the experiment.
Experimental Indicators During the experiment, the correct rate and response time of the subjects answering the questions were recorded.
Simultaneously collect and record the respiratory, electrocardiographic, and electrocardiographic data of the subjects. Tongfang Shenhuo TH-P phys- iological tester was used to record the respiratory and electrocardiographic data of the subjects, and FX-7402 twelve-channel automatic analysis electro- cardiograph was used to synchronously record the electrocardiographic sig- nals. The respiratory indexes were selected from the respiratory mean value; the skin conductivity was selected from the electrocardiographic indexes; and the heart rate indexes mainly included: mean heart rate (Mean HR), standard deviation of the R-R interval (SDNN) and coefficient of variation (CV).
At the end of the experiment, the subjects completed the 10D-SART (Situation Awareness Rating Technique, SART) self-assessment scale.
RESULTS
Overall Flight Data Analysis As shown in Table 2, the statistical results of the SAGAT as well as the sub- jective evaluation data for both daytime and nighttime illumination, and for both high and low luminance conditions.
Between-subjects effect tests were conducted on the results of the different conditions. Analysis of the sample between-subjects effects test using SPSS showed that the brightness factor was significant for the indicator of correct- ness (P = 0.048) and the ambient illumination factor was significant for the indicator of response time (P = 0.010) at the 0.05 level of significance. The rest of the main and interaction effects were not significant (P > 0.05).
Table 2. Overall data descriptive statistics.
Table available in the original PDF paper.
Correct Rate Response time/ms SART
Display Brightness Ambient illumination Low Brightness Daytime 0.686±0.091 4963.349±1008.489 19.929±5.370 Night 0.690±0.106 4186.017±686.995 19.286±4.140 Total 0.688±0.097 4574.683±934.659 19.607±4.717 High Brightness Daytime 0.717±0.077 4860.619±1012.936 19.500±5.125 Night 0.756±0.079 4339.487±885.153 20.071±5.370 Total 0.737±0.079 4600.053±970.395 19.786±5.159 Total Daytime 0.702±0.084 4911.984±993.199 19.714±5.156 Night 0.723±0.098 4262.752±781.400 19.679±4.722
The statistical results showed that, in general, the value of correctness in the case of high luminance was greater than the value in the case of low luminance, and the value of response time in the nighttime illumi- nation environment was less than the value in the daytime illumination environment.
The correlation analysis of the experimental data showed that the cor- relation between the indicators was not significant (P>0.05) (Sunyimin, 2007).
Data Analysis for Each Flight Phase The statistical results of SAGAT as well as physiological measurements dur- ing the takeoff phase under different experimental conditions are shown in Table 3. SPSS was used to analyze the sample between-subjects effect test, and at the 0.05 level of significance, the main effect of the environmental illumination factor on the response time (P = 0.002) indicator was signifi- cant, while the main effect and interaction effect of the remaining indicators were not significant. The results of the correlation analysis showed that there was a significant positive correlation between the SDNN indicator and the CV indicator (r = 0.980, P<0.001). The correlation between the remaining indicators was not significant (P>0.05).
The statistical results of SAGAT as well as physiological measurements dur- ing the climbing phase under different experimental conditions are shown in Table 4. The results of the between-subjects effect test analysis showed that the main effect of the environmental illuminance factor was significant at the 0.05 level of significance for the indicator of response time (P = 0.026). The main and interaction effects for the other indicators were not significant (P>0.05). The results of correlation analysis showed that there was a signifi- cant positive correlation between the SDNN indicator and the CV indicator (r = 0.972, P<0.001). The correlation between the remaining indicators was not significant (P>0.05).
The statistical results of SAGAT as well as physiological indicators dur- ing the cruise phase under different experimental conditions are shown in Table 5. The results of the between-subjects effect test analysis showed that the main effect of the ambient illumination factor on the response time (P = 0.07) indicator was critically significant at the 0.05 level of significance,
Analysis of the Influence of HUD Brightness Adjustment on Pilots’ Information Perception 133
and the main and interaction effects of the remaining indicators were not sig- nificant (P>0.05). The results of correlation analysis showed that there was a significant positive correlation between the SDNN indicator and the CV indi- cator (r = 0.983, P<0.001). The correlation between the remaining indicators was not significant (P>0.05).
The statistical results of SAGAT as well as physiological indicators dur- ing the turning phase under different experimental conditions are shown in Table 6. The results of the between-subjects effect test analysis showed that the main effect of the environmental illumination factor was significant at the 0.05 level of significance for the response time (P = 0.012) indicator and the interaction effect was significant for the picoelectricity (P = 0.011) indi- cator. The main and interaction effects of the remaining indicators were not significant. The results of correlation analysis showed that there was a signif- icant positive correlation between the SDNN indicator and the CV indicator (r = 0.982, P<0.001). The correlation between the remaining indicators was not significant (P>0.05).
The statistical results of SAGAT as well as physiological indicators in the descending phase under different experimental conditions are shown in Table 7. The results of the between-subjects effect test analysis showed that the main effect of the environmental illuminance factor was signifi- cant at the 0.05 level of significance for the response time (P = 0.011), SDNN (P = 0.035), and CV (P = 0.05) indices, while the main and inter- action effects for the other indices were not significant. The results of correlation analysis showed that there was a significant positive correlation between the SDNN indicator and the CV indicator (r = 0.934, P<0.001). The correlation between the remaining indicators was not significant (P>0.05).
Table 3. Descriptive statistics of take-off phase data.
Table available in the original PDF paper.
Display Low Brightness High Brightness Total Brightness Daytime Night Total Daytime Night Total Daytime Night
Mean 50.06 40.29 45.18 50.19 42.21 46.20 50.13 41.25
The overall experimental data showed that the brightness factor was sig- nificant for SAGAT correctness and the ambient illuminance factor was significant for SAGAT response time; the overall analysis of the five phases of data had the same result; meanwhile, the ambient illuminance factor was significant for the heart rate variability indexes, SDNN, and CV, and was sig- nificant for the respiratory indexes, Critical, in the results of the five phases of data. The ambient illuminance factor was significant for reaction time in the analysis of different flight phases, which was consistent with the overall flight process results; however, the brightness factor was not significant for SAGAT correctness, probably due to the relatively small number of SA ques- tions assigned to each flight phase, which reflected some regularity but did not reach statistical significance.
Physiological metrics for each phase showed a consistent trend of higher nighttime than daytime and higher brightness than lower brightness for both respiratory and electrocardiographic metrics. HR did not reflect regularity in heart rate indicators, SDNN and CV indicators had a tendency to be
greater than at night in both daytime indicator values, and did not reflect a corresponding regularity in high and low brightness comparisons, although environmental illuminance reflected significance for SDNN and CV when the data from the five phases were analyzed together.
The correct rate and response duration of SAGAT can reflect the subject’s level of situational awareness, i.e., when the subject’s SA level is higher, he or she has a fuller and more accurate grasp of the current environmental information, and thus is more likely to answer the SA questions quickly and accurately. From the experimental results, the level of situational awareness of HUD characters with high brightness is higher than the level of situational awareness of characters with low brightness; the level of situational aware- ness in nighttime lighting conditions is higher than the level of situational awareness in daytime lighting environments.
In this experiment, the subjective evaluation results obtained from the SART scale did not show significant differences for different experimental conditions. The reason for this may be that the subjects’ understanding of some of the scale entries was insufficient, especially in the measurement of their own attentional resource availability, which reduced the measurement effect of the overall SART scale. In order to improve the accuracy of this index, the later experiments should consider adding detailed explanations about each scale entry, as well as increasing communication with the subjects, so as to help them better understand and judge.
In the results of this experiment, the respiration and electrocorticography indicators reflect a consistent trend of higher loads in the high light condition and the night light condition than in the low light and day light conditions; this result suggests that subjects are more aroused and have better levels of emotional arousal and alertness in the high light condition and the night time condition.The pattern of the SDNN and the CV indicators under the light condition reflects that the loads under the night time light condition are less, and that the heart rate The pattern of SDNN and CV indexes in the light envi- ronment reflects a lower load and flatter heart rate in the light environment at night, although it is possible that the experimental time of the nighttime illumination was in the “real night”, which may be influenced by biologi- cal rhythms (Mackie & Robert, 1977). The combined physiological results show that if the subjects are subjected to lower loads and have better arousal, emotional arousal and alertness, their level of situational awareness will be increased accordingly.
Domestic and international studies have concluded that the fundamental reason why the lighting environment and HUD character brightness have an effect on information interpretation performance is the contrast formed by the two, i.e., within a certain limit, the greater the contrast, the better the pilot’s performance. The results of the current experiment are consistent with this conclusion, the trends of the physiological indicators of skin electricity and respiration are consistent with the results, high contrast, arousal level arousal level is relatively better, the trend of SDNN and CV in the night vs. daytime comparison of the law is obvious, which shows that the contrast is high, the subject’s load is relatively smaller, however, this indicator in the high and low luminance of the comparison does not reflect the law, the probable
Analysis of the Influence of HUD Brightness Adjustment on Pilots’ Information Perception 137
reason for this is that the night vs. This may be due to the fact that the differ- ence between nighttime and daytime contrast is larger, and its trend is more easily reflected, while the smaller difference between high and low luminance contrast is not reflected.
CONCLUSION
The following conclusions were drawn from this experimental study:
1. For the HUD display conditions, the level of situational awareness of sub- jects in the nighttime illumination environment is higher than that in the daytime illumination environment; 2. The level of situational awareness of subjects in the high-brightness HUD character display condition was higher than that in the low-brightness HUD character display condition; 3. The correct rate index and reaction time index of the SAGAT method, and the respiration, electrocorticography, SDNN and CV indexes of the phys- iological measurement method have good sensitivity for judging the level of situational awareness. When using the subjective evaluation method based on the SART scale, the scale entries should be further interpreted in the context of the experimental design to improve the validity of the method.
REFERENCES
Amandeep Moddal, Vinod Karar, Divya Agrawal, et al. Bidirectional raster scanning to increase time for vector writing in avionics see-through displays[J]. Journal of the Society for Information Display, 2016, 24(7–9): 501–509. Feng Chuanyan, Wanyan Xiaoru, Liu Shuang, Chen Hao, Zhuang Damin. Study
on Situation Awareness under Different Mental Workloads[J]. Northwestern polytechnical university, 2020, 38(3): 9 (in chinese). Haichao Peng, Dewen Cheng, Jian Han, et al. Design and fabrication of a holographic head-up display with asymmetric field of view[J]. Applied Optics, 2014, 53(29): 177–85. JBJ Riemersma, AF Sanders, C Wildervanck, et al. Vigilance: Theory, Operational
Performance, and Physiological Correlates[M]: Springer, 1977: 41–58. Karar, Vinod and Smarajit Ghosh. “Estimation of tunneling effect caused by luminance non-uniformity in head-up displays.” Chinese Optics Letters 12 (2014): 013301–13306. Li Chunliang. Brightness Study of Characters on Flat Panel Displays. Electric Light
and Control[J]., 1997, 4(3): 39–45 (in chinese). Mackie, & Robert R.. (1977). Vigilance: Theory, Operational Performance, and Physiological Correlates. Vigilance: Theory, Operational Performance, and Phys- iological Correlates. Thomas H. Harding, Clarence E. Rash, Morris R. Lattimore, et al. Perceptual Issues
for Color Helmet-Mounted Displays: Luminance and Color Contrast Require- ments[C]//Conference on Degraded Visual Environments: Enhanced, Synthetic, and External Vision Solutions, 2016. Wang Zhiwei, Wang Mingquan, Gao Hong. Design of a Simulation System for Performance Evaluation of Color Scheme of HUD[J]. Electronics Optics & Control, 2017, 24(2): 75 (in chinese).
Xie Jianying, Wang Xiaolong, Lv Jun, et al. On Luminance and Line Width of HUD Symbols[J]. Electronics Optics & Control, 2014, 21(8): 68 (in chinese). Xie Ning, Chen Dengkai, Zhou Yao, Zhang Xian. A method for evaluating human-
machine interface in civil aircraft cockpit based on human factor reliability. Journal of Northwestern Polytechnical University, 2022, 40(6): 1250–1260 (in chinese).
LISTED IN THE AHFE DIGITAL BOOKSTORE CATALOGUE
Explore the complete digital volume
Advances in Human Factors of Transportation
Read this individual research paper free through the original publisher, or explore the full digital proceedings book.
ISBN 978-1-964867-24-3
Explore this ISBN in the AHFE Bookstore ↗Listed in the July 2026 bookstore catalogue; search by ISBN to confirm current availability · Digital book purchase optional