Kathryn Feltman, Amanda Kelley (2024). Evaluation of Helicopter Performance Indicators for use in the Development of Digital Twin based on Physiological Sensor Data from the Aviator. In: Accessibility, Assistive Technology and Digital Environments. AHFE Open Access, vol. 121, pp. 216–221. https://doi.org/10.54941/ahfe1004630
Ongoing work within the military, as well as in the civilian sector, continues to pursue the goal of operator state monitoring (OSM) through physiological metrics. The overarching goal of this effort is to provide a near real-time objective assessment of an operator’s state that is predictive of performance degradation. It is anticipated that such an endeavor would result in a human digital twin system (HDTS) (Miller & Spatz, 2022), whereby the physiological data collected from the human operator would be used to model and predict operator states under different flight conditions, subsequently used to predict future performance. Creation of such a system will require large quantities of data that will need to be accumulated from a variety of flight conditions (i.e., weather) and types of maneuvers (e.g., hover, takeoff). Although significant progress has been made to-date, a key component remains undefined. We have yet to define what aspects of performance are critical to be predicted within such a system. To maximize the utility of OSM within an operational setting, detecting when performance is likely to degrade, or has begun to degrade, is essential for the system to make use of this information, ultimately engaging some form of adaptive automation – through an HDTS. While a plethora of work has been completed to-date to determine the performance parameters necessary for implementing various cues to the aviator or in some cases, automation (e.g., automatic ground collision avoidance system), much of this work has been done with a relatively narrow scope. Ongoing work, through literature review, is aimed at evaluating performance parameters to determine what aspects of aviator performance have been demonstrated to indicate adequate performance across different maneuvers. Alongside this effort, we have recently evaluated the effects of various cues (auditory and tactile) within a UH-60 full-motion simulator on different performance outcomes (Feltman et al., 2024). While manipulating these cues, we evaluated the physiological data and performance outcomes of 16 Army aviators. From this study, we measured approach performance using a parameter derived from one of the visual cues (vertical speed indicator). The performance outcome was the amount of time participants spent within the target range of this visual cue, which indicated adequate performance for the task. Using this as an outcome measure, we demonstrated that auditory and tactile cueing combinations had different effects on this measure, F(3, 297) = 3.76, p = 0.011. The physiological data collected concurred with the findings of performance data, where those with better performance on this outcome measure showed increased physiological arousal (increased heart rate, F[3, 118] = 8.02, p < 0.0001, decreased heart rate variability, F[3, 118] = 9.39, p < 0.0001). Taken together, the result of this study provides an initial step toward defining flight performance outcomes that correspond with changes in physiological parameters of the aviator. Ongoing work continues to evaluate various types of performance measures that may be used independently or in combination with others (to create an index) for the purposes of OSM/HDTS development.
Ongoing work within the military, as well as in the civilian sector, continues to pursue the goal of operator state monitoring (OSM) through physiologi- cal metrics. The overarching goal of this effort is to provide a near real-time objective assessment of an operator’s state that is predictive of performance degradation. It is anticipated that such an endeavor would result in a human digital twin system (HDTS) (Miller & Spatz, 2022), whereby the physio- logical data collected from the human operator would be used to model and predict operator states under different flight conditions, subsequently used to predict future performance. Creation of such a system will require large quantities of data that will need to be accumulated from a variety of flight conditions (i.e., weather) and types of maneuvers (e.g., hover, take- off). Although significant progress has been made to-date, a key component remains undefined. We have yet to define which aspects of performance are critical to be predicted within such a system. To maximize the utility of OSM within an operational setting, detecting when performance is likely to be degraded, or has begun to degrade, is essential for the system to make use of this information, ultimately engage some form of adaptive automation – through an HDTS. While a plethora of work has been completed to-date to determine the performance parameters necessary for implementing various cues to the aviator or, in some cases, automation (e.g., automatic ground
Evaluation of Helicopter Performance Indicators 217
collision avoidance system), much of this work has been done with a rel- atively narrow scope. Ongoing work, through literature review, is aimed at evaluating performance parameters to determine which aspects of avia- tor performance have been demonstrated to indicate adequate performance across different maneuvers.
As a starting point for initial study, the approach phase of flight was selected for examination because it is the phase of flight where the major- ity of accidents occur (Payan et al., 2017). By narrowing focus to this one segment of flight, we can begin determining whether we are able to estab- lish a reliable relationship between physiological measures and performance outcomes.
METHODS
Study was approved by the U.S. Army Medical Research and Development Command Institutional Review Board. The data reported here is a subset of data from a larger study evaluating the effects of multisensory cueing on aviator performance; please refer to Feltman et al. (2024) for full study details.
Sixteen male rotary-wing aviators from the Fort Novosel, AL area partici- pated in the study. Participants all reported good health and were current and qualified UH-60 pilots. Participants had a range of flight experience, with flight hours in the past year ranging from 20 to 400 hours (M = 170.26, SD = 139.14).
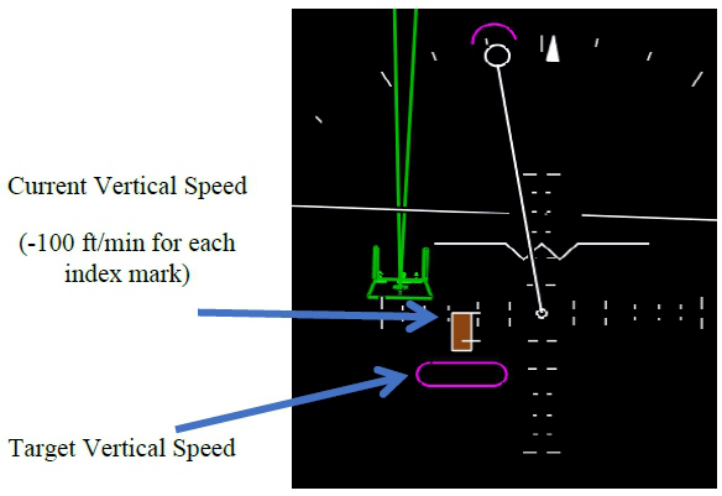
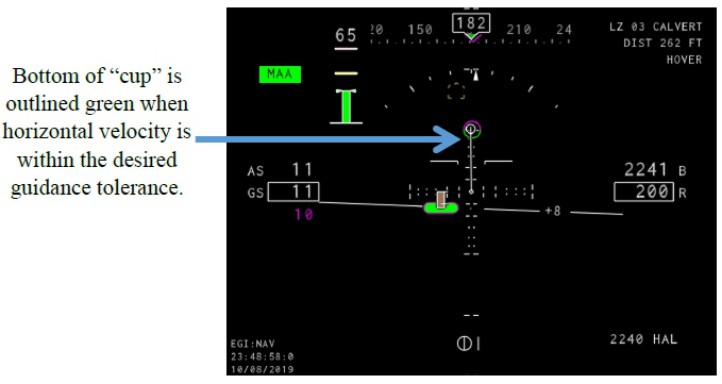
Materials and Equipment The study utilized cues that are components of the Integrated Cueing Envi- ronment (ICE) which was developed by researchers at the Army’s Aviation and Missile Command (see Godfroy-Cooper et al., 2019) for further descrip- tion. ICE cues were developed mainly with the goal of aiding pilots during degraded visual environment flight. As such, many of the cues involve the use of visual symbology. For the purposes of this study, one aspect of the visual symbology was of greatest interest, which was the vertical speed indicator and the vertical speed “cup” (see Figures 1 and 2 below). These symbols were used to provide the aviator feedback about current vertical speed, which is a key aspect of performance to monitor during the approach-to-landing phase of flight. When flying the approach phase, the aviator must maintain the target vertical speed, depicted as the magenta oval in Figure 1. The amount of time the pilot maintained the desired vertical speed when in the approach phase of flight is recorded as a performance measure. In addition, the vertical speed “cup” in Figure 2 cues pilots to maintain a desired horizontal velocity; this too is recorded as a performance measure, the duration of time pilots maintained the desired range.
All flights took place within the U.S. Army Aeromedical Research Lab- oratory’s NUH-60 research flight simulator. This simulator consists of a simulator compartment that contains a cockpit, instructor/operator station, an observer station, and a six-degree-of-freedom motion system. However, for this study, the motion system was having a maintenance issue and was in the off mode. The simulator is equipped with an Rsi CV1-R dome and eight Barco FS40 projectors which simulate natural helicopter surroundings for day, dusk, or night. A Dell Precision laptop receives information concerning
Evaluation of Helicopter Performance Indicators 219
changes in the aircraft/simulator state parameters at a 60 Hertz (Hz) capture rate. The spatial resolution is 1/256 of a foot.
Three types of physiological data were collected in the study. These were: electroencephalograph (EEG), eye tracking/pupillometry, and electro- cardiograph (ECG). The EEG data were collected using Advanced Brain Monitoring’s B-Alert X24 wireless, wet electrode system with 20 channels corresponding to scalp locations according to the International 10–20 sys- tem. Data was aggregated from the following frontal channels to evaluate power spectral density (PSD) values: F7, F3, Fz, F4 and F8. The PSD fre- quency ranges that were evaluated included alpha (9-13 Hz), beta (14-30 Hz), and theta (4-8 Hz).
The eye tracking/pupillometry data were collected using a Pupil-Core binocular headset (Pupil Labs, Berlin, Germany). The Pupil-Core camera sys- tem uses small (0.5 centimeter [cm] x 1.5 cm) cameras mounted on a lensless frame similar to eyeglasses. The cameras were positioned to a location 2–4 cm off of each cheek, outside of the forward visual field so that they did not obstruct vision or interfere with task performance. The outcome measures evaluated included fixation counts and pupil diameter.
The ECG data were recorded using the BioPac MP150. Single-lead elec- trodes were placed on each of the participant’s clavicles and one below the right pectoral area. Data were sampled at a rate of 1,000 Hz. Heart rate variability (HRV) was calculated by measuring the time difference between consecutive R-peaks. HRV indices, to include the mean and standard devi- ation, were computed using these time differences and used as outcome measures.
Procedure Participants completed two visits for the study. The first visit included the consent process, completing measures not reported here, and training on the use of the cueing. The second visit is the focus of this paper. During the second visit, participants completed the evaluation flights. The evaluation flights consisted of two routes, each with three flight scenarios featuring dif- ferent missions (air assault, resupply, medical evacuation [MEDEVAC]). The maneuvers performed during each flight scenario are summarized in the table below. While performing the flight scenarios, a research pilot was seated in the cockpit with the participant to act as a co-pilot and direct the scenar- ios. Participants were instructed to maintain airspeeds between 80 and 90 knots indicated air speed (KIAS) and to maintain an altitude at or below 300 feet above ground level (AGL). The flights all occurred within a San Francisco visual database that featured mountains and desert terrain. Work- load was manipulated throughout the flight scenarios to mimic the stressors experienced in operational settings.
Analyses were conducted using R version 4.2.1 (R Core Team, 2022; RStudio Team, 2022). The following packages were used for analyses: lmerTest (Kuznetsova et al., 2017), rstatix (Kassambra, 2023), and tidyverse (Wickham et al., 2019).
Regarding the flight performance outcomes, we found the amount of time spent within the target region of the visual speed indicator was sensitive to the introduced cueing manipulations, F(3, 297) = 3.76, p = 0.011. The phys- iological data were also evaluated to determine whether they supported this change in performance from a workload standpoint. The results of the EEG analyses were non-significant, whereas significant differences were found for the ECG and eye tracking measures. Mean heart rate (beats per minute) was statistically significant, F(3, 118) = 8.02, p < 0.0001. There was also an effect of condition on HRV means, F(3, 118) = 9.39, p < 0.0001. From the eye tracking data, a significant effect of condition was found for two of the three outcome variables. There was a significant effect of condition on fixa- tion counts, F(3, 172) = 3.30, p = 0.02. There was also an effect of condition on pupil diameter, F(3, 170) = 5.61, p = 0.001.
CONCLUSION
This study provided an initial assessment of a flight performance measure for future aircraft that could be used in an HDTS. Should this type of cueing be utilized in future aircraft, an HDTS using aviators’ physiological inputs could be developed where changes in those physiological inputs can aid in determining potential performance deviations. Such a system could aid in correcting a problem before it leads to a mishap, thus improving aviator safety. By identifying performance measures that can be used in conjunc- tion with real-time physiological data measures, we may be able to develop HDTS to aid in increasing mission success by predicting the impact dynam- ically changing environments will have on performance. The measure used
Evaluation of Helicopter Performance Indicators 221
in this study, time spent within the target region of the speed indicator dur- ing approach performance, may provide a piece of the puzzle to reach this end goal.
ACKNOWLEDGMENT
The authors would like to acknowledge the various individuals in the Warfighter Performance Group and Flight Systems Branch who contributed to the success of the project. Without their professionalism and dedication, the project would not have been a success.
REFERENCES
Feltman, K. A., Mackie, R., McAtee, A., Aura, C., Noetzel, J., Wilkins, J., Yue, X., McCormick, R., Alcock, S., and Gerstner, J. A. (2024). Evaluation of a multi- sensory cueing system on aviators’ performance: Impact of tactile and auditory cueing sensitivity levels. USAARL-TECH-TR--2024-13. Fort Novosel, AL: U.S. Army Aeromedical Research Laboratory. Godfroy-Cooper, M., Miller, J. D., Szoboslay, Z., and Hartnett, G. (2019). Multi-
modal pilot cueing for 360
situation awareness. Warsaw, Poland: 46th European Robocraft Forum. Kassambra, A. (2023). Rstatix: Pipe-friendly framework for basic statistical tests. Kuznetsova, A., Brockhoff, P. B., and Christensen, R. H. (2017). ImerTest package: Tests in linear mixed effects models. Journal of Statistical Software, 82(13), 1–26. Miller, M. E., and Spatz, E. (2022). A unified view of a human digital twin. Human-
Intelligent Systems Integration, 4, pp. 23–33. https://doi.org/10.1007/s42454- 022-00041-x Payan, A. P., Lin, P., Johnson, C., and Marvis, D. N. (2017). Helicopter approach stability analysis using flight data records. American Institute of Aeronautics and Astronautics, Inc. R Core Team. (2022). R: A language and environment for statistical computing.
Vienna: R Foundation for Statistical Computing. Wickham, H., Averick, M., Bryan, J., Chang, W., D’Agostino McGowan, L., Fancois, R., Grolemund, G., Hayes, A., Henry, L., Hester, J., Kuhn, M., Pedersen, T. L., Miller, E., Bache, S. M., Muller, K., Ooms, J., Robinson, D., Seidel, D. P., Spinu, V.,... Yutani, H. (2019). Welcome to the Tidyverse. Journal of Open Source Software, 4(43), 1686.
LISTED IN THE AHFE DIGITAL BOOKSTORE CATALOGUE
Explore the complete digital volume
Accessibility, Assistive Technology and Digital Environments
Read this individual research paper free through the original publisher, or explore the full digital proceedings book.
ISBN 978-1-958651-97-1
Explore this ISBN in the AHFE Bookstore ↗Listed in the July 2026 bookstore catalogue; search by ISBN to confirm current availability · Digital book purchase optional