Galo Enrique Valverde Landivar, Ervin Solano, Roy Santana (2024). Optimal Voltage Regulation on Medium Voltage Line In Rural Area Using DIgSILENT. In: Intelligent Human Systems Integration (IHSI 2024): Integrating People and Intelligent Systems. AHFE Open Access, vol. 119, pp. 382–389. https://doi.org/10.54941/ahfe1004502
The present work features an analysis of the voltage levels in the Quevedo Sur substation, which has a 7.9 km route of three-phase 4/0 AWG ACSR feeder, where it was found that the voltage levels obtained from the feeder do not allow the proper functioning of the triphasic motors that contain the pumping machines used in the irrigation area, located in Hacienda JJ. Through the implementation of the DIgSILENT program, the collected data was used, and proceeded with the realization of a single-line diagram, then the percentage of voltage drop that exits in the feeder could be visualize through the simulation of power flow and voltage profile, in turn, the minimum and maximum voltage points were observed along the three-phase line, and the most convenient location for the voltage regulators was estimated by implementing the analytical module called ''Step-Voltage Regulator'', which main function is to verify and correct the voltages that are not in the allowed range according to resolution No. ARCERNNR-017/2020.
Medium voltage lines present problems when transporting energy from one point to another, from the substation to the consumer, this is because the electricity supply is not stable enough and, in turn, because of the long dis- tances they travel (Zhang, 2020). Therefore, voltage variations occur that must be controlled by some voltage regulator, which is responsible for stabi- lizing these variations to maintain a constant level of energy and to protect the equipment always connected (Valda Claros, 2013), (ARCERNNR, 2020), (Restrepo Grisales, 2007).
The problem of low voltage in rural electrical networks is very promi- nent. Currently there are problems in the voltage levels delivered to con- sumers from substations, preventing the correct functioning of devices used in the agricultural and industrial sector (Lovato, 2018), (Centelsa, 2005).
Optimal Voltage Regulation in Medium Voltage Line in Rural Areas Using DIgSILENT 383
In the technical visit carried out at Hacienda JJ, located in the city of Quevedo, it was observed that the voltage levels required by the irrigation pumps were not adequate. Therefore, the system data was collected for later introduction into the power systems analysis program “DIgSILENT” (DIgSILENT, 2017), (Biblus.us.es, 2023), (Salazar, 2015).
This analysis provided a strategic point for the location of the voltage regulators, demonstrating a loss reduction within the entire system in the sim- ulation of the proposed scenario compared to the simulation of the existing scenario in the network that starts from the Quevedo Sur substation (ETAP, 2022).
THEORETICAL BACKGROUND According to resolution “No. ARCERNNR–017/2020”the allowable voltage ranges are:
Table 1. Limits for the source voltage level index (ARCERNNR, 2020).
Table available in the original PDF paper.
Voltage Level Admissible Range High (Groups 1 and 2) ± 5.0 % Medium ± 6.0 % Low ± 8.0 %
A geoportal is a web portal used for working with spatial information. National Electricity Corporation (CNEL EP) has its own geoportal (used in this study) which includes the design of all distribution networks throughout Ecuador (Mejía Cardona, 2019).
Data Gathering For the execution of the technical voltage regulation project, it begins with the data collection, with the following main points:
Geographical location of the Quevedo Electrical Substation and the various load points connected to the Bus Terminal feeder.
Voltage Profile of the Quevedo Electrical Substation.
Wire gauge used in the three-phase and single-phase network of the feeder.
The loads connected to the feeder (from the substation of the irrigation pumps).
The “Quevedo Electrical Substation – Bus Terminal”substation has a total layout of 7.9 km from the substation to the irrigation pumps 1 and 2, passing through the “JJ” plastics factory, using a 4/0 AWG ACSR conductor.
“Nodes”, which are points of load concentration, are indicated. Coordi- nates in UTM for different points are recorded to determine the distances in kilometres that separate them from each other. This is done in order to monitor each of the three-phase and single-phase loads that are supplied by CNEL EP’s service” (Romero, 2021).
Table 2. Coordinates of loads nodes on the “Bus Terminal” feeder (Authors, 2023).
These data are entered into the CNEL EP Geoportal program, and a path- way is constructed to help us determine the number of transformers that are connected, as well as the conductor gauge and the distances between nodes to input them into Digsilent.
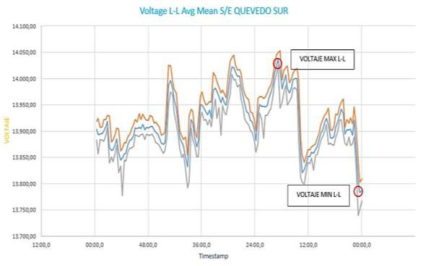
The data from CNEL EP GUAYAS – LOS RIOS is used to obtain the volt- age profile of the Quevedo South Substation, which will be used to analyse the minimum and maximum voltages delivered to consumers.
Figure 1: Maximum and minimum voltage graph (Authors, 2023).
In the graph, is seen the Line-to-Line voltage average. The maximum volt- age point with a value of 14,036.70 volts, and the minimum voltage dip with a value of 13,785.34 volts. After collecting the data, we can begin with the development of the proposed diagram in the “Digsilent” program (IEEE, 1999).
Digsilent Simulation Quasi-Dynamic Simulation
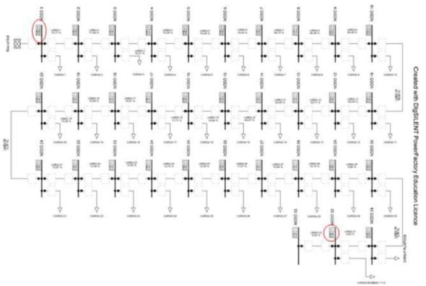
While simulating the diagram, we observe the minimum and maximum volt- age levels per unit at each node and the percentage at which the lines are operating in each section.
Optimal Voltage Regulation in Medium Voltage Line in Rural Areas Using DIgSILENT 385
Figure 2: Quasi-dynamic simulation without voltage regulator (Authors, 2023).
At the beginning of the feeder, we specify at node 1 that the minimum and maximum voltage per unit is 0.99, with a clear voltage drop of 0.92 per unit at the end of the feeder at node 32, where the irrigation pumps are located. This reveals an 8% voltage drop, remembering that the minimum drop limit is 6%.
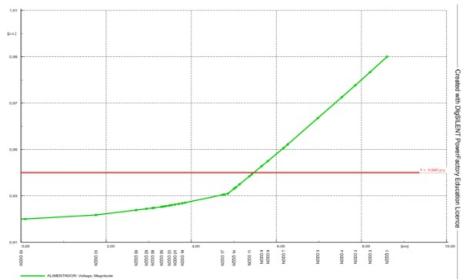
Voltage Profile Single-Line Diagram Without Regulator Is observed that the voltage drop that exists along the feeder starting from node num. 10, located at a distance of 3.318 km from the substation, the voltage falls below the established limit of 6% of the nominal voltage or 12.88 kV, reaching as low as 8% below the nominal voltage or 12.7 kV at node num.32, where the irrigation pumps and the “Hacienda JJ” plastics factory are located.
Figure 3: Voltage profile without regulator (Authors, 2023).
Optimal Equipment Placement Module Configuration The solution is to place 3 single-phase regulators on the feeder. For this, Digsilent has a module called “Optimal Equipment Placement” in which we can perform the regulation through capacitors and voltage regulators.
The module automatically places the regulator bank between node num.1 and node num.2, adding a busbar where the bank will be connected, called “Regulator Node”.
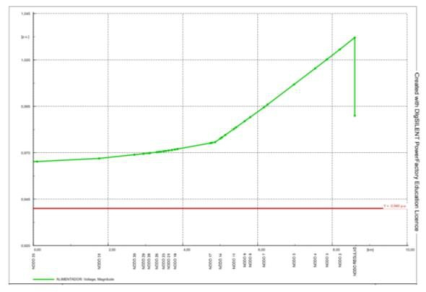
Voltage Profile Single-Line Diagram With Regulator The voltage, initially at 0.99 per unit, is raised to 1.03 per unit through the action of the optimal regulation module, which means 14.2 kV at the first busbar. This ensures that nodes 31 and 32, where the factory and pumps are located, receive a supply of 13.25 kV.
Figure 4: Voltage profile with voltage regulator (Authors, 2023).
RESULTS
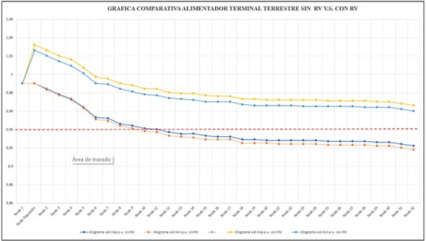
The simulations were carried out in two situations: the “Bus Terminal”feeder without the intervention of the voltage regulator bank (Table 3), and the feeder scenario with the regulation equipment already installed (Table 4). The difference is significant, and the improvement is notable.
Figure 5: Comparative graph before and after regulation (Authors, 2023.)
By comparing the obtained results, it is analysed that the voltage drop that occurred on the Terminal Terrestrial feeder was significantly improved by placing it optimally at a strategic point along the distribution line. It demonstrated the feasibility of designing and installing a medium-voltage step
Optimal Voltage Regulation in Medium Voltage Line in Rural Areas Using DIgSILENT 387
regulator bank, one of 7.62 kV - 318.516 kVA - 418 A - star connection, at the location of node num.1 (near the substation) of the Terminal Terrestre Feeder - Quevedo South Substation.
Table 3. Minimum values at the feeder nodes without voltage regulator (Authors, 2023).
In the initial scenario of the feeder without a voltage regulator, it can be observed that starting from node num.10, the minimum limit established by Resolution No. ARCERNNR–017/2020 is exceeded, considering a range not
less than 6% in medium voltage. In this case, it does not meet the power quality standard. On the other hand, in the scenario of the feeder with a voltage regulator, a good supply quality is appreciated, staying within the margins and delivering a regulated voltage profile to the irrigation pumps and plastics factory located at “Hacienda JJ”.
CONCLUSION
According to the information gathered about the connected loads and the voltage profile of the feeder, it was determined that the three-phase line exceeded the allowed range of −6% starting from node 10 and reached −8% at node num.32, the plastics factory, and the irrigation pumps located at “Hacienda JJ”.
The voltage drop along the line was determined across the connected loads, and it was identified that the problem occurred at nodes num.31 and num.32, where the plastics factory and irrigation pumps belonging to “Hacienda JJ” are located. It was concluded that the voltage regulator bank should be placed at these points to make a direct correction. However, when optimizing the optimal location module, it automatically modified the voltage profile of the entire feeder, benefiting the loads along the path where the regulator would be placed.
Based on the exclusive manual analysis of the voltage profile, the equip- ment would be located between node num.10 and num.11, where there was a voltage drop of 6%. Normally, regulators are placed at points where volt- age drop occurs. However, after conducting a comprehensive analysis of the feeder section, the Digsilent program automatically placed it at node 1, indi- cating that it is the point where the voltage profile significantly improves compared to placing it at any other node. It is the location where the best results were obtained.
In conclusion, the addition of a regulator bank to the “Bus Terminal” feeder is highly feasible, as it recovers 4% per unit of the voltage level at the end of the feeder where the irrigation pumps are located. These pumps require high-quality service to preserve the condition and functionality of the machines.
ACKNOWLEDGMENT
The authors would like to acknowledge to Lidia Yepez, and Luigi Caicedo, Students from Science and Technology Area, Universidad Politécnica Sale- siana, Guayaquil, Ecuador.
REFERENCES
Agencia de Regulación De Energía Y Recursos Naturales No renovables, Regulacion- 002-20, de Regulación Nro. ARCERNNR, 2020. Biblus.us.es, “CAPÍTULO I RED DE DISTRIBUCIÓN DE ENERGÍA ELÉCTRICA”, 2023. Available: https://biblus.us.es/bibing/proyectos/abr eproy/10963/fichero/Archivos%252F01+Red+de+Distribucion+de+Energia+Ele ctrica.pdf.
Optimal Voltage Regulation in Medium Voltage Line in Rural Areas Using DIgSILENT 389
Centelsa, Boletín Técnico-marzo 2005, Cables y Tecnología, 2005. Cepeda y J. Salazar, Comparación Técnica entre los Programas de Simulación de Sistemas de Potencia DIgSILENT PowerFactory y PSS/E, Revista Técnica energía, n
11, pp. 30, 2015. 22- Chimbo Campuzano y H. A. Robles Lovato, Ubicación óptima de reguladores de
voltaje en el sistema de medio voltaje correspondiente a la subestación portovelo aplicando segregación de flujo de carga al más crítico, 2018. DIgSILENT, PowerFactory User Manual, 2017. Available: https://www.digsilent.de /en/. IEEE STANDARDS ASSOCIATION, IEEE Standard Requirements, Terminology,
and Test Code for Step- Voltage Regulators IEEE, C57.15–1999, 2000. Mejía Cardona, G. Jiménez Cleves and J. Garzón Barrero, “QUÉ ES UN GEOPOR- TAL Y CÓMO SE CREA?,”2019. Restrepo Grisales, M. Granada Echeverri y R. Gallego Rendón, Instalación óptima
de reguladores de tensión en sistemas de distribución usando la técnica de enfriamiento simulado, Con-ciencias, n
20, 2007. Success, Soluciones en Tiempo Real para sistemas de Potencia Basadas en Modelos, 2005 Valda Claros, D. Rodrigo Alfred y R. Castañón Gomez, COLEGIO DE INGE-
NIEROS ELECTRICISTAS Y ELECTRÓNICOS, de Electro Mundo, CATA- CORA, 2013. Vega Romero, “Análisis de la energía eléctrica de la subestación “El Pache”utilizando medidores y reguladores de voltaje de media tensión para eliminar las variaciones de voltaje,”2021. Vega Romero, Análisis de la energía eléctrica de la subestación “El Pache”, utilizando
medidores y reguladores de voltaje de media tensión para eliminar las variaciones de voltaje., 2021. Zhang X., 10kV Compensating Voltage Regulator for Reducing Carbon Brush Current and Its Application, pp. 1–4, 2020.
LISTED IN THE AHFE DIGITAL BOOKSTORE CATALOGUE
Explore the complete digital volume
Intelligent Human Systems Integration (IHSI 2024): Integrating People and Intelligent Systems
Read this individual research paper free through the original publisher, or explore the full digital proceedings book.
ISBN 978-1-958651-95-7
Explore this ISBN in the AHFE Bookstore ↗Listed in the July 2026 bookstore catalogue; search by ISBN to confirm current availability · Digital book purchase optional