Tomohisa Hayakawa, Masato Kigoshi (2023). Human Evaluation of “Colored” Hydrogen Transactions Towards Carbon Neutrality. In: Application of Emerging Technologies. AHFE Open Access, vol. 115, pp. 35–46. https://doi.org/10.54941/ahfe1004300
An incorporated analysis of selling green hydrogen and gray hydrogen, as opposed to sellingtheir mixed hydrogen, is investigated. Specifically, we analyze how the social surplus is characterized for the mixed hydrogen. We perform supply/demand analysis of the mixed hydrogen in terms of the ratio of the green hydrogen. Furthermore, we derive the equilibrium price and social surplus, and clarify the optimal sales of green hydrogen. In addition, for the case where green hydrogen and gray hydrogen are traded in separate markets, we discuss what measures can be taken to increase the demand for green hydrogen.
Energy conversion has become a major issue for the next 30 years toward the goal of the Paris Accord, “2050 carbon neutral”. Hydrogen is widely attracting attention as a bearer of green energy because it can be efficiently converted into energy for transportation and industry without emitting car- bon dioxide (CO2). However, most of the hydrogen currently in circulation is from fossil fuels, and CO2 is generated at the manufacturing stage. There- fore, it is desired to build a hydrogen supply chain using renewable energy (McDowall, 2014; Momirlan and Veziroglu, 2005; Kothari et al., 2008). Hydrogen produced using fossil fuels is called gray hydrogen, and hydro- gen produced using renewable energy is called green hydrogen (Ishaq and Dincer, 2021; Dincer, 2012). The green hydrogen strategy is an expensive strategy because it uses costly manufacturing technology, and its high cost hinders the spread of the market (Yu et al., 2021; Andrews and Shabani, 2014). Currently, the main method of selling green hydrogen and gray hydro- gen to general consumers is to use a mixture of these types of “colored” hydrogen.
Various studies have been conducted on the spread of hydrogen, and pro- posals for a hydrogen credit system (Dong et al., 2021), i.e., for an efficient hydrogen operation strategy using wind power generation (Grüger et al., 2019), and a hydrogen supply chain in Pakistan (Gondal et al., 2018). Research on optimal setting of hydrogen supply chain (Nunes et al., 2015), necessity of CO2 recovery and storage technology by verifying the carbon
dioxide reduction effect of hydrogen energy has also been conducted. Fur- thermore, other lines of research include dynamic pricing mechanism for hydrogen stations using blockchain (Wang et al., 2022), decarbonization in the field of industry, transportation, construction, and electric power by utilizing hydrogen (Oliveira et al., 2021), economic development and expan- sion of hydrogen demand in China (Ma et al., 2010), hydrogen demand and optimal hydrogen supply network in Malaysian Peninsula (Kamarudin et al., 2009). The issue of green energy related to hydrogen has also been discussed in various works, such as analysis of the feed-in tariff (FIT) and green power cer- tificate system (TGC) in the UK by the manufacturing industry (Ta ´mas et al., 2010). In addition, analysis of dynamic evolution of low carbon strategy choice (Chen et al., 2021), analysis of credit period in a two-tiered green supply chain consisting of manufacturers and retailers (Panja et al., 2020), and carbon emissions taxation issues have also been investigated. Presenting a two-step optimization model that strikes a good balance between reduc- tion targets and emissions sector interests (Wei et al., 2014) and analysis of government subsidies for carbon tax and decarbonization to promote the introduction of green technology (Pan et al., 2021) are being studied. In this way, research is being carried out using various approaches to popu- larize green hydrogen, but there are few studies that discuss hydrogen sales methods.
In this paper, the supply and demand for mixed hydrogen of green hydro- gen and gray hydrogen is analyzed by taking the ratio of green hydrogen as a parameter, and the social surplus is derived. We analyze how this is character- ized and compare the method of selling green hydrogen and gray hydrogen without mixing them and the method of selling mixed hydrogen. This leads to the equilibrium price, equilibrium quantity, and optimal hydrogen dis- tribution that maximizes the social surplus, and clarifies which economic factors should be focused on for the spread of green hydrogen. In addition, we consider what measures should be taken to increase the demand for green hydrogen when green hydrogen and gray hydrogen are traded in different markets.
SUPPLY/DEMAND ANALYSIS OF MIXED HYDROGEN In this section, we begin with characterizing the mixed hydrogen of green hydrogen and gray hydrogen. We denote by x the ratio of green hydrogen so that the ratio of gray hydrogen is given by (1 – x) with 0 ≤x ≤1. Specifically, if the (mixed) hydrogen contains only green hydrogen, then x = 1, whereas it consists of only gray hydrogen, then x = 0. Let qs and qd denote the supply and the demand quantities of the mixed hydrogen, respectively.
Supply Here we assume that there is a person who obtains green hydrogen and gray hydrogen from independent markets and mixes the 2 types of “colored” hydrogen with the rate x of green hydrogen. The supply curves of the green and the gray hydrogens are respectively given by
Human Evaluation of “Colored” Hydrogen Transactions Towards Carbon Neutrality 37
Table 1. Values of the parameters used.
Table available in the original PDF paper.
Parameters Values aS 1 1.5 aS 0 0.6 bS
1 1000 bS
0 400 ad
1 0.6 ad
0 0.8 bd
1 1600 bd
0 1000 c 4
Equations and mathematical formulas are available in the original paper PDF.
where P1 (qs) and P0 (qs) denote the marginal costs along with bS
0, bS 1, aS 0, aS 1 being positive constants. Since the fixed production cost is more expensive and the price elasticity of supply is larger for green hydrogen than the ones for gray hydrogen, we assume that bS
1 > bS 1and aS 1 > aS 0 hold. From the supply curves (1), (2), we then calculate the marginal cost Ps (x, qs) of the mixed hydrogen where the ratio of green hydrogen is x. Specifically, when the total supply of the mixed hydrogen is qs, the supply of green and gray hydrogen is given by xqs and (1 – x)qs, respectively.
Since the total amount Ps (x, qs)qs of the transaction is equal to the sum of the amounts of the transactions of green and gray hydrogen, the marginal cost Ps (x, qs) of the mixed hydrogen for the supply qs must satisfy Ps(x, qs)qs = Ps(1, xqs)(xqs) + Ps(0, (1 −x)qs)[(1 −x)qs]. (3)
As a result, the marginal cost of the mixed hydrogen is expressed as Ps(x, qs) = P1(xqs)x + P0((1 −x)qs)(1 −x)
1 + (1 −x)bs 0 + [x2as 1 + (1 −x)2 as 0]qs, (4) which satisfies Ps(0, qs) = P0(qs) and Ps(1,qs) = P1(qs) given by (1), (2).
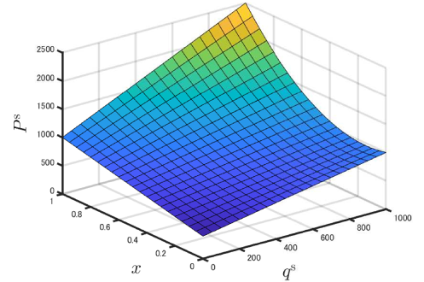
It is interesting to note that for a given x, the marginal cost (4) is a linear function of the supply qs. Fig. 1 shows the marginal cost as a function of x and qs with the parameters bs
1, bs 0, as 1, as 0 that are given in Table I. We call this curved plane of the supply curves “curved supply plane.” On the other hand, (4) is equivalently expressed as =
x, qs
as
qsx2 +
bs
1 + as 0
1 −bs 0 −2as 0qs x + bs
0 + as 0qs
Ps
!2
Equations and mathematical formulas are available in the original paper PDF.
bs
Equations and mathematical formulas are available in the original paper PDF.
0 + as 0qs , (5)
4
as
qs −
1 + as 0
38 Hayakawa and Kigoshi
Figure 1: Curved supply plane Ps (x, qs ).
so that Ps (x, ·) is understood as a quadratic function of x. Furthermore, it can be seen that for a fixed amount of supply qs, the optimal ratio x = x*(qs) which makes the marginal cost minimum is given by
1 −bs 0 −2as 0qs
Equations and mathematical formulas are available in the original paper PDF.
qs , (6)
as
1 + as 0 and the resulting marginal cost is given by
bs
qs
, qs
bs
0 + as 0qs . (7)
Ps
4
qs −
as
Demand Suppose that the demand curves for green hydrogen and gray hydrogen by the consumers are given by
P1
qd
where P1 (qd) and P0(qd) denote the prices of willingness to pay with bd
0, bd 1, ad
0, ad 1 being positive constants. Since green hydrogen with no carbon emission is perceived as more valuable and the price elasticity of demand is larger for green hydrogen than the ones for gray hydrogen, we assume that bd
1 > bd 0 and ad
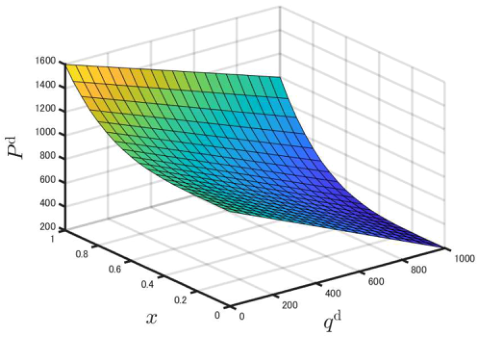
1 < ad 0 hold. Here the consumers are to buy the mixed hydrogen that is provided under certain mixture ratio of green hydrogen. Let Pd (x, qd) denote the demand curve of the mixed hydrogen. Like the curved supply plane, the collection of the demand curves Pd(·, qd) forms the “curved demand plane” as given in Fig. 2. The parameters bd
1, bd 0, ad 1, ad 0 that are given in Table I are used for this figure.
Human Evaluation of “Colored” Hydrogen Transactions Towards Carbon Neutrality 39
Figure 2: Curved demand plane Pd(x,qd).
It is worth noting that the case where the mixed hydrogen instead of pure green or pure gray hydrogen is provided should be appropriately mod- eled according how the consumers value the mixed hydrogen. Specifically, when the demand qd is fixed, we assume that Pd(x, qd) is a function of xc such that
x, qd
qd
xc + β
qd
Pd
where c is a positive constant and α(qd) and α(qd) are also positive such that Ps(0, qd) = P0(qd) and Pd(1, qd) = P1(qd). By this assumption, it follows that
Equations and mathematical formulas are available in the original paper PDF.
bd
xc + bd
ad
xc + ad
qd, (13)
0
0
1 −bd 0
1 −ad 0
The power c in (13) indicates how the consumers affect their aggregate demand to the provided mixed hydrogen. As shown in Fig. 2, when c is large, the willingness to pay does not change much for the case where x is small (close to 0), whereas it does change rapidly for the case where x is large (close to 1), indicating that the price of the mixed hydrogen really matters and the use of green hydrogen is not really accepted by the consumers. On the other hand, when c is close to 1, the willingness to pay increases almost linearly as the ratio of green hydrogen increases in the mixed hydrogen. In this paper, we consider the case of c ≥1 because the case where 0 ≤c ≤1 implies that the willingness to pay drastically increases when x becomes larger around x = 0 (very little ratio of green hydrogen), which is not very realistic.
40 Hayakawa and Kigoshi
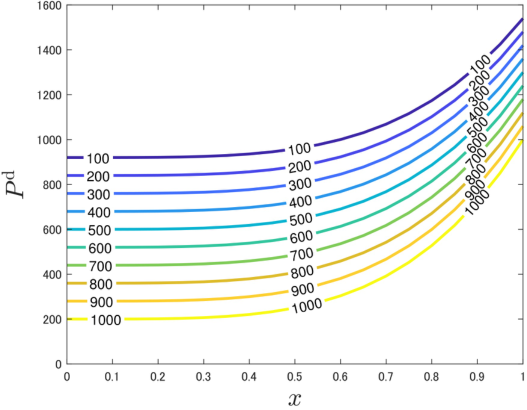
It is also observed in Fig. 2 and (13) that the function Pd(·, qd) is a linear function of qd. Figure 3 shows the contour plot of Pd (x, qd) on the Pd-x plane. This indicates that smaller price and larger ratio of green hydrogen contribute to the increase of the demand.
Equilibrium State From the microeconomic considerations, the equilibrium state is derived as the intersection of supply and demand curves. Based on this principle, in this section we characterize the set of equilibrium states for varying ratio of green hydrogen.
Figure 3: Contour plot of the curved demand plane (the values in the plot indicate the demand).
Let P* (x) and q*(x) be the equilibrium price and the equilibrium quantity, respectively, of the mixed hydrogen with the green hydrogen ratio x. In this case, by equating the right-hand sides of (4) and (13) and by solving for qd, it follows that
xc −
bs
x + bd
bd
1 −−bd 0
1 −bs 0
Equations and mathematical formulas are available in the original paper PDF.
x2 −2as
ad
xc +
as
1 −as 0
0x + as 0 + ad 0 , (14)
1 −ad 0 so that the equilibrium price P* (x) is obtained as
1 −bs 0)x + bs 0[(as 1 + as 0)x2 −2as 0x + as 0] . (bd 1 −bd 0)xc −(bs 1 −bs 0)x + bd 0 −bs 0 (ad 1 −ad 0)xc + (as 1 −as 0)x2 −2as 0x + as 0 + ad 0 . (15)
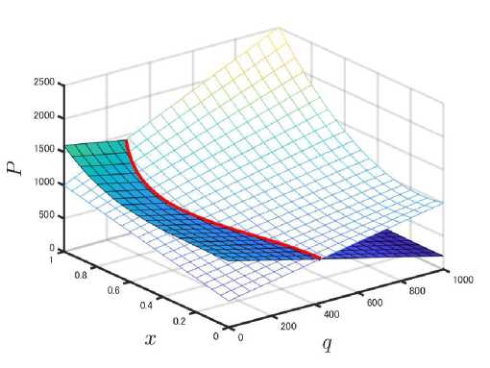
The red curve in Fig. 4 indicates the set of equilibrium states (q* (x), P* (x)) under varying x for the case of parameters given in Table I.
Human Evaluation of “Colored” Hydrogen Transactions Towards Carbon Neutrality 41
Surplus We can discuss suppliers’ surplus, consumers’ surplus, and the social surplus by the curved supply and demand planes.
1) Suppliers’ Surplus: Suppliers’ surplus is characterized as the area below the equilibrium price and above the supply curve. Let Ss (x) denote the sup- pliers’ surplus when the green hydrogen ratio is x. It follows from (4), (14), and (15) that Z q∗(x)
x, q
dq
h
x2 −2as
as
0x + as 0 i
1 + as 0
[Equation or mathematical symbol available in the original paper PDF]
[Equation or mathematical symbol available in the original paper PDF]
bd
xc −
bs
x + bd
1 −−bd 0
1 −bs 0
· [Equation or mathematical symbol available in the original paper PDF]
[Equation or mathematical symbol available in the original paper PDF]. (16)
Equations and mathematical formulas are available in the original paper PDF.
as
x2 −2as
ad
xc +
1 −ad 0
1 + as 0
0x + as 0 + ad 0
Figure 4: Set of equilibrium states (q*(x),P*(x)) under varying x (red curve).
Note that the values of Ss (0) and Ss (1) do not depend on c and they are given by
as
bd
0
as
bd
1
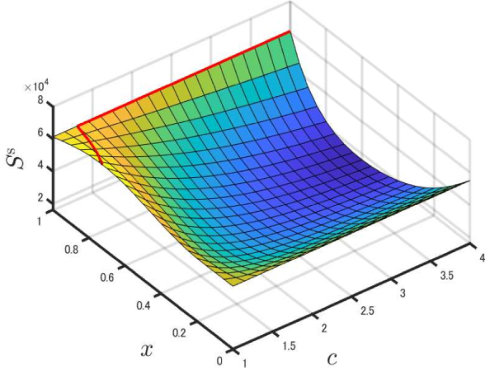
Fig. 5 shows the suppliers’ surplus as a function of x and c with the param- eters given in Table I. The red curve indicates the set of points such that Ss(x)
42 Hayakawa and Kigoshi
is maximized over x for each of c. It is observed that when c is close to 1, the function Ss (x) is concave with respect to x and there is a maximum point in the the interval 0 < x < 1. On the other hand, when c increases, Ss(x) becomes convex with respect to x so that it takes a maximum value at x = 1. In other words, when the demand for green hydrogen is high, the producer surplus is maximized in the state of mixed hydrogen containing green hydrogen, but when the demand for green hydrogen is low, the producer surplus is maxi- mized in the state of 100% of green hydrogen. When a hydrogen procuring company procures hydrogen to maximize the producer surplus, the mixed hydrogen is traded at the ratio of green hydrogen shown by the red line in Fig. 5.
Figure 5: Suppliers’ surplus as a function of x and c.
2) Consumers’ Surplus: Consumers’ surplus is characterized as the area below the demand curve and above the equilibrium price. Let Sd (x) denote the consumers’ surplus when the green hydrogen ratio is x. It follows from (4), (14), (15) that
Equations and mathematical formulas are available in the original paper PDF.
x, q
Pd
xc −
bs
x + bd
bd
1 −bd 0
1 −bs 0
Equations and mathematical formulas are available in the original paper PDF.
ad
xc +
as
x2 −2as
0x + as 0 + ad 0
1 −ad 0
1 + as 0
[Equation or mathematical symbol available in the original paper PDF]
[Equation or mathematical symbol available in the original paper PDF] as
x2 −2as
1 + as 0
·
[Equation or mathematical symbol available in the original paper PDF]. (19)
[Equation or mathematical symbol available in the original paper PDF]1 −
Equations and mathematical formulas are available in the original paper PDF.
ad
xc +
as
x2 −2as
1 −ad 0
1 + as 0
0x + as 0 + ad 0
Human Evaluation of “Colored” Hydrogen Transactions Towards Carbon Neutrality 43 Note that the values of Sd(0) and Sd (1) do not depend on c and they are given by
ad
bd
0
ad
bd
1
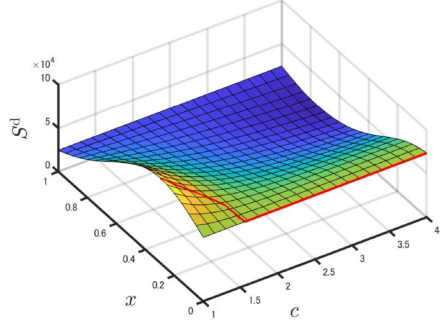
Fig. 6 shows the consumers’ surplus as a function of x and c with the param- eters given in Table I. The red curve indicates the set of points such that Sd (x) is maximized over x for each of c. It is observed that when c is close to 1, the function Sd (x) is concave with respect to x and there is a maximum point in the the interval 0 < x < 1. On the other hand, when c increases, Ss(x) becomes convex with respect to x so that it takes a maximum value at x = 0. In other words, when the demand for green hydrogen is high, the consumers’ surplus is maximized in the state of mixed hydrogen containing green hydrogen, but when the demand for green hydrogen is low, the producer surplus is maxi- mized in the state of 100% of gray hydrogen. When a hydrogen procuring company procures hydrogen to maximize the consumers’ surplus, the mixed hydrogen is traded at the ratio of green hydrogen shown by the red line in Fig. 6.
Figure 6: Consumers’ surplus as a function of x and c.
3) Social Surplus: Social surplus is characterized as the area below the demand curve and above the supply price, which corresponds to the sum of the suppliers’ surplus and the consumers’ surplus. Let S(x) denote the con- sumers’ surplus when the green hydrogen ratio is x. It follows from (4), (14), (15) that
44 Hayakawa and Kigoshi
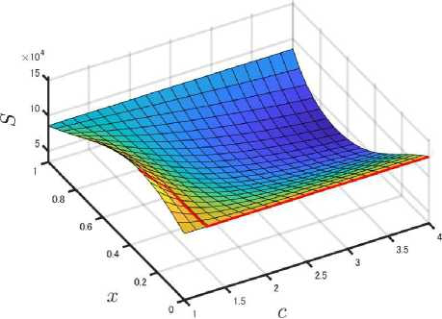
Figure 7: Social surplus as a function of x and c.
Equations and mathematical formulas are available in the original paper PDF.
x + bd
bd
xc −
bs
0 −bs 0 i2
1 −bd 0
1 −−bs 0
x2 −2as
ad
xc +
as
0x + as 0 + ad 0 i. (22)
1 −ad 0
1 + as 0
Note that the values of Sd (0) and Sd (1) do not depend on c and they are given by
bd
bd
Fig. 7 shows the social surplus as a function of x and c with the parame- ters given in Table I. The red curve indicates the set of points such that S(x) is maximized over x for each of c. Similar to the consumers’ surplus, it is observed that when c is close to 1, the function S(x) is concave with respect to x and there is a maximum point in the the interval 0 < x < 1. On the other hand, when c increases, S(x) becomes convex with respect to x so that it takes a maximum value at x = 0. In other words, when the demand for green hydrogen is high, the consumers’ surplus is maximized in the state of mixed hydrogen containing green hydrogen, but when the demand for green hydrogen is low, the producer surplus is maximized in the state of 100% of gray hydrogen. When a hydrogen procuring company procures hydrogen to maximize the social surplus, the mixed hydrogen is traded at the ratio of green hydrogen shown by the red line in Fig. 7.
CONCLUSION FOR COLORED HYDROGEN When there are two separate markets dealing with green and gray hydrogen where the consumers have the same property as discussed in Section II-B. It
Human Evaluation of “Colored” Hydrogen Transactions Towards Carbon Neutrality 45 is expected from the microeconomic theory that the resulting green hydrogen ratio x goes to the value which makes the social surplus maximum.
If the society becomes more sensitive to CO2 emission, the power c tends to be closer to 1 so that the green hydrogen ratio x increases from 0 to a nonzero value that is shown in Section II-D.3 and the more green hydrogen is chosen by the consumers to reduce CO2 emission.
It is important to note that when the parameters are taken as in Table I, it follows that S(0) > S(1) holds and hence if c is large, then the social surplus is maximum at x = 0 (completely gray hydrogen) as shown in Fig. 7. However, it follows from (23), (24) that if ad
1, as 1, bd 1 are small and bs 1 is large, then S(1) > S(0) may hold so that for any c > 1, the social surplus may be maxi- mized with respect to x that is closer to 1. In other words, if green hydrogen becomes a good whose demand and supply will increase significantly as prices rise, the willingness to pay for green hydrogen will increase, and fixed costs in the supply of green hydrogen will decrease, then green hydrogen will be produced. As a consequence, green hydrogen will become more widespread and our society will be closer to carbon neutral.
REFERENCES
J. Andrews, B. Shabani: The role of hydrogen in a global sustainable energy strategy, Wiley Interdisciplinary Reviews: Energy and Environment, Volume 3, 474/489 (2014). H. Chen, J. Wang, Y. Miao: Evolutionary game analysis on the selection of
green and low carbon innovation between manufacturing enterprises, Alexandria Engineering Journal, Volume 60, Issue 2, 2139/2147 (2021). I. Dincer: Green methods for hydrogen production, International Journal of Hydrogen Energy, Volume 37, Issue 2, 1954/1971 (2012). Z. Y. Dong, J. Yang, L. Yu, R. Daiyan, R. Amal: A green hydrogen credit frame-
work for international green hydrogen trading towards a carbon neutral future, International Journal of Hydrogen Energy, Volume 47, Issue 2, 728/734 (2021). I. A. Gondal, S. A. Masood, R. Khan: Green hydrogen production potential for developing a hydrogen economy in Pakistan, International Journal of Hydrogen Energy, Volume 43, Issue 12, 6011/6039 (2018). F. Grüger, O. Hoch, J. Hartmann, M. Robinius, D. Stolten: Optimized electrolyzer
operation: Employing forecasts of wind energy availability, hydrogen demand, and electricity prices, International Journal of Hydrogen Energy, Volume 44, Issue 9, 4387/4397 (2019). H. Ishaq, I. Dincer: Comparative assessment of renewable energy-based hydrogen production methods, Renewable and Sustainable Energy Reviews, Volume 135, 110192 (2021). S. K. Kamarudin, W. R. W. Daud, Z. Yaakub, Z. Misron, W. Anuar, N. N. A. N. Yusuf:
Synthesis and optimization of future hydrogen energy infrastructure planning in Peninsular Malaysia, International Journal of Hydrogen Energy, Volume 34, Issue 5, 2077/2088 (2009). R. Kothari, D. Buddhi, R. L. Sawhney: Comparison of environmental and economic aspects of various hydrogen production methods, Renewable and Sustainable Energy Reviews, Volume 12, Issue 2, 553/563 (2008). T. Ma, J. Ji, M. Chen: Study on the hydrogen demand in China based on system
dynamics model, International Journal of Hydrogen Energy, Volume 35, Issue 7, 3114/3119 (2010).
46 Hayakawa and Kigoshi
W. McDowall: Exploring possible transition pathways for hydrogen energy: A hybrid approach using socio- technical scenarios and energy system modelling, Futures, Volume 63, 1/14 (2014). M. Momirlan, T. N. Veziroglu: The properties of hydrogen as fuel tomorrow in sus-
tainable energy system for a cleaner planet, International Journal of Hydrogen Energy, Volume 30, Issue 7, 795/802 (2005). P. Nunes, F. Oliveira, S. Hamacher, A. Almansoori: Design of a hydrogen supply chain with uncertainty, International Journal of Hydrogen Energy, Volume 40, Issue 46, 16408/16418 (2015). A. M. Oliveira, R. R. Beswick, Y. Yan: A green hydrogen economy for a renewable
energy society, Current Opinion in Chemical Engineering, Volume 33, 100701 (2021). Y. Pan, J. Hussain, X. Liang, J. Ma: A duopoly game model for pricing and green technology selection under cap-and-trade scheme, Computers & Industrial Engineering, Volume 153, 107030 (2021). S. Panja, S. K. Mondal: Exploring a two-layer green supply chain game theoretic
model with credit linked demand and mark-up under revenue sharing contract, Journal of Cleaner Production, Volume 250, 119491 (2020). M. M. Tam’as, S. O. Bade Shrestha, H. Zhou: Feed-in tariff and tradable green certificate in oligopoly, Energy Policy, Volume 38, Issue 8, 4040/4047 (2010). L. Wang, S. Jiao, Y. Xie, S. Xia, D. Zhang, Y. Zhang, M. Li: Two-way dynamic pric-
ing mechanism of hydrogen filling stations in electric-hydrogen coupling system enhanced by blockchain, Energy, Volume 239, Part C, 122194 (2022). W. Wei, L. Yile, F. Liu, M. Shengwei, T. Fang: Taxing Strategies for Carbon Emissions: A Bilevel Optimization Approach. Energies, Issue 7, 2228/2245 (2014). M. Yu, K. Wang, H. Vredenburg: Insights into low-carbon hydrogen production
methods: Green, blue and aqua hydrogen, International Journal of Hydrogen Energy, Volume 46, Isuue 41, 21261/21273 (2021).
LISTED IN THE AHFE DIGITAL BOOKSTORE CATALOGUE
Explore the complete digital volume
Application of Emerging Technologies
Read this individual research paper free through the original publisher, or explore the full digital proceedings book.
ISBN 978-1-958651-91-9
Explore this ISBN in the AHFE Bookstore ↗Listed in the July 2026 bookstore catalogue; search by ISBN to confirm current availability · Digital book purchase optional