Jing Zhao, Xuan Zhang, Fan Zhang, Gang Wu (2023). Comparison of consumer’s risk quality for different sampling plan corresponding to adjacent sample size. In: Production Management and Process Control. AHFE Open Access, vol. 104, pp. 41–47. https://doi.org/10.54941/ahfe1003051
In some practical cases, people want to know the risk difference of the sampling plan corresponding to adjacent sample sizes. This paper mainly discusses the difference of consumer’s risk quality for different sampling plan for both the sampling procedures for inspection by attributes and by variables with adjacent sample sizes. What’s more, we gave the analysis of consumer’s risk quality in different lot size and sample size. The results show that in the sampling procedures for inspection by attributes the exact lot size within the same lot range has little effect to the consumer’s risk quality. The key factor affecting the acceptance probability is the acceptance number. In the sam-pling procedures for inspection by variables, as the sample size increases, the consum-er’s risk quality decreases.
Statistical sampling is a kind of very important and economic means in inspection of product quality. Sampling inspection wants to make the deci- sion about whether to accept the lot from a batch or random samples, about the quality of the batch or process test, which is between with- out inspection and 100% inspection. In our country, there are nearly 30 national standard about statistical sampling inspection, which formed a rela- tively complete system. Some of the most representative and most used are GB/T 2828 sampling inspection standard series (GB/T 2828.1-2012, 2012; GB/T 2828.2-2008, 2008; GB/T 2828.3-2008, 2008; GB/T 2828.4-2008, 2008; GB/T 2828.5-2011, 2011) and GB/T 6378 series (GB/T 6378.1-2008, 2008; GB/T 6378.4-2018, 2018). In the procurement of products quality assessment, many enterprises use sampling inspection plan following GB/T 2828.1(Sampling procedures for inspection by attributes-Part 1: Sampling schemes indexed by acceptance quality limit for lot-by-lot inspection). When given lot size inspection level and acceptance quality limit (AQL), one can get the sampling plan (n, Ac, Re)from GB/T 2828.1, where n stands for sample size, Ac stands for the acceptance number and Re stands for the rejection number. However, in the real cases, the sample size we can get maybe just n – 1. In other words, when reality conditions restrict that the sample size is
not a standard sample size n, namely the sampling plan for (n - 1, Ac, Re) or (n + 1, Ac, Re), the quality of the use of the corresponding risk what’s dif- ferent? This paper mainly discusses the difference of consumer’s risk quality for different sampling plan. What’s more, we gave the analysis of consumer’s risk quality in different lot size.
STATISTICAL BASIS Assume we take the sampling plan (n, Ac, Re), we first take out n unit produ- cts from the lot as the sample. We use X as the number of the nonconforming products in this sample. Take Pa(p) as the acceptance probability when the actual nonconforming rate is p, then we have
Equations and mathematical formulas are available in the original paper PDF.
Assume the lot size is N, in the case of sampling without putting back, X follows hypergeometric distribution, then
Cd
NpCn−d
Ac X
Assume the lot size is N, in the case of sampling with putting back, X follows binomial distribution, then
Ac X
Cd
COMPARISON OF CONSUMER’S RISK QUALITY FOR DIFFERENT SAMPLING PLAN Sampling Procedures for Inspection by Attributes
We mainly compare the consumer’s risk quality in different settings: There are two lot size: 68 and 78. We assume that the specified value AQL = 1.5 and use the single sampling plan for normal inspection. Then we can get the sampling plan is (13,0,1). Sometimes we get a sample with sample size 12 or 14. So we consider three sample size: 12,13 and 14. In a word, we consider the follow- ing six cases: (1) (68,12,0,1); (2) (68,13,1,2); (3) (68,14,0,1); (4) (78,12,0,1); (5) (78,13,1,2); (6) (78,14,0,1).
For the above six sampling plans, the acceptance probability is as follows separately:
68p1C12 68(1−p1) C12
68(1−p1) C12
68 ;
68p2C13 68(1−p2) C13
68p2C12 68(1−p2) C13
68p2C12 68(1−p2) C13
68 ;
Comparison of Consumer’s Risk Quality for Different Sampling Plan Corresponding 43
68p3C14 68(1−p3) C14
68(1−p3) C14
68 ;
78p4C13 78(1−p4) C13
78(1−p4) C13
78 ;
78p5C14 78(1−p5) C14
78(1−p5) C14
78 ;
78p6C14 78(1−p6) C14
78p6C13 78(1−p6) C14
78p6C13 78(1−p6) C14
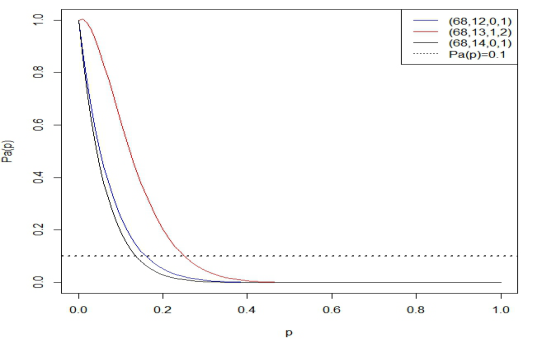
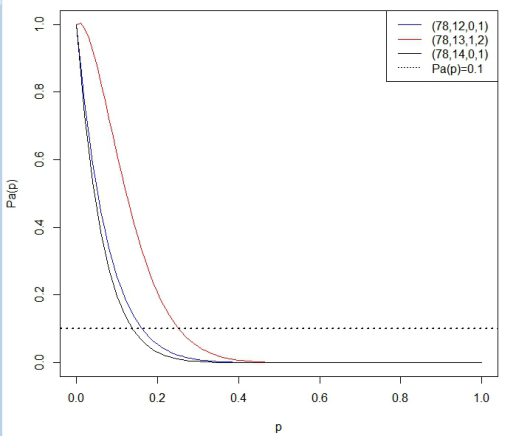
First we give the operating curve for these samplings plan.
From Figure 1 and Figure 2 we can see that within the same lot range the exact lot size has little effect to the acceptance probability. The key factor affecting the acceptance probability is the acceptance number.
Next we compare the quantitative difference for consumer’s risk quality in different settings. Consumer’s risk quality is the quality level when the consumer’s risk is 10%. Table 2 demonstrates the difference.
Figure 1: The operating curves in lot size 68.Table 1. Consumer’s risk quality (CRQ) of different settings.
Table available in the original PDF paper.
Sampling plan (68,12,0,1) (68,13,1,2) (68,14,0,1) CRQ 15.99% 25.08% 13.65% Sampling plan (78,12,0,1) (78,13,1,2) (78,14,0,1) CRQ 16.03% 25% 13.47%
Figure 2: The operating curves in lot size 78.
Sampling Procedures for Inspection by Variables Sampling procedures for inspection by variables can be divided into two big classes: Standard deviation is known and unknown. We mainly want to com- pare the CRQ in different sample size. First we consider the case that standard deviation is known.
Comparison of the Risks of Different Sampling Plans With Known Variance Assume that the single quality characteristic x follows the normal distribution N(µ, σ), and its the upper specification limit is U, then the nonconforming rate p is as follows:
then U −µ
Assume the acceptance constant is k, then acceptance probability is
Comparison of Consumer’s Risk Quality for Different Sampling Plan Corresponding 45
We assume α = 0.05, AQL = 1, then the different acceptance constant in different sample size is in Table 2: For every sampling plan (n, k), the consumer’s risk is β =8(√n(8−1(1−p)−k)) (5)
. (6)
According to (6), we can get the CRQ in different sample size: From Table 3 we can see that as the sample size increases, the CRQ decrea- ses. For the sake of easy to use, we also can use the same acceptance constant. If we use the same acceptance constant 1.870, then the CRQ in different sample size is shown in Table 4: From Table 4 we can also see that as the sample size increases, the CRQ decreases. However, there is little decrease comparing to Table 3.
Comparison of the risks of different sampling plans of double specification limits with unknown variance Normally acceptability criteria of double specification limits with unknown variance is due to the acceptance curve. However, GB/T 6378.1 only gives the acceptance curve of the finite type sample size, for example, n = 13, 18… If we want to know the acceptance curve of n = 14, we first need to know the origin of the acceptance curve. Resnikoff (Resnikoff and George, 1952) did a large number of numerical simulations on the different divisions of the
Table 2. Acceptance constant in different sample size (α = 0.05, AQL = 1%).
Table available in the original PDF paper.
n 13 14 15 16 k 1.870 1.887 1.902 1.915
Table 3. Consumer’s risk quality (CRQ) of different settings.
nonconforming product rate on both sides, and he found that the differences are so small that they can be regarded as the same OC curve. This drives us to discuss the OC curve of single specification limit.
Assume that the single quality characteristic x follows the normal distribu- tion N(µ, σ). For the upper specification limit U, when the variance is known, it can be deduced that its reception probability is
) σ −
σ −
σ , then it is easily to prove that T follows non-central T distribution with n-1 degree of freedom and δ = √n(U−µ)/σ.
For the upper specification limit U, then the nonconforming rate p is as follows:
From (8) we can see that the non-central parameter δ = √n8−1(1 −p), then the consumer’s risk quality p can be solved from the following equation Tn−1,√n8−1(1−p)(√nk) = 0.9, (9)
where k is the acceptance constant for the single specification limit.
When n = 13, AQL = 1, we can get the acceptance constant 1.712. According to the design guideline of GB/T 6378.1, the different acceptance constants corresponding to different sample sizes are obtained due to the dif- ferent risks of the corresponding manufacturer. The design principle is that the larger the sample size, the smaller the risk of the manufacturer. The sam- ple size is increased by the design method of approximate preferred number, which implies that when the sample size is 12, 13, 14 or 15, it can correspond to the same producer risk, and therefore, it corresponds to the same accepta- nce constant. When the sample size is different, the corresponding user risk is different. According to formula (9), given n and k, the corresponding con- sumer’s risk quality of different sample sizes can be calculated as shown in Table 5:
Table 5. Consumer’s risk quality (CRQ) of different settings.
Comparison of Consumer’s Risk Quality for Different Sampling Plan Corresponding 47
For the unknown variance case with double specification limits, when the sample size is 12, 13, 14 and 15, we can use the same OC curve to give the judgement of acceptance or rejection. However,the acceptance or reje- ction criteria of different sample sizes correspond to different consumer risks. Conversely, the corresponding consumer risk quality are different for the same consumer risks. The explicit CRQ are as follows:
CONCLUSION
In this paper, we discusses the difference of consumer’s risk quality for diffe- rent sampling plan both. What’s more, we gave the analysis of consumer’s risk quality in different lot size both the sampling procedures for inspection by attributes and sampling procedures for inspection by variables. What’s more, we gave the analysis of consumer’s risk quality in different lot size and sam- ple size. However, there is some limits in this paper. For example, we didn’t consider sampling procedures for inspection by variables in non-normal case, which is also our future work.
ACKNOWLEDGEMENTS
This research was supported by grants from science and technology plan- ning project of State Administration for Market Regulation (2022MK186) and China National Institute of Standardization through the “special funds for the basic R&D undertakings by welfare research institutions” (522022Y- 9402).
REFERENCES
GB/T 6378.1–2008. Sampling procedures for inspection by variables-Part 1: Sampling schemes indexed by acceptance quality limit for lot-by-lot inspection. GB/T 2828.2–2008. Sampling procedures for inspection by attributes —Part 2:
Sampling plans indexed by limiting quality (LQ) for isolated lot inspection. GB/T 2828.3–2008. Sampling procedures for inspection by attributes —Part 3: Skiplot sampling procedures. [4] GB/T 2828.4–2008. Sampling procedures for inspection by attributes —Part 4:
Procedures for assessment of declared quality level. GB/T 2828.5–2011. Sampling procedures for inspection by attributes —Part 5: Systems of sequential sampling plans indexed by acceptance quality level for lot-by-lot inspection. GB/T 2828.1–2012. Sampling procedures for inspection by attributes-Part 1: Sam-
pling schemes indexed by acceptance quality limit for lot-by-lot inspection. GB/T 6378.4–2018. Samling procedures for inspection by variables—Part 4: Procedures for assessment of declared quality levels for mean. Resnikoff, George J., A New Two Sided Acceptance Region for Sampling by Varia-
bles, Technical Report No.8, Office of Naval Research, Applied Mathematics and Statistics Laboratory, Stanford University, (1952).
LISTED IN THE AHFE DIGITAL BOOKSTORE CATALOGUE
Explore the complete digital volume
Production Management and Process Control
Read this individual research paper free through the original publisher, or explore the full digital proceedings book.
ISBN 978-1-958651-80-3
Explore this ISBN in the AHFE Bookstore ↗Listed in the July 2026 bookstore catalogue; search by ISBN to confirm current availability · Digital book purchase optional