Harsimran Hothi, Fatemeh Davoudi Kakhki (2023). Developing a Quality Control System for Biotechnological Device Inspection Improvement. In: Production Management and Process Control. AHFE Open Access, vol. 104, pp. 19–28. https://doi.org/10.54941/ahfe1003048
Incoming quality control (IQC) is integral to quality management system of manufacturing industries. IQC plays a significant role in ensuring delivery of high standard products to the target customers and, in turn, affects the company’s reputation and their competitiveness in the industry. Presenting a case from a biotechnology company, the purpose of this research is to develop a quality control system for inspection improvement of a biotechnological device. During the COVID-19 pandemic, the IQC Department encountered inconsistencies with output rate when providing inspected parts to the Manufacturing Department: an issue that could be mitigated with a documented process that addresses the prevalent issues that plague the current unestablished IQC system. This study utilized the Lean Six Sigma Methodology to achieve improvement for the IQC Department practice for enhanced performance by identifying root causes of inconsistencies, and creating a systematic documented process for IQC department. Upon successful analysis and implementation of the new IQC inspecting system, the non-value-added time decreased by over fifty percent. While this project is the first stepping stone in improving the IQC Department, its significant results emphasizes the integral contribution of quality control and Six Sigma practices in creating a continuous improvement system which ensures consistent high-quality instruments are being produced for the customers.
While entering uncharted territory in 2020 with COVID-19, manufacturing in the biotechnology field had taken a turn with the influx of orders and higher demand of supplies (Vallatos et al. 2021).
While producing other lab instruments used for research, the biotechno- logy company involved in this case study, mainly creates instruments that build and replicate oligos on a large scale, and takes less time than performing the synthesis manually. Oligos are strands of DNA or RNA that are created artificially in a lab setting and are utilized in many different ways in testing and research implementations including amplifying a determined sequence of nucleotides, virus research, genetic and biological testing, etcetera (Bolognia,
Schaffer, and Cerroni 2017). Relatively, oligo synthesis, which is the techni- que performed by the main products of the company, is the chemical process of generating an oligo. Considering multiple testing facilities and companies involved in producing vaccines for COVID-19 and other diseases, the sales of these devices grew, which in turn increased the amount of parts and batches received from third party vendors to fulfil customer orders.
Due to the increase of parts, the company became aware of an increase of defective units sent to the Manufacturing department. These parts are found during the testing period after partial assembly, which in turn leads to an inef- ficient amount of time of disassembling and either sending the batch back to the vendor for rework, which costs time in production, or the parts are rew- orked in house. If the alterations are done within the company, then the use of the extra resources is just another negative impact to the company’s expendi- ture. Since the influx of this issue, the company has established a department dedicated to Incoming Quality Control (IQC) inspection: a subdivision of Quality Management to improve the process which determines the possibi- lity of incoming manufactured parts based on the standards and regulations set by the company. IQC plays a significant role in ensuring that the customer receives an instrument or device of high standard and in turn affects, not only the company’s reputation in the industry, but also where they stand amongst competition.
The IQC department is responsible for testing and inspection of all inco- ming batches of units to assure they fall within documented design-stated specifications. It is a vital checkpoint where all individual parts are exa- mined, in order to ensure that after assembly, the instrument performs as expected without any failures or complications (Kang et al. 2018). With the expansion of this department, an improved regulated process should be in place to ensure parts are reaching the Manufacturing department in a more timely, efficient manner, maintaining the quality, while addressing the num- ber of incoming parts that are currently sitting in accumulation waiting to be inspected.
Objective of the Study Focusing on addressing the issues in the IQC process, this research aims at:
Identifying causes of issues in IQC process
Creating a documented process It is expected that upon addressing the research questions, the results will help in increasing output of the inspected units to pass onto the materials department, and then to manufacturing. In order to achieve this, we planned to use Lean Six Sigma (LSS) as the main approach for improving the systems in place at this particular company, with final goal of supplying higher quality instruments to the customers efficiently in a shorter amount of time.
METHODOLOGY
The study requires a thorough investigation to establish a more efficient pro- cess for the IQC department – resulting in establishing quality standards and
Developing a Quality Control System for Biotechnological Device Inspection Improvement 21
creating a documented system for IQC. This will be done using the DMAIC method to ensure optimization of the system can be achieved, through this step-by-step implementation of proper analyzation tools.
This Lean Six Sigma (LSS) approach allows identification of correct tools and analytical procedures for detection of faults in the current inspection process in order to provide an improved structure to the system and increase the amount of inspected parts that come out of the IQC department. The current steps that are being performed for IQC will be examined to obtain the root issues that are causing poor performance in detecting the defective units being passed onto the Manufacturing department. The details of the expected steps in DMAIC, relevant to this project, follows.
Define The first step in this approach was to understand the current IQC system pro- cess. Having done that, the define phase result is to focus building an official and efficient IQC process for inspection of the biotechnology instruments, assuring that the units sent for assembly meet company standards. In this study, statistical product control pertains to making decisions of incoming units from third party manufacturers, to determining the acceptability of the batch.
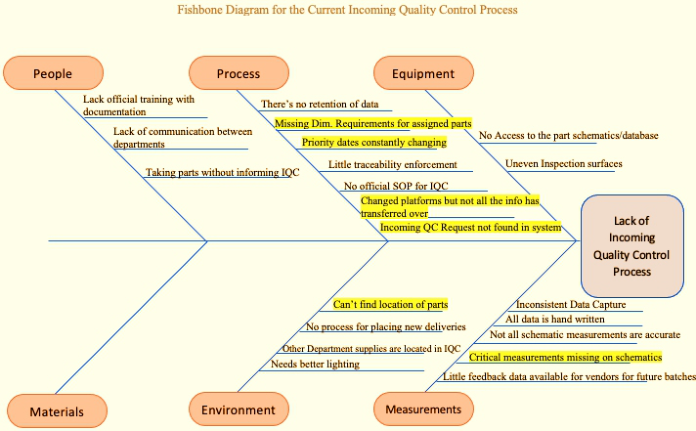
Measure Once the issues and main objective were defined for this case study, possible causes responsible for the lack of efficiencies for the IQC process should be identified. To deconstruct and analyse the current process, a fishbone dia- gram was created to reduce aspects of the system and identify potential main faults (Figure 1). The cause-effect (or fishbone) diagram is used to explore
Figure 1: Fishbone diagram for the IQC process.
22 Hothi and Kakhki
and identify root causes present in the system, as part of the six main cate- gories: people, process, equipment, materials/information, environment, and measurement (Coccia 2017). As shown in Figure 1, the highlights refer to the issues identified during the data collection period, as more significant contributors for problems in the IQC department.
The results here depict that the “process” contains four main obstacles. When examining different parts, it helps to know how many units in a batch needs to be inspected, without the dimension inspection requirements, more time will be taken inspecting the entire batch when a smaller amount could be used for sample batch testing. That is one issue that has caused QC inspecting to take a longer duration of time to get through a whole batch, due to lack of clarification on part dimension requirements. Another is when partial or full IQC orders are placed outside of the set list given during the weekly depar- tment meeting, this causes a shift in priority of all the orders and requires to go through the list and change the completion due dates to accommodate.
An issue that was found when the system changed computer platforms, is that a portion of the QC requests did not transfer over from the old to the new program being utilized. This requires the time to inform the Materials department to create a new request form, when completing an IQC order and the report form is not found. Locating the incoming batches themselves can be a challenge sometimes, as the IQC department has parts that lie on the inside and outside of the department space. Lastly, what utilizes a lot of time is going back and forth from the manufacturing engineers and product engineers due to the schematics given to IQC having critical measurements that are not correct or are completely missing. A fishbone diagram really helped dissect the process at different angles, and find the problems that could be causing deviations in the system.
The Value Stream Map was also made to chart the different stages of the current system so that it can be analysed more thoroughly once all the data is collected, to take a lean approach to dissecting the process (Chaple and Narkhede 2017). Here, the process was under observation, to monitor how the IQC department functions from inspection methods and procedures to how orders are transferred to the Manufacturing department. This helped confirm what part of the process needed to be focused on and what parts needed to be addressed for improvement. Kaizen burst opportunities are uti- lized in Value Stream Maps to show deviations in the process that need to have a closer look at for potential improvement. In this case the Kaizen burst opportunities were found in the same parts of the system that the Ishikawa diagram had identified. This helped in putting the situation more into perspe- ctive and supported the causes that subject the system to lack of regulation. It is vital to understand the cause and effect of the steps taken during the IQC inspection procedure, that way any identified variance can be dealt with the best course of action.
The value of time per step it takes for each unit to be processed through the IQC department is calculated then is evaluated in the form of value-added time and non-value time. The minimum amount of time for value added, which is time contributed to the device that is included in the overall price paid by the customer, is around 140 minutes, where the non-value-added
Developing a Quality Control System for Biotechnological Device Inspection Improvement 23
time, which is not included in the price, is an estimated 120 minutes (Noto, & Cosenz, F. 2021). The Kaizen burst opportunities are next to the deviations in the system which match to the six found in the Ishikawa diagram and are to be addressed in order cut down on the non-value add time.
Analyze To identify the root cause of the process, the six recognized issues which were found in the Ishikawa and Value Stream Map will be under investi- gation. Data was collected in the form of the number of occurrences that deviated from the IQC process, the data accumulation period was over the span of thirty-seven days. The deviation occurrences which were recorded were specifically in the six previously stated categories: the drawing contains missing or wrong information and doesn’t match the part, priority changes, request entries were not entered in, not being able to locate parts in the IQC area, request forms need to be changed due to containing the wrong or mis- sing information, and lastly, the sample batch percentage is not stated for specific part.
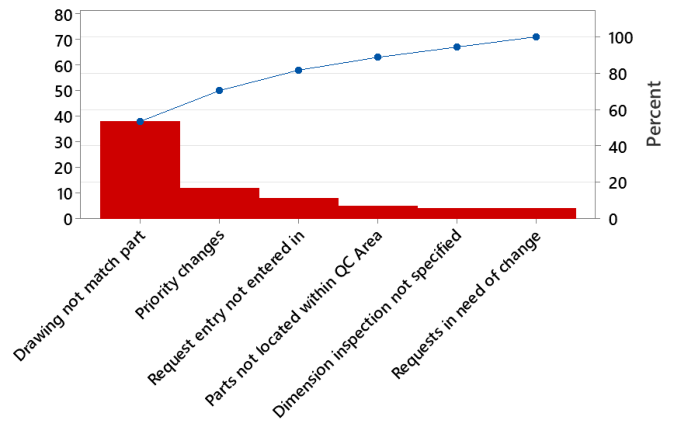
A Pareto chart was constructed with the data for these six issues respe- ctively, as shown in Figure 2. Pareto charts are used in Lean Six Sigma to identify the areas that are most important to look at in regards to process improvement (Lemler, & Semke, W. H. 2015). The length of the various bars on the graph correlate to the frequency of the values of the data, typically the graph is organized so that the bars are displayed largest to smallest starting on the left. The axis on the left-hand side represents the number of occurre- nces recorded in total for each column, and the axis located on the right-hand side represents the cumulative percentage of the total number of occurrences in relation to the total amount of data/occurrences recorded.
Figure 2: Pareto diagram addressing the amount of errors in IQC.
24 Hothi and Kakhki
According to the chart, the schematic containing missing or wrong infor- mation thus not matching the dimensions of the part, made up for an estimated 53.5 percentage of the deviations that happen in the Incoming Quality Control department, with priory changes having the second most events for process digression. This comes to show that the amount of extended time units going past inspection in the Incoming Quality Con- trol department are longer mainly due to solving the problems found in the schematics because it does not match with the parts provided by the third- party vendor. That being said, since missing and/or wrong measurements in the drawing was the largest problem in terms of frequency during the data collection timeframe, it was the root issue that underwent the 5 Whys analysis.
The 5 Whys method is used to help identify root problems that are embed- ded in systems that involve human factors or human errors. It gets down to why one issue can cause a chain reaction of problems in the procedures and lead to deviation of the Incoming Quality Control process, all while analysing the relationship between the different faults in the IQC department practices. Continuously ask why until the root cause for each listed cause is found, it may not even take five ‘whys’ to get down the base of the flaw, it depends on the severity of the problem and the complexity of the system. The first chain of Why’s were to figure out what nonconformity, that stemmed from this issue, was being investigated, and it starts with the missing and wrong mea- surements being stated on the part drawings. Then asking why till this leads to the final explanation for the first chain, which was the fact that the data that was collected, the handwritten data on the schematic print out, was ultima- tely thrown away by manufacturing. So, the Product Engineer never got the necessary information to make corrections to create new revisions of the part schematic. The reason why this problem was not an issue was found in the second line of Five Whys. The drawings are now an issue in terms of wrong and missing data, which was due to the fact that the company has grown since the inspection system for incoming units was created. The process has not accommodated the larger quantity of batches that is now in IQC- before there were larger gaps to inspect the fewer incoming parts and there was more time in between the shipments from third-party vendors. The rare defect that would occur would either be reworked in house, or sent back to the vendor to be fixed-so there was no data of the new altered measurements for the product engineer.
Lastly, the root cause is found in the final 5 Whys chain of questioning that begins with why there was no data passed onto the Product Engineer, this is mainly a result of having all the measurement inspections and notes on physical copies that were disposed of by the Manufacturing department. The main and final root cause was in consequence of the lack of proper pro- cedures in place as well as the failure of the IQC department to progress with the growth of the company in regards to data collection and updating part drawings.
Developing a Quality Control System for Biotechnological Device Inspection Improvement 25
Improvement After convening with management, the inspectors came up with a system for the Incoming Quality Control department of collecting the data and labelling the units with its corresponding data on the spreadsheet- this helps with the practice of traceability in the company. So, if Manufacturing finds any issues, the data that correlates to the number labelled on the unit will be brought up and examined to see where the errors may have happened. If there are any changes to be made the IQC inspectors will create a document at the end of each week to present to the product engineer of all the alterations that need to be done to address the variation in unit inspection. This is all to centralize the information and data for every incoming batch from the third-party vendors, in order to relay the quality statistics back to them at the end of the fiscal year.
PDCA Cycle The PDCA cycle is a Lean method that stands for Plan Do Check Act, and was a method that was utilized in the improvement portion of the DMAIC method, specifically the Check and Act, since the Plan and Do steps were alre- ady fulfilled in the Define, Measure and Analyze phases. In order to check the improvements in place, data was collected fourteen days after implementing the changes, following the same protocol that was used in the methodology step, this way adjustments to the process can be made if necessary. For the Act step, solutions to two issues that were found were implemented. Con- stant feedback and sustained examinations of the many systems in place will establish the awareness of trying to look for ways to refine and enhance the processes, making it a core value of the company to provide to its customers.
Control Though this is only the start of creating the Incoming Quality Control depar- tment, a Standard Operating Procedure, or SOP, was created to attend to the changes made in the Incoming Quality Control process, and will be moni- tored as the company focuses on continuous improvement for better quality provided to the customer. The Standard Operating Procedure document was implemented right away on the upcoming inspection orders.
RESULTS AND DISCUSSION
The importance of implementing an Incoming Quality Control process in any business, ensures that the company has quality at the forefront of their core values when providing products, services and/or instruments for their existing and prospective customers. This project was to provide positive enhancement on a newly developed department which displays flaws and inadequacy in performance. An analysis was done to find the needs of improvement in the Incoming Quality Control department process, using the DMAIC Six Sigma method and the PDCA cycle. In the initial Value Stream Map, the value added was a total estimate of 140 minutes and the non-value-added time was estimated to be 120 minutes
26 Hothi and Kakhki
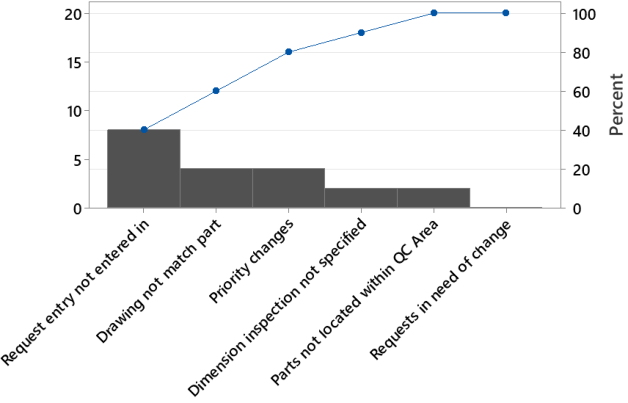
Figure 3: Pareto graph showing the rate that decreased since the original Pareto graph.
A final Value Stream Map was created, to view the newly implemented process in the IQC department. The framework of the process is still simi- lar to the previous except for the previously added improvements. With the additional steps to this system, the value-added increased to be 161 minu- tes if the workbook of the part already exists, if it needs to be made then the value added grows to be 196 minutes. However, the non-value-added time has decreased to fifty- five minutes. So, the non-value-added time has decreased over fifty percent and there has been a noticeable reduction in tur- nover units that come back to the IQC department from Manufacturing for a second inspection due to nonconformities missed by IQC during the first inspection. These occurrences have lessened by an estimated 85.7 percent, and only have a maximum of one turnover occurrence from Manufacturing a week. This is due to the uniform inspection process that is applied to every unit and all data for a unit is traceable from start to finish.
The rate of occurrences, shown in the Pareto graph in Figure 3, where the part schematic has missing or wrong measurements, has displayed improve- ment since the new system has been in place. The original rate of the incorrect schematic for the first fourteen days made up 50% of all process divergent occurrences. In the fourteen days after the change in process took place, that same issue held a rate of 20% - resulting in a 30% decrease.
CONCLUSION
The importance of an Incoming Quality Control process makes a differe- nce in the quality of products and/or services provided to customers. For Company XYZ, it was found that the Incoming Quality Control department was not improving in correspondence to the growth that the company was experiencing for the past two-three years.
Developing a Quality Control System for Biotechnological Device Inspection Improvement 27
The objective of developing a Quality Control System for biotechnological device inspection using Lean Six Sigma methodology was met and the project was successful in identifying the root cause of the IQC process using DMAIC and the PDCA Cycle, and resolved it in the form of a Standard Operating Procedure that states the newly improved process approved by both manage- ment and the IQC inspectors. How was this proven? The improvements led to a 30% decrease in incidents involving missing or wrong measurements on the schematics.
Due to the flawed methods of inspecting, schematics had not been updated and still had missing measurements or errors in tolerances which in turn cau- sed many issues when performing routine inspections. This system includes a weekly to biweekly report to the Product Engineers of all the schematics that have issues and need to be altered to reflect the new revision. This new process decreased non-value-added time by over fifty percent and has helped commu- nicate changes needed to be made to the Product Engineer, in regards to the drawings of the parts. A partial analysis was allowed to be made in regards to the cost equivalent to the amount of time spent by the Incoming Qua- lity Control inspectors on the issues with the schematics, which compared the first fourteen days again shows a reduction in the span of two weeks - a decrease in inspection hourly costs by 80%. And these cost savings are only over the span of 14 working days, and does not consider other aspects of the IQC process.
This project was the first stepping stone into improving the IQC depar- tment, as the company continues to grow in the biotech industry, Company XYZ must make continuous improvement a constant practice for all the departments to ensure that consistent high-quality instruments are being produced for the customers.
ACKNOWLEDGMENT
This publication was supported by the Professional Development Grant for research dissemination awarded by the Charles W. Davidson College of Engi- neering at San Jose State University. The authors appreciate the company’s contribution which made the completion of this study possible.
REFERENCES
al Hanbali, Ahmad, Haitham H. Saleh, and Omar G. Alsawafy. 2021. Integrated Condition Based Maintenance and Spare Parts Supply with Incoming Quality Control and Inspection Errors. Dhahran. Antony, J., Gijo, E. V., & Childe, S. J. (2012). Case study in Six Sigma methodo-
logy: manufacturing quality improvement and guidance for managers. Production Planning & Control, 23(8), 624–640. doi: 10.1080/09537287.2011.576404. Bhargava, M., & Gaur, S. (2021). Process improvement using six-sigma (DMAIC process) in bearing manufacturing industry: a case study. In IOP Conference Series: Materials Science and Engineering (Vol. 1017, No. 1, p. 012034). IOP Publishing. https://doi.org/10.1088/1757-899X/1017/1/012034 Bolognia, Jean L., Julie v Schaffer, and Lorenzo Cerroni. 2017. Dermatology. Fourth
edition. Amsterdam: Elsevier.
28 Hothi and Kakhki
Chaple, Anup P., and Balkrishna E. Narkhede. 2017. Value Stream Mapping in a Discrete Manufacturing: A Case Study. Vol. 6. Coccia, Mario. 2017. The Fishbone Diagram to Identify, Systematize and Analyze
the Sources of General-Purpose Technologies. Vol. 4. de Mast, J., Diepstraten, G., & Does, R. J. (2011). Quality quandaries: Design for six sigma: Method and application. Quality Engineering, 23(2), 204–211. doi: 10.1080/08982112.2011.560818. Jirasukprasert, P., Garza-Reyes, J. A., Soriano-Meier, H., & Rocha-Lona, L. (n.d.).
A Case Study of Defects Reduction in a Rubber Gloves Manufacturing Process by Applying Six Sigma Principles and DMAIC Problem Solving Methodology. In Industrial Engineering and Operations Management Istanbul. Kang, Chang Wook, Muhammad Babar Ramzan, Biswajit Sarkar, and Muhammad Imran. 2018. “Effect of Inspection Performance in Smart Manufacturing System Based on Human Quality Control System.” International Journal of Advanced Manufacturing Technology 94(9–12):4351–64. doi: 10.1007/s00170- 017-1069-4. Lemler, & Semke, W. H. (2015). The Reduction of Modal Sensor Channels through
a Pareto Chart Methodology. Journal of Sensors, 2015, 1–10. https://doi.org/10. 1155/2015/869258 Mitra, Amitava. 2021. Fundamentals of Quality Control and Improvement. 5th ed.
Hoboken, New Jersey: Wiley. Noto, & Cosenz, F. (2021). Introducing a strategic perspective in lean thinking applications through system dynamics modelling: the dynamic Value Stream Map. Business Process Management Journal, 27(1), 306–327. https://doi.org/10.1108/ BPMJ-03-2020-0104 Obraz, R., & Mudronja, V. (2019). IMPROVEMENT OF INCOMING QUALITY
CONTROL BY APPLYING PDCA CYCLE. LEAN SPRING SUMMIT 2019, 22. Pepper, M. P. J., and T. A. Spedding. 2010. “The Evolution of Lean Six Sigma.”
International Journal of Quality and Reliability Management 27(2):138–55. doi: 10.1108/02656711011014276. Vallatos, A., Maguire, J. M., Pilavakis, N., Cerniauskas, G., Sturtivant, A., Speakman, A. J., & Dunn, K. E. (2021). Adaptive manufacturing for healthcare during the COVID-19 emergency and beyond. Frontiers in Medical Technology, 3, 702526. https://www.frontiersin.org/articles/10.3389/fmedt.2021.702526/full
LISTED IN THE AHFE DIGITAL BOOKSTORE CATALOGUE
Explore the complete digital volume
Production Management and Process Control
Read this individual research paper free through the original publisher, or explore the full digital proceedings book.
ISBN 978-1-958651-80-3
Explore this ISBN in the AHFE Bookstore ↗Listed in the July 2026 bookstore catalogue; search by ISBN to confirm current availability · Digital book purchase optional