Yiting Wu (2023). An Analysis of the Spatial Distribution of Crime in Villages in Cities – A Case Study of Dianqian Village in Xiamen. In: Artificial Intelligence and Social Computing. AHFE Open Access, vol. 72, pp. 206–215. https://doi.org/10.54941/ahfe1003289
Urban villages are the legacy of China's rapid urban development, those is characterized by high mobility and complex structure, which is endangering the personal safety of residents in urban villages and the surrounding people, affecting the harmony and stability of the communities in urban villages, and not conducive to social and economic development. By taking the distribution of Robbery, Grab and Theft cases as the data source, combining with big data POI information obtained from Gaode, which is the one of the large map service companies in China. Methods such as kernel density analysis, standard deviation ellipsometry and spatial syntax theory are applied in the study, respectively, in order to quantitatively analyze the relationship between the spatial configuration and the environment of crime distribution within urban villages. The results show that: the accessibility, global integration, local integration and connectivity affect the occurrence of Robbery, Grab and Theft and the escape routes of criminals in the village. Different types of POI points and the occurrence of Robbery, Grab and Theft are correlated. This study helps to identify and improve the environmental factors that induce crime, and provides some references on security for the future renovation and construction of public spaces in urban villages in southern Fujian, China.
Since the reform and opening-up policy, China’s urbanization process has improved steadily, with the urbanization rate reaching 65.22% in 2022. Although urbanization has achieved remarkable results, there are also many problems, such as urban and rural development is not coordinated, and “urban disease,” “rural disease,” and “social disease” have erupted one after another (Wang, 2013).
Among the various aspects of urbanization, safety issues are the most important ones that cannot be ignored. For urban crime, many scholars have revealed in their studies of various aspects in different periods that there is a correlation between urban space and crimes. For example, in the 1830s, the rise of the “cartographic school” combined mapping with crime resea- rch; In the 1920s, C.R. Shaw and H.D. McKay of the United States initiated the ecological study of crime space (Wang, 2003). Since the 1980s, with the
An Analysis of the Spatial Distribution of Crime in Villages in Cities 207
improvement of the geographic information system (GIS), the global positio- ning system (GPS), remote sensing (RS) technology, spatial statistical method analysis, and other information technology and the combined application of various analysis methods, the research has been further developed. In recent years, more and more attention has been paid to the research on the rela- tionship between urban space and crime. Regarding big data, POI data is used to identify factor aggregation and study its spatial distribution chara- cteristics for better optimization and improvement (Xue, 2020). Regarding spatial form, Ding, Zhao, et.. All use space syntax analysis to pay attention to the accessibility of local space and the accessibility and correlation of overall space and conduct in-depth research on the impact on the security of urban villages (Ding, 2015).
In the context of China’s land ownership system and culture, the urban village in the city has been incorporated into the urban structure as a unique urban form. (Zhao, 2022). However, domestic researchers have rarely discus- sed the security issues of urban villages, and urban villages are prone to public security problems due to their particularity, leading to criminal activities and affecting the safety of residents.
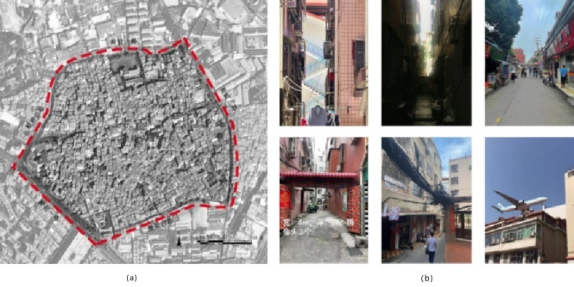
RESEARCH AREA AND DATA SOURCE Dianqian Village is located in the north of Huli District and the northern part of Xiamen Island, Fujian, with a total area of about 40 hectares. Most of the residents in the village are migrant permanent residents, with only 2.89% of the registered residence population. The study area is shown in Fig. 1:
Figure 1: a. Scope of Study. b. The current situation of Dianqian Village.
Data Source The data used in this study include crime cases and points data, POI information, and road data.
1) Crime cases. Robbery, Grab, and Theft refer to robbery, snatching, and theft (including burglary and motor vehicle theft), which account for a large proportion of the total number of local criminal cases, with a high incide- nce rate and a stable trend (Huang, 2022)The crime data were obtained
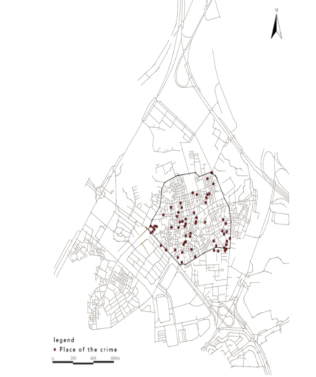
from the information of criminal verdicts of public prosecution cases from 2013–2022 published by Openlaw website(http://openlaw.cn/). The crawler program python was used to extract a total of 81 cases. After data clea- ning, 78 valid records were obtained and geocoded according to the detailed addresses recorded in the criminal verdict data of the cases. The spatial distribution results are shown in Fig. 2:
Figure 2: Crime spot map.
2) Point of Interest(POI). Some studies have shown that to meet the target requirements of property-based crimes, the premises need a good econo- mic status (Feng, 2012). Meanwhile, the high incidence of premises for property-based crimes is usually in ATMs and banks for financial and insu- rance services; Internet cafes, bars, and KTVs for sports and leisure services; and Regional transportation hubs (Liu, 2019). The data were obtained from Gaode Map(https://lbs.amap.com/). The data classification results are shown in Table 1. By de-duplicating, correcting, and spatially matching the data, 429 accurate POI records were obtained.
3) Road data. Based on the Xiamen City Geographic Information Public Service Platform (http://map.zygh.xm.gov.cn/), the map is drawn with the field research, and the road network data is obtained after the topological relationship is checked and modified.
RESEARCH METHODS Nuclear Density Estimation Method
The kernel density estimation (KDE)can measure the density of point and line elements. For point elements, the point density can be estimated by the point density in the surrounding neighborhood. In this paper, the KDE can form a continuous region showing the distribution of crime occurrence density, reflecting agglomeration characteristics and spatial variation. Suppose there
An Analysis of the Spatial Distribution of Crime in Villages in Cities 209
Table 1. The types of POI.
Table available in the original PDF paper.
Class I Class II Class III Commercial Services
Hotels, hostels, guest houses
Catering Services Tea house, pastry store, cafe, fast food restaurant, cold drink store, dessert store, Chinese restaurant, casual dining place Shopping Services Convenience stores, flower, and fish markets, home building materials markets, home appliance and electronic stores, shopping malls, sporting goods stores, cultural goods stores, supermarkets, cosmetic stores, shopping malls, general markets Accommodation Services
Banks, ATMs
Other Services
Financial Insurance Services
Internet cafe, bar, KTV
Sports and leisure services Transportation Facilities
Subway stations, bus stops, traffic light cabs
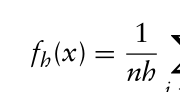
are n points x (x1, x2,..., xn) in the study area, and the formula is as follows:
xi −x
n X k
Equation reproduced from the original PDF.
Where: fh (x)is the nuclear density at point x; h is the distance attenuation threshold (bandwidth); n is the number of points whose distance from x is equal to or less than h; λ Is a spatial weight function.
Standard Deviation Ellipse Standard deviation ellipse (SDE) can accurately reveal the spatial characteri- stics of geographical elements: central tendency, dispersion, and directional tendency. In this paper, ArcGIS10.8 software is used to carry out SDE analysis on the number of crimes and the points of criminal activities, show the distri- bution trend of Robbery, Grab, and Theft crime on the map, and determine the relationship between this behavior and specific elements.
Spatial Syntax Axis Model Space syntax is a series of theories and technologies about space and soci- ety. The basic idea of space syntax theory is to divide space into scales and space and analyze its complex relationship. In this paper, the processed road network data is imported into the spatial syntax software Depthmap for topological analysis, and the integration degree, comprehensibility, depth value, and connection value of the axis are calculated. It is also combined with the field research data for comprehensive analysis.
Buffer analysis The buffer zone analysis studies the relationship between road structure, commercial POI, and criminal activities in Dianqian District, Xiamen. Since the road space in the village is narrow, and people travel mainly by walking and electric vehicles, a local measurement radius of R = 1250m (25min wal- king distance) is set for the road axis to express it, which is convenient for analysis while avoiding extreme values.
RESULTS AND ANALYSIS Nuclear Density Analysis
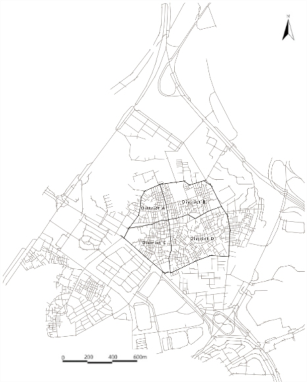
In this paper, the village is divided into four districts according to the east- west and north-south axes, as shown in Fig. 3:
Figure 3: Subdistrict of dianqian village.
The nuclear density distribution map of crime cases and POI is generated by taking the location distribution map of Robbery, Grab, and Theft crime cases in Dianqian Village from 2013 to 2022 and two types of POI data as data sources.
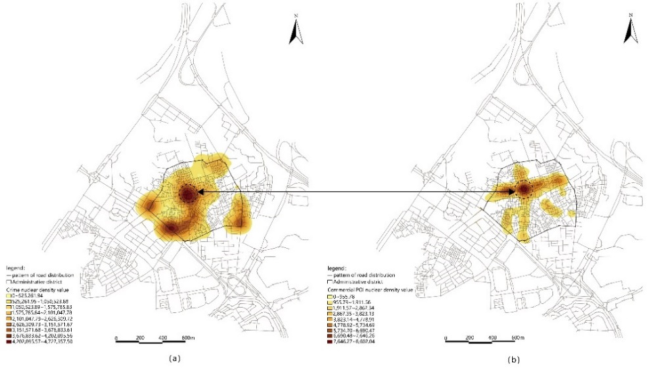
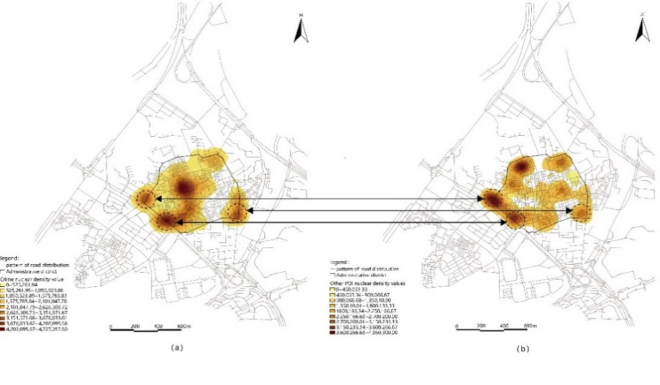
Fig. 4 and Fig. 5 show that criminal cases are mainly distributed at the intersection of the east-west and north-south axes, the intersection of District C and the main road of the city, and the southeast corner of District D. There is a positive correlation between the kernel density centers of com- mercial services and crime, and the kernel density of commercial and crime at the intersection of the axes reaches the maximum value of 8602.04 and 4727357.50, respectively; the intersection of District C and the principal city road, the southeast corner of District D and the kernel density centers of other services have positive correlation at the same time, showing that other services also influence crimes.
An Analysis of the Spatial Distribution of Crime in Villages in Cities 211
Figure 4: a. Kernel density values of crime cases. b. Kernel density values of comme- rcial POI.Figure 5: a. Kernel density values of crime cases. b. Kernel density values of Other POI.
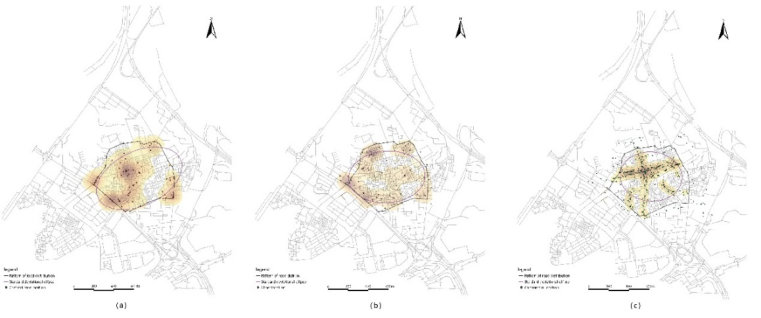
Standard Deviation Ellipse Fig. 6(a) shows that the distribution of criminal cases is in a southwest- northeast trend, with directional solid data distribution, linear relationship, and obvious centripetal.
Fig. 6(b) shows that the commercial points are in an east-west trend, with weak centripetal force, weak directional data distribution, and weak linear relationships.
Fig. 6(c) shows that the other points are in an east-west trend, with weak directionality of data distribution, weak linear relationship, and a more dispersed location.
Figure 6: a. Standard deviation ellipse of crime cases. b. Standard deviation ellipse of commercial POI c. Standard deviation ellipse of other POI.
The direction of the ellipse generated by commercial points and other points is east-west with the direction of the points of Robbery, Grab, and Theft crimes, but the directional trend of other points is more evident than that of commercial points, indicating that other points have a strong relationship with crimes.
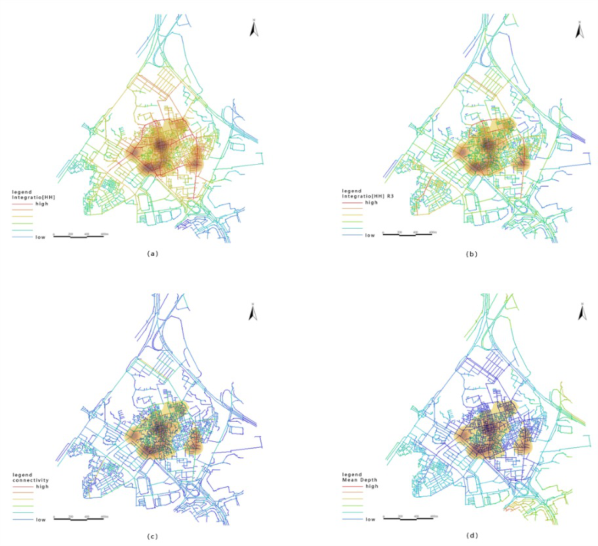
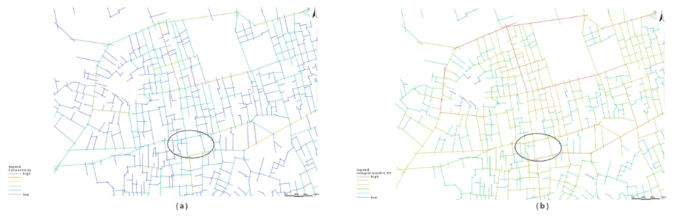
Analysis of the Axis Map Analysis of high crime density area and axes under the global space Fig. 7 shows that the southwest side of the exterior of DQ Village is a major urban artery, while the remaining three sides are connected to minor urban arteries, and the interior consists mainly of streets and alleys. The global integration, local integration, and connectivity of the crime-intensive areas are higher than those of the surrounding areas, indicating that the superiority of the road network of places provides convenience for criminals to escape and makes it easy to form crime “production fields.”The mean depth value of the crime-intensive area is low, and the road space is complex and closed, which cannot form a protective buffer space in the spatial relationship and has low crime prevention.
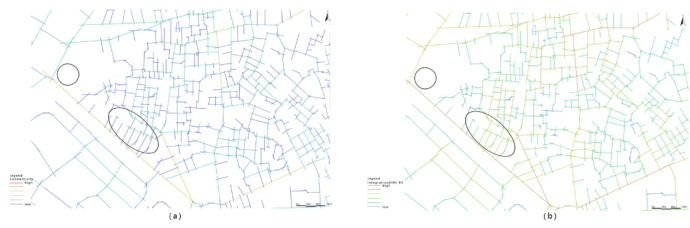
Analysis of high-density crime areas and axes in District A The high-density crime area in District A is located at the intersection of the east-west and north-south axes. As shown in Fig. 8 (a), the maximum connectivity value of high-density crime points is 11, and there are many intersections of streets and alleys, which reduces the traffic cost for the escape of criminals. As shown in Fig. 8 (b), the maximum local integration degree of District A is 2.951347, which is located in the north of District A and belongs to a low-density crime area, which is due to the low integration of the peri- pheral roads on the north side, with a large amount of open space, forming an exemplary monitoring environment. In contrast, the internal road space network is complex, with many closed roads forming a protective defensive
An Analysis of the Spatial Distribution of Crime in Villages in Cities 213
Figure 7: a. Global integration. b. Local integration c. Connectivity d. Mean depth.Figure 8: a. Connectivity of district A. b. Local integration of district A.
space in the spatial relationship between streets and urban villages, which helps to reduce the occurrence of crime.
Analysis of high-density crime areas and axes in District C The high-density crime areas in District C are distributed along the main urban road in the southwest. Their maximum connectivity value and local integration value are 13 and 2.830869, respectively, on the main road (Fig. 9). The main road is the busiest traffic hub in the study area, with many complex roads and multiple entrances and exits, which not only increases the diffi- culty of monitoring the floating population but also increases the difficulty of catching criminals.
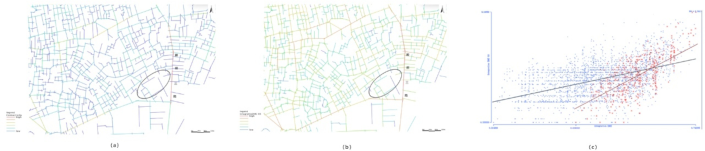
Figure 9: a. Connectivity of district C. b. Local integration of district C.Figure 10: a. connectivity of District D. b. local integration of District D.
Analysis of high-density crime areas and axes in District D The section of Dianqian 3rd Road on the southeast side has the maximum local integration value (3.149523) of Area D, and is also the section with the maximum global integration value (0.742395) and connectivity value (17) in the study area. The site is connected by multiple modes of transportation, while the stability of the schedule and the accessibility facilitate criminals to master the gathering, entry, and escape of people. Meanwhile, the connecti- vity value of the edge of the area is high, while the connectivity value of the internal road is low, indicating that the village has a strong external openness but a certain degree of closedness inside.
As shown in Fig. 10 (c), the regression line formed by the scatter points of the comprehensibility value in District D intersects with the regression line of the whole area in a higher range, indicating that the integration of different scale spatial networks in this District is better, with centrality.
CONCLUSION
The study of the impact of the urban environment on crime helps improve the city’s ability to prevent crime. This paper quantitatively analyzes the relati- onship between spatial grouping and crime distribution environment within the urban village. The following conclusions were drawn:
1) The Robbery, Grab, and Theft crime space in the study area show a polycentric distribution pattern and distance decay characteristics. The crime of Robbery, Grab, and Theft is closely related to regional comme- rcial agglomeration, other POI locations (banks, ATMs, Internet cafes, bars, KTV, transportation facilities), and the degree of population mobility, among which other POI locations have a major correlation with crime.
An Analysis of the Spatial Distribution of Crime in Villages in Cities 215
2) The global integration, local integration, connectivity, and accessibility of the road network affect the occurrence of Robbery, Grab, and Theft and the escape route of criminals in the village. The higher the value, the better the accessibility of the area, which facilitates the escape of criminals; The crime rate is significantly lower in areas with significant topological depth and a good monitoring environment.
REFERENCES
Ding Chuanbiao, Zhang Han, Cheng Mingyang, Wang Shaoxu, Tao Wei. (2015).
Analysis of the Sense of Residents’ Living Safety from the Perspective of Spatial form in Zhucun Vill. Areal Research and Development Volume 34 No. 4. FENG Jian, HUANG Linshan, DONG Ying, SONG Leilei. (2012). Research on the Spatial-Temporal Characteristics and Mechanism of Urban Crime: A Case Study of Property Crime in Beijing. Acta Geographica Sinica Volume 62 No. 12. Huang Rui, Xie Chaowu and Lai Feifei. (2022). Temporal and Spatial Distribution
and Configuration Influencing Factors in Tourism Related Robbery, Snatching, and Theft Crimes in China. Tropical Geography Volume 42 No. 5. LIU Yongchao, PAN Shunqi. (2019). An Analysis of the Distribution of Crimes in Urban Districts of Lanzhou Based on POI Data. GEOMATICS&SPATIAL INFORMATION TECHNOLOGY Volume 42 No. 5. Wang Fazeng. (1988). The geographic research of urban crime abroad. Human
Geography Volume 3 No. 2. WANG Guixin. (2013). The basic theory of urbanization and problems and countermeasures of China’s urbanization. Population Research Volume 37 No. 6. XUE Bing, ZHAO Bing-yu, XIAO Xiao, LI Jing-zhong, XIE Xiao, REN Wan-xia
(2020). A POI data-based Study on Urban Functional Areas of The Resourcesba- sed City: A Case Study of Benxi, Liaoning. Human Geography Volume 35 No. 4. Zhao Yuanye. (2022). Study the Morphological Characteristics of Urban Villages from the Perspective of Historical Evolution. Urbanism and Architecture Volume 19 No. 22.
LISTED IN THE AHFE DIGITAL BOOKSTORE CATALOGUE
Explore the complete digital volume
Artificial Intelligence and Social Computing
Read this individual research paper free through the original publisher, or explore the full digital proceedings book.
ISBN 978-1-958651-48-3
Explore this ISBN in the AHFE Bookstore ↗Listed in the July 2026 bookstore catalogue; search by ISBN to confirm current availability · Digital book purchase optional