Andreas Schuller, Marc Braun, Peter Hahn (2023). A machine learning approach for optimizing waiting times in a hand surgery operation center. In: Artificial Intelligence and Social Computing. AHFE Open Access, vol. 72, pp. 1–10. https://doi.org/10.54941/ahfe1003268
For patients scheduled for surgery, long waiting times are unpleasant. However, scheduling that is too patient-oriented can lead to friction losses in the operating room and waiting times for the medical personnel. We have conducted an analysis of historical hand surgery data to improve forecasting of hand surgery durations, optimize operation room scheduling for physicians and patients and reduce overall waiting times. Several models have been evaluated to forecast surgery durations. A quantile-based approach based on the distribution of surgery durations has been tested in a scheduling simulation. This approach has indicated possibilities to gradually balance waiting times between patients and medical personnel. Within a field trial, a trained regression model has been successfully deployed in a hand surgery operation center.
INTRODUCTION AND MOTIVATION Hospitals must balance the interests of both their personnel and their patients while additionally taking economic factors into account. One major expense for hospitals is the operating room (OR) and its connected costs (Rothstein, 2018). To improve OR efficiency, it is beneficial to minimize idle times betw- een surgeries as much as possible (Childers, 2018). At the same time, for the benefit and positive outlook of the patients, it’s important to keep patient waiting times as low as possible. In this paper we focus on the “short term” (few days) and “very short term” (24-48 hours) time horizons for the OR scheduling problem as defined in (May, 2011). The challenge is to improve the flow in the operation room, especially in the outpatient surgery center. For the scheduling problem, there are two overall objectives (i) to minimize patients waiting times under the constraint of (ii) having no additional idle time in the operating room and on the medical personnel. The central point being can we find an approach to achieve the objectives and also gradually adjust and balance probabilities where waiting will occur.
SURGICAL DATA SET The regarded data set included over 8400 hand surgery procedures in the period from January 2019 to September 2022 and was exported from a
hospital information system (HIS). This data has been used as a basis to analyze and test different machine learning (ML) models and approaches.
PREDICTION OF SURGERY DURATION Key aspect for enabling effective OR scheduling is to be able to correctly predict expected surgery durations (Huang, 2020). One difficulty regarding the dataset was that it consisted predominantly of categorical variables (e.g., type of operation or diagnosis) which required careful feature engineering. Several combinations of feature sets and ML algorithms have been tested.
For the prediction of surgery durations, there have been two relevant mea- sures: (i) time from the first cut until stitching of the patient (excluding time for changing the OR) and (ii) patient to patient, including these changing times. During our analyses we have seen that changing times were quite con- stant regardless of other factors (as described in more detail in the correlation analysis). Therefore, we focused on the prediction of (i) the time from cut to stitch. Following, we will refer to this duration as the prediction target variable CS_time.
INDEPENDENT VARIABLES AND DATA PREPROCESSING Within the raw data set there were 52 independent variables that were extra- cted from the HIS. Some procedures have been filtered because they were not relevant or non-representative, such as needle fasciotomies since they were not conducted within the OR.
One hypothesis was, that the experience of the individual surgeon condu- cting surgery is an impactful predictor for surgery duration. Therefore, we set up an additional variable “doc_class” containing four categories:
highly experienced surgeons
experienced surgeons
medical specialists at the beginning of training
rotational physicians.
Further important variables tested in different models were the operation type “ops”, the main diagnosis “icd” and the weekday variable “wtag”. The categorical variable ops identifies 77 unique operation types within the data set. The variable icd has 92 unique occurrences in the data set (and 46 missing rows). The categorical variable wtag contains codes for workdays Monday through Friday.
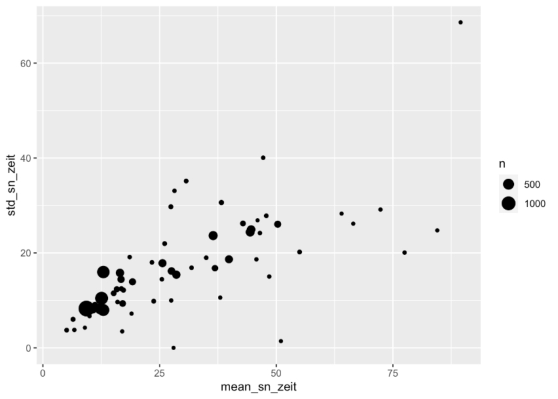
STATISTICAL ANALYSIS OF SURGERY DURATION To gain a better understanding of CS_time across different operation types, we conducted a statistical analysis across different operation types. The rati- onale was, that operation type might also be a strong predictor for CS_time. Also, there might be operation types with a lower deviation, that might be good to predict by using averages. In Figure 1, the standard deviation also increases with increasing mean. However, this “clustering” in mean and
A Machine Learning Approach for Optimizing Waiting Times 3
Figure 1: Mean (x) and the standard deviation (y) of CS_time for each operation type (shown as a dot). Size resembles number of operations of a particular type.
standard deviation did not appear to be purposeful for creating a new vari- able (i.e., cluster), since all operation categories were evenly distributed for scheduling operations.
CORRELATION ANALYSIS AND DATA RELATIONSHIPS Since the overall data set is predominately categorical, correlation analysis has initially focused on finding correlations and strong predictors on the existing numerical data available, i.e., patient’s age and changing time betw- een surgeries. One analysis that we conducted was correlating the patients’ age with CS_time, grouping for each operation type. The overall correla- tions showed no strong correlations between age and duration of surgery. There were some correlating outliers, but those were not considered due to the small sample size of the operation type. Furthermore, considering groups by doc_class (so, surgeon experience) showed no strong correlations between age and CS_time.
An additional aspect was the correlation between CS_time and “changing time”: the time for preparation before an operation and follow-up work after the operation has ended. Here it showed, that regardless of the CS_time, the changing time has been quite constant (in our data roughly 23 minutes from stitch until next patient’s cut), so also no correlation in this regard.
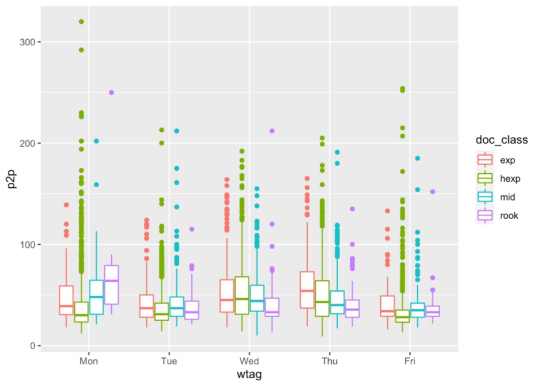
We regarded the relationship between day of the week and duration of the operation. As shown in Figure 2, the boxplot shows the distribution by day of the week and experience level. There are indications that the weekday vari- able “wtag” holds information, we see that e.g., surgery durations tend to be shorter on Fridays. However, we cannot confidently say that this effect comes from surgeries taking less time or that shorter operations were scheduled on Fridays in the historic data.
Figure 2: Patient to patient times (CS_time plus “changing time”) by weekday and surgeon experience.
REGRESSION ANALYSIS AND MODEL COMPARISON In this section we present the results of training and evaluating different regression models and feature sets to predict the operation duration CS_time. For this purpose, we chose to evaluate different variants of linear regres- sion models and gradient boosting decision trees. The overall data has been split into a training (75%) and test set (25%) with stratified sampling on the target variable CS_time, to ensure representative samples in both sets. The models have been evaluated with the test set using the root mean square error (RMSE) as an overall quality measure.
The most successful approach has been the combination of a gradient boo- sting tree model XGBoost (Chen, 2016) with the extended feature set. We fit a linear regression model as a simple initial benchmark. From existing lite- rature, there have been previous reports of successfully applying gradient boosting trees on the problem domain of surgery duration prediction (see Martinez, 2021 and Chu, 2022).
Table 1. Overview of different models and test results.
Table available in the original PDF paper.
Model Feature Set RMSE
14.20
Linear Regression (Benchmark) wtag, ops und doc_class (i.e., restricted features)
15.63
Linear Regression extended features 17.25 Linear Regression Multiple correspondence analysis (MCA)– 4 components XGBoost ops only 14.87 XGBoost restricted features 14.14 XGBoost extended features 11.52
A Machine Learning Approach for Optimizing Waiting Times 5
INTERPRETATION OF REGRESSION RESULTS Within the table we see the results on both restricted (wtag, ops and doc_class) as well as the “all features” extended feature set. In contrast to the overall 52 variable set of the HIS, the extended feature set only contains infor- mation on the sex, age of the patient, as well as further categorical diagnosis data and information about in-patient (stationary) or out-patient treatment.
Our benchmark model consisted of a linear model containing a restricted feature set of ops, doc_class and wtag. It provided quite satisfactory results, which could only be improved by a XGBoost model for the same feature set. However, the overall best performing model contained the extended feature set. There, the XGBoost model performed best whereas the linear model per- formed poorly with the extended setting. This might be indicating nonlinear relationships within the extended feature set, that could not be captured by the linear model. Since most features have been categorical, the linear model might also have had more difficulties deriving the relevant interrelationships than the XGBoost model.
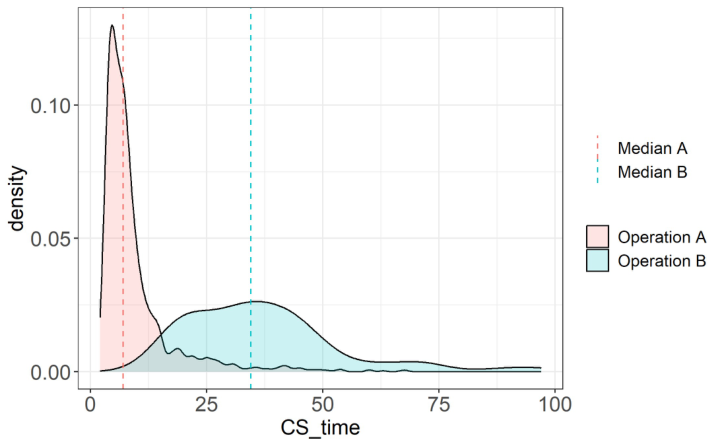
DISTRIBUTIONS FOR CATEGORICAL FEATURE COMBINATIONS While predictions of surgery durations already proved practical for obtaining average surgery durations, considering the distribution of operation leng- ths seemed relevant for further investigations. Distributions depending on category-sets (i.e., type of operation “ops”, weekday “wtag” and surgeon experience “doc_class”) have been analyzed. As can be seen in Figure 3, the differences between CS_time distributions for different operation types can be quite striking. Since we are dealing (for the restricted data set) only with
Figure 3: Density plots for distributions of two chosen operation “ops” types on CS_time.
categorical data, we concluded that for each possible categorical combina- tion, predictions of an arbitrary regression model will likely be equal (or at least near) the mean of the distribution – since this will resemble a kind of majority vote for the expected duration.
QUANTILE-BASED BIAS FOR BALANCING WAITING TIMES For the quantile-based approach, the main idea is the following: if we look at the distributions in Figure 3, and take the median as the prediction, the prediction overestimates the surgery-duration in as many cases as it unde- restimates it. If we systematically shorten the predicted duration (quantile < 0.5), the planning will tend to undervalue the actual length. This results in more cases for the patient needing to wait for ongoing OPs to be com- pleted. On the other hand, if we overestimate the duration of the planned surgery (quantile >0.5), this will lead to more cases that the physician needs to wait for a planned patient not being ready yet, because the model will overestimate.
Therefore, we have a way to systematically overestimate or underestimate surgery durations by assuming higher or lower quantile predictions rather than the median. This allows us to gradually control the probabilities of wai- ting time being more on the part of the patient or more on the part of the surgeon. This is a major advantage in contrast to just planning for one likely operation duration.
Concluding, if our overall goal is to keep the utilization of the OR as high as possible (while keeping patients’ waiting times to a tolerable level), we can influence the bias gradually in favor of the surgeons and slightly underestimate durations for planning.
CONSIDERATIONS ON SAMPLING SIZE For the quantile-based bias, we need a distribution for each possible com- bination of restricted categories used (ops, doc_class and wtag). For some combinations there is a larger sample size than for less frequent combinations, occurring only seldomly in the data. For our approach, we have used empiri- cal quantiles rather than a fitted distribution function. Thus, the influencing durations are invariably rooted in real-life samples.
COMPUTATIONAL SIMULATION To test the effects of different prediction strategies on the actual planning outcome, we set up a computational simulation of typical operation days at the hospital. The routine simulates multiple days, weeks, and months of planning data. The surgeries and their parameters are sampled according to the empirical distributions in the historical data. These data are calculated for multiple days. For the generation of simulated samples, again, empirical sampling was chosen.
To constrain the complexity of the simulation, some assumptions were made. For example, the number of operations to be performed per half- day was set to a fixed number of five, OR changing times were assumed as
A Machine Learning Approach for Optimizing Waiting Times 7
constant and only one break time (lunch break) during the day has been con- sidered. The simulation ran through a sampling period of 250 working days to generate usable data in sufficient numbers and to allow for a comparison between the different strategies.
SIMULATION RESULTS Overall, Table 2 shows the results with respect to the different predi- ctors and strategies. Average waiting time refers to the waiting time for a single operation. Percentage of waiting times below three minutes refers to the percentage share, considering all surgeries of the simulated 250 days. The XGBoost model takes the prediction from the best performing regres- sion model for its predicted surgery duration. We see that the overall sum of waiting time of surgeons and patients is comparatively low. For the pro- portion of surgeons and patients who wait less than three minutes, we see a more balanced result than for the other predictors. Used in this way, the model seems to try to reach an overall minimum of waiting time across both patients and doctors.
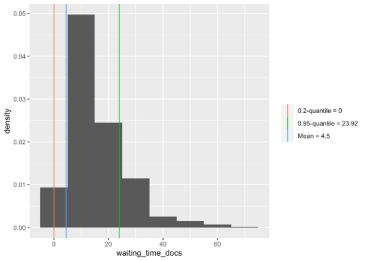
The predictor of Quantile-Bias Q0.1 uses the distribution for the sampled categorical feature combinations (ops, doc_class, wtag with corresponding SC_time) as a basis. Here, the 0.1-Quantile is taken as the predictor - that is a biased prediction in which physicians will have a 10% chance of having to wait vs. a 90% chance of patients. We see that the weights have been shifted to the advantage of doctors. Surgeons need to wait three minutes or less in just under 80% of the cases. For patients, this number is roughly 27%. The average waiting time increases dramatically for the patients to over 33 minutes. The mixed Mixed (XGB + Q0.05) approach combines the XGBoost model with the quantile bias Q0.05. To achieve the presented results, the Q0.05 quan- tile (i.e., a very strong preference for the doctors) was used. The predictions of both models are weighted equally. The distribution of waiting times for physicians and patients can be seen in Figure 4. We see a more balanced picture than with the pure quantile approach. We have a comparatively low waiting time on the part of doctors and a high percentage of less than three minutes of surgeon waiting time. At the same time, we have much better values for patients, which can be regarded as a more balanced and desirable overall result.
Table 2. Simulation results by different predictors.
Table available in the original PDF paper.
Predictor Avg. wait time Doctors
Avg. wait time Patients
Pct. Doctors waiting < 3 min
Pct. Patients waiting < 3 min XGBoost Model 7.90 min 21.74 min 63.12% 45.96% Quantile-Bias Q0.1 3.88 min 33.26 min 79.60% 27.40% Mixed (XGB + Q0.05) 4.55 min 26.07 min 71.44% 37.88%
Figure 4: Waiting time distribution of the mixed (XGB + Q0.05) approach in minutes for physicians (left) and patients (right).
DISCUSSION OF SIMULATION RESULTS As the results have indicated, the quantile-based approach does offer a way to influence waiting probabilities either in favor of patients or the medical personnel and OR utilization. The mixture of the XGBoost model with the quantile method has shown promise and we think that adjustments for the planning process are very feasible using the approach. Additionally, the quantile method itself is explanatory and can provide indicators about the distribution of different operations that can be discussed and interpreted. For each influencing decision, real life samples are the basis and can be regarded. Explanatory factors will positively influence user’s acceptance and trust in such a system (Shin, 2021), which is especially important for the medical domain.
The simulation allows for facilitated testing of different strategies over extended time periods. It enables a pre-selection of the quantile bias parame- ters. This can help to determine practical considerations in advance. Lastly, economical calculations might also be facilitated by extrapolating simulation results.
However, there were also some limitations. The quantile method only works well for sufficient sampling data (as is the cases with other models as well). In the case of extraordinary events, the validity of the estimates may be limited. Furthermore, OR change times or staff breaks were only consi- dered rudimentarily in the simulation. These could possibly lead to effects on buffering or amplifying waiting times during the day that were not yet accounted for.
CONCLUSION OF THE APPROACH AND FURTHER WORK In conclusion, we can say that tree-based regression models such as XGBo- ost provide reliable results for structured categorical data and the prediction of operation durations. However, we have seen during our research that it is not only the best overall performing model, but the prediction that can easily resemble and adjust to real-world requirements that is vital. With the mixed quantile model, we have a way to tune trained models towards biasing
A Machine Learning Approach for Optimizing Waiting Times 9
patients’ or surgeons’ waiting time and tune them to the present efficiency needs in a hospital setting. Moreover, the mixed bias approach adds these considerations in an understandable and adjustable way and with reasonable defaults. We hope that the approach that can contribute to a more considering and balanced planning process in the future.
For further work, we see possible expansions of the simulation to include more break times during the day. This would imply that waiting times would not necessarily add up across multiple ORs and might provide a more reali- stic picture of the day-to-day practice. However, this would also increase the complexity and decrease portability of such a simulation. Another idea is to use an additional ML model such as a Bayesian neural network (see Jospin, 2020) to predict confidence intervals and to make the approach even more usable. Medical personnel would have a confidence estimation which would allow for even more assertive planning.
ONGOING FIELD TESTS Starting in October 2022, daily operation scheduling at the Vulpius hand surgery operation center in Bad Rappenau has been supported with a trained regression model. In the initial implementation step, the model consisted of a trained XGBoost regressor to forecast the surgery durations CS_time. To integrate with the existing planning process, forecast and scheduling were combined in a manual planning step.
ADDITIONAL NATURAL LANGUAGE PROCESSING Since the operation type “ops” variable used in the historical data analysis is only available after the execution of an operation, an additional processing step needed to be performed for the field tests. This step involved natural language processing (NLP) of a manual operation description which can be accessed a priori. This text is being preprocessed (e.g., put in lower case, stop word removal, tokenization), then vectorized using the term frequency– inverse document frequency (tf-idf). This vector is then used instead of the “icd” (main diagnosis) and “ops” information which is only available at a later stage.
FIELD TEST RESULTS The field tests allowed to determine how scheduling based on the regression model affects waiting time and the utilization of the surgery center. In the validation period from October 2022 until January 2023, a reduction in ove- rall waiting time could be detected: the median waiting time decreased by 31 minutes for stationary patients and by 24 minutes for outpatients. The waiting time for the surgeons did not increase. The deviation between predi- cted (patient to patient) surgery durations and the measured data has been at RMSE of 12.35, which is in line with the best regression model results. It showed that the additional NLP process step yielded the relevant information towards operation type and main diagnosis. Even more, this shows that the
model can generalize well enough to be applied to a real-world live setting and showed no indications of overfitting.
A detailed error analysis revealed an accumulation of estimation outliers for radius fractures. As a result, the text entries for this fracture type are being improved to a stricter three-level scheme to include explicit keywords for extraarticular, intraarticular and double plate surgeries. The resulting effects on the error rate may be measured accurately at a later stage of the evaluation.
The new scheduling approach was perceived very positively by employees and medical staff. Subjectively, they noticed an improved forecast, less delays and appreciate daily use the prediction model.
ACKNOWLEDGEMENT
The research was supported by the Ministry of Economic Affairs, Labour, and Tourism Baden-Wuerttemberg within the project “KI-Fortschrittszentrum Lernende Systeme und Kognitive Robotik”.
REFERENCES
Chen, T., & Guestrin, C. (2016). XGBoost: A Scalable Tree Boosting System. In Proceedings of the 22nd ACM SIGKDD International Conference on Knowledge Discovery and Data Mining (pp. 785–794). New York, NY, USA: ACM. https: //doi.org/10.1145/2939672.2939785 Childers, Christopher P., and Melinda Maggard-Gibbons. “Understanding costs of
care in the operating room.” JAMA surgery 153.4 (2018): e176233-e176233. Chu, J., Hsieh, C. H., Shih, Y. N., Wu, C. C., Singaravelan, A., Hung, L. P., & Hsu, J. L. (2022, August). Operating Room Usage Time Estimation with Machine Learning Models. In Healthcare (Vol. 10, No. 8, p. 1518). MDPI. Huang, C. C., Lai, J., Cho, D. Y., & Yu, J. (2020). A machine learning study to
improve surgical case duration prediction. Jospin, L. V., Buntine, W., Boussaid, F., Laga, H., & Bennamoun, M. Hands-on Bayesian Neural Networks—A Tutorial for Deep Learning Users. arXiv 2020. arXiv preprint arXiv:2007.06823. Martinez, O., Martinez, C., Parra, C. A., Rugeles, S., & Suarez, D. R. (2021). Mach-
ine learning for surgical time prediction. Computer Methods and Programs in Biomedicine, 208, 106220. May, J. H., Spangler, W. E., Strum, D. P. and Vargas, L. G. (2011), The Surgical Scheduling Problem: Current Research and Future Opportunities. Production and Operations Management, 20: 392–405. https://doi.org/10.1111/j.1937-5956. 2011.01221.x Rothstein, D. H., & Raval, M. V. (2018, April). Operating room efficiency. In
Seminars in Pediatric Surgery (Vol. 27, No. 2, pp. 79-85). WB Saunders. Shin, D. (2021). The effects of explainability and causability on perception, trust, and acceptance: Implications for explainable AI. International Journal of Human- Computer Studies, 146, 102551.
LISTED IN THE AHFE DIGITAL BOOKSTORE CATALOGUE
Explore the complete digital volume
Artificial Intelligence and Social Computing
Read this individual research paper free through the original publisher, or explore the full digital proceedings book.
ISBN 978-1-958651-48-3
Explore this ISBN in the AHFE Bookstore ↗Listed in the July 2026 bookstore catalogue; search by ISBN to confirm current availability · Digital book purchase optional