Luciana Armijos, Isaac Cano, Johanna Fonseca, Nancy Santillán, Ruth Jimbo-Sotomayor, María F. Rivadeneira, Xavier Sánchez, Carmenza Sevilla, Betzabé Tello, Luis Vivas, Iván Dueñas-Espín (2022). Development of a web-based tool –The Score Bebé ®– for enhancing neonatal risk stratification: A nationwide retrospective study. In: Healthcare and Medical Devices. AHFE Open Access, vol. 51, pp. 83–90. https://doi.org/10.54941/ahfe1002102
1 Instituto de Salud Pública, Programa de Postgrado en Medicina Familiar y Comunitaria, Facultad de Medicina, Pontificia Universidad Católica del Ecuador (PUCE), Quito, Ecuador; Centro de Investigación para la Salud en Latinoamérica (CISeAL), Ecuador ↗
2 Hospital Clínic de Barcelona, Institut d’Investigacions Biomèdiques August Pi i Sunyer (IDIBAPS), Universitat de Barcelona (UB), Barcelona, Spain ↗
3 Instituto de Salud Pública, Programa de Postgrado en Medicina Familiar y Comunitaria, Facultad de Medicina, Pontificia Universidad Católica del Ecuador (PUCE), Quito, Ecuador ↗
Background: In Ecuador, the neonatal mortality rate has increased from 4.1 to 6.0 per 1000 live births between 2014 and 2019. We aimed to develop and validate a health risk assessment tool for predicting neonatal mortality and to reach a nationwide consensus on stratified management. Methods: We retrospectively analyzed all neonatal deaths registered by the Ministry of Public Health between 2014 and 2017 in Ecuador. We developed a health risk assessment tool by using the information of deceased neonates between 2014 and 2016, and subsequently validated it using the information of deceased neonates in 2017. Several perinatal predictors were tested. The score was qualitatively refined by ~70 healthcare professionals in five Ecuadorian cities, and it was transformed into a web-based calculator with stratified suggestions of care. Results: Survival estimates differed significantly across the risk bands. The resulting Score Bebé® is available at https://scorebebe.com/ and includes stratified suggestions for care.
The neonatal mortality rate in Latin America declined from 23 to 9 deaths per 1000 live births between 1990 and 2020 (UNICEF, 2020). Neverthe- less, the proportion of neonatal mortality in child mortality increased from 40.7% to 52% since 2014, making it an essential public health issue. Accor- ding to the Ecuadorian National Institute of Statistics and Censuses, in 2019 the neonatal mortality rate was 6.0 per 1000 live births, which represents an increase of 0.3 neonatal deaths per 1000 live births per year since 2014 (Instituto Nacional de Estadísticas y Censos, 2021). This calls for urgent and
further action in neonatal care in Ecuador. Despite the introduction of inno- vative strategies in the field of neonatal care to provide integrated care for this vulnerable population (Dorling, Field and Manktelow, 2005), there is a lack of easily-applicable risk assessment tools for newborns in primary or secondary care. To our knowledge, no neonatal risk assessment tools have been adapted or validated in contexts similar to the Ecuadorian one. With this background, we predict that several prenatal, natal, and neonatal chara- cteristics could be used to build an accurate neonatal mortality risk prediction tool. As a secondary objective, we aimed to reach a nationwide consensus on stratified management of neonates across the risk bands obtained from the developed tool.
METHODS
Study Design Mixed method study. This was a retrospective survival analysis that helped identify predictors of neonatal mortality. We then developed a risk predi- ction tool, a score, using the β-coefficients from the model that was validated internally and externally. Furthermore, we performed several DELPHI sessi- ons to identify appropriate neonatal management interventions for each risk stratum (identified by the score) by considering the expertise of approxima- tely 70 healthcare workers from five Ecuadorian cities. Our main outcome was survival time, which was calculated from the date and hour of death minus the date and hour of birth. Survival time was categorized into several binomial outcomes (before 24 hours, 48 hours, and 15 days).
Population We analyzed a neonatal mortality database that included all neonates that were registered by the Ministry of Public Health of Ecuador between January 2014 and September 2017.
The Database – Derivation and Validation Databases The epidemiologist in each healthcare facility in which a neonate dies, systematically reports the complete information about the prenatal, natal, maternal, and postnatal characteristics of each neonate by filling in a form. This process is performed up to 24 hours after the neonatal death occurs. An epidemiologist is present in each political zone in the country who oversees the veracity and congruence of the information and settles any doubts with the particular health establishment in which the death occurred.
The database was divided into a development cohort that included all neo- natal deaths registered between January 2014 and December 2016, and a validation cohort that included all deaths registered from January to Septem- ber 2017. The development cohort included 2340 neonatal deaths, and the validation cohort included 769 neonatal deaths. We analyzed the whole CIE- 10 diagnoses and causes of death of each neonate, grouping the pathologies in 19 mutually-exclusive groups of comorbidities, using the CIE-10 hierarchical
Development of a Web-Based Tool–The Score Bebé ® 85
categories for grouping. We then conducted a workshop with a neonatolo- gist, a pediatrician, and three general practitioners to optimize the number of groups of comorbidities by employing clinical and statistical criteria. Finally, we grouped the comorbidities into five groups: (i) asphyxia-related disorders, (ii) malformations, (iii) prematurity-related disorders, (iv) infectious diseases, and (v) other diseases that were not previously classified.
Statistical Analysis We developed a univariate description of explanatory variables in the first part of the study, followed by a bivariate analysis of neonatal mortality from the derivation database. Furthermore, we performed multivariate Cox pro- portional hazards models. We started by building crude models between one explanatory variable and survival time, which led to the development of a saturated Cox proportional-hazard model that included all the variables that were at a p-value equal to or below 0.25 in the bivariate models. Our satu- rated model also included variables that did not meet the cutting point but were clinically relevant according to the researchers’ expertise. Subsequently, we built a parsimonious model using a one-to-one stepwise backward vari- able reduction from the saturated model. The saturated and parsimonious models were compared using the likelihood ratio test, and the final model was chosen according to the p-value of the test. When the final model was selected, we diagnosed our model by testing proportional hazards and the overall goodness of fit. The diagnostics for the Cox proportional hazards model were developed through a test of proportional hazards and goodness of fit. When evaluating the goodness of fit through the Cox-Snell residuals graph, we can visualize an almost 45-degree angle in the slope, confirming the adequacy of the model. We examined any possible interactions between the included variables. We also performed a sensitivity analysis by excluding extreme pre-term and post-term neonates.
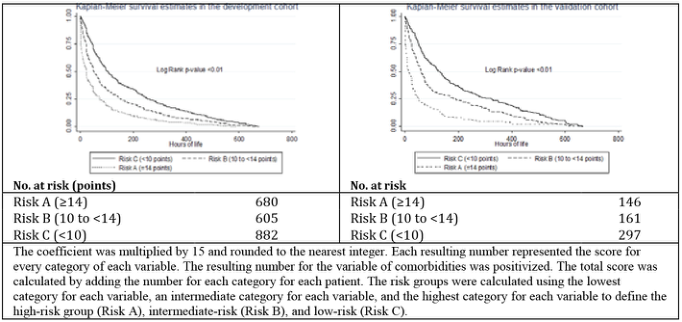
Development of the Alpha Draft Score Further, the β-coefficients from the final model were used to create a risk score–the alpha draft score. This was done by assigning a specific weight to each predictor according to the coefficient, multiplying it by 15, and then rounding that number to the nearest integer. The resulting number for the variable of comorbidities was positivized. The total score was calculated by adding the value of each variable for each patient. Using the derivation data- base, the total score was divided into three tertiles, and the obtained cut-offs were then used to calculate Kaplan-Meier estimates in the derivation as well as validation databases to illustrate the difference in survival among the three risk groups. Finally, we assessed the performance of our obtained risk score in both datasets (derivation and validation databases). We assessed internal and external validity using the bootstrapping technique and the area under the receiver operating curve (ROC). A bootstrap analysis with 1000 simulations was performed. The development and validation of our model complied with the Transparent Reporting of a Multivariable Prediction Model for Individual Prognosis or Diagnosis (TRIPOD) checklist requirements. We considered that
there were statistically significant differences when the p-value was <0.05. All analyses were performed using Stata 16.1 (Statistical Software Stata: Release 16.1 College Station, TX: StataCorp LP).
Building a Web-based Tool for Neonatal Risk Assessment in Ecuador To build an operative web-based tool for neonatal risk assessment at different levels of care in Ecuador, we conducted two activities with healthcare profes- sionals: (i) a set of workshops for testing and refining the preliminary score, and (ii) DELPHI sessions to reach an agreement set of stratified interventions for neonatal care per risk band. First, we performed five workshops to test the use of the alpha draft of the score with ~70 healthcare professionals from five cities in the three geographical Ecuadorian regions. The professionals included family physicians, pediatricians, neonatologists, neonatal care nur- ses, and primary healthcare technicians. We presented the alpha draft score and performed a survey to evaluate its use at different healthcare levels. Other potential predictors that were not included in the modelling (given the lack of information about them) were presented to the professionals. In that regard, and to build a consistent instrument at the operative level, we drew a causal diagram to consider the lack of potentially important unmeasured variables; the diagram was based on the Integrated Management of Childhood Illness (IMCI) proceedings (Marchand et al., 2018). These variables were ranked on a Likert scale. Selected variables were included in the final web-based tool as two main groups of variables: (i) conditions of imminent risk of death and (ii) modifiers of risk. Finally, we included the stratified strategies of neonatal care into the process of the web-based tool, suitable for use by healthcare workers. We focused on its functionalities, allowing the user to: (i) include individual characteristics of prenatal, natal, and neonatal conditions, (ii) check each neo- nate risk variable, and (iii) obtain a detailed report of the characteristics of the neonate, their risk score, and stratified management suggestions according to national current regulations (Marchand et al., 2018). The resulting tool was transformed into a web-based calculator with stratified care suggestions.
RESULTS
The characteristics of the neonates in the derivation database are listed in Table 1. It was made up of 2340 deceased neonates that were born at a median of 32 weeks of gestation (P25:28 to P75:37), with a median weight at birth of 1400 (P25:888 to P75: 2400) g, and a median centile of weight for gestational age of 28.5 (P25:7.8 to P75:60.6) (Table 1). The most prevalent disorder was asphyxia (30.1%).
The final model was the parsimonious model (Table 1), which included gestational age at birth, weight at birth, weight for gestational age centile, Apgar score at 5 minutes, type of delivery, and comorbidities. The final estimates of the multivariate Cox proportional hazards model were transfor- med into scores. Only those variables that were statistically significant in the model were included in the score. The remaining variables demonstrated good prediction ability of mortality at the different time cut-offs established (before 24 hours, 48 hours, and 15 days). For external validation, we used the
Development of a Web-Based Tool–The Score Bebé ® 87
Table 1. Population characteristics (n = 2340) and crude and adjusted associations of potential prognostic of neonatal death <24h in the development cohort.
Table available in the original PDF paper.
Characteristics* All patients Crude hazard
p-value Adjusted hazard p-value
n (%) or ratio (95% IC) P50 (P25 to P75)
ratio (Parsimonious model) (95% IC)
572 (24.4) 1 - 1 -
Sex Male (reference) 1.191 (50.9) 1 - - - Female 1.149 (49.1) 0.9 (0.9 to 1.1) 0.87 - - Gestational age 32 (28 to 37) Extremely preterm (<28 weeks, reference) 548 (23.4) 0.7 (0.6 to 0.8) <0.01 0.9 (0.7 to 1.0) 0.06 Very preterm (28 to <32 weeks)
610 (26.1) 0.7 (0.6 to 0.8) <0.01 0.8 (0.7 to 1.0) 0.06
Moderate preterm (32 to <37 weeks)
319 (13.6) 0.7 (0.6 to 0.8) <0.01 0.8 (0.6 to 0.9) 0.04
Early term (37 to <39 weeks)
226 (9.7) 0.7 (0.6 to 0.9) <0.01 0.8 (0.6 to 1.0) 0.09
Full term (39 to <41 weeks)
1743 (74.5) 1 - 1 -
Post term (≥41 weeks) 45 (1.9) 0.8 (0.6 to 1.1) 0.1 0.9 (0.6 to 1.4) 0.73 Birth weight 1400 (888 to 2400) <750 g (reference) 360 (15.6) 1 - 1 - 750 a <1000 g 379 (16.4) 0.7 (0.6 to 0.9) <0.01 0.8 (0.7 to 0.9) 0.02 1000 a <1500 g 492 (21.2) 0.7 (0.6 to 0.8) <0.01 0.8 (0.7 to 0.9) <0.01 1500 a <2500 g 542 (23.4) 0.7 (0.6 to 0.8) <0.01 0.9 (0.7 to 1.1) 0.23 2500 a <4000 g 521 (22.5) 0.7 (0.6 to 0.8) <0.01 0.9 (0.7 to 1.2) 0.49 ≥4000 g 21 (0.9) 0.6 (0.4 to 0.9) 0.03 0.8 (0.5 to 1.3) 0.38 Birth weight centile** 28.5 (7.8 to 60.6) 5th to 95th centile (reference)
1027 (46.7) 1 - 1
<5th centile 483 (20.6) 0.8 (0.7 to 0.9) <0.01 1.1 (1.0 to 1.3) 0.05 >95th centile 114 (4.9) 1.4 (1.2 to 1.7) <0.01 1.0 (0.8 to 1.2) 0.65 Apgar at 5’ 6 (4 to 8) Reassuring (7 to 10, reference)
587 (25.1) 1 - 1 -
Moderately (4 to 6) 680 (30.9) 1.2 (1.1 to 1.3) <0.01 1.2 (1.1 to 1.4) <0.01 Low (0 to 3) 493 (22.4) 2.3 (2.1 to 2.6) <0.01 2.3 (2.0 to 2.6) <0.01 Type of delivery C-section (reference) 1742 (56.9) 1 - 1 - Vaginal delivery 1144 (37.4) 1.0 (0.9 to 1.1) 0.12 1.1 (1.0 to 1.4) 0.22 Dystocic delivery 176 (5.8) 1.3 (1.1 to 1.5) 0.01 0.8 (0.7 to 0.9) 0.01 Comorbidities Asphyxia related disorders (reference) 533 (22.8) 0.8 (0.7 to 0.9) <0.01 0.9 (0.8 to 1.1) 0.25 Congenital malformations
704 (30.1) 0.8 (0.7 to 0.9) <0.01 0.9 (0.8 to 0.9) 0.02
Prematurity related disorders Infectious diseases 434 (18.6) 0.5 (0.4 to 0.6) <0.01 0.6 (0.5 to 0.7) <0.01 Any other disease 78 (3.3) 0.6 (0.5 to 0.8) <0.01 0.7 (0.6 to 0.9) 0.03
Table 1. Continued.
Table available in the original PDF paper.
p-value
Crude hazard p-value Adjusted hazard
Characteristics* All patients n (%) or ratio (95% IC)
ratio (Parsimonious model) (95% IC)
P50 (P25 to P75)
Rural/Urban Urban (reference) 1.641 (70.1) 1 - - - Rural 699 (29.9) 1.1 (0.9 to 1.2) 0.11 - - Type of healthcare Public (reference) 1,559 (68.6) 1 - - - Private 715 (31.4) 0.8 (0.7 to 0.9) <0.01 - -
* There were missing data in some variables. ** Calculated by using the Intergrowth 21st equation.
validation database, which was made up of 769 deceased neonates registe- red in 2017. They were born at a median of 32 weeks of gestation (P25:27 to P75:36), with a median weight at birth of 1440 (P25:930 to P75:2360) g, and a median centile of weight for gestational age of 31.7 (P25:9.1 to P75:65.5). Prematurity-related disorders were the most prevalent. The alpha draft score showed a good ability to predict neonatal death before 24 and 48 hours, and a fair ability to predict neonatal death before 15 days of life in both the deve- lopment and validation cohorts. The analysis of the prediction of neonatal death before 24 hours in the development database revealed that the appa- rent ROC area was 0.76 (95% CI: 0.74 to 0.78). The bootstrap indicated an optimism of 0.00007. The internally validated or optimism-corrected ROC area was estimated to be 0.74. The external validation, performed in the vali- dation database for death before 24 hours, showed an apparent ROC area of 0.75 (95% CI: 0.71 to 0.80). The decrease of 0.02 is slightly higher than what was expected (0.00007). It can be seen that the predictive capacity of the score persists even to <72 hours of life. The risk groups were established using the score obtained statistically to define high-risk groups (Risk A: ≥14 points), intermediate-risk (Risk B: 10 to 14 points), and low-risk (Risk C: <10 points). The distribution of neonates for each risk category is presented in Figure 1. Kaplan-Meier curves were developed for both cohorts to illu- strate the difference in survival among the low-risk, intermediate-risk, and high-risk groups.
Qualitative Refinement of the Score and Building the Web-Based Tool: The Score Bebé® Healthcare professionals agreed on the importance of a nationwide imple- mentation to: (i) help improve healthcare for neonates, (ii) improve commu- nication between healthcare facilities, and (iii) facilitate a common language across the country by stratifying neonate risk across standardized bands of risk. The agreed interventions were included in the web-based tool called “The Score Bebé®” (https://scorebebe.com/). The tool was well perceived as a potential contribution toward neonatal care, and it is likely to be succes- sfully implemented in primary and secondary care, where almost 50% of the deceased neonates were attended.
Development of a Web-Based Tool–The Score Bebé ® 89
Figure 1: Kaplan–Meier survival curves for the development cohort (Panel A) and the validation cohort (Panel B), according to the prognostic classification categories.
DISCUSSION AND CONCLUSIONS The resulting risk score, The Score Bebé ®, has a good ability to predict neonatal mortality. The proposed web-based tool has a good acceptance for further external validation and has potential for nationwide implementation, with special emphasis on the neonatal risk assessment of primary and secon- dary care in Ecuador. In line with other studies, we found that gestational age, birth weight, percentile of weight for gestational age, Apgar at 5 minutes, type of delivery, and comorbidities are strong predictors of neonatal death before 24 hours of life (Ahmed and Won, 2017). Therefore, we considered inclu- ding these characteristics into a simple web-based tool for enhancing risk assessment during neonatal care. Although most neonatal risk assessment tools have predictive ability, as measured by the AUC, >0.80 (Houweling et al., 2019) most of them include physiologic measurements and biomar- kers, precluding the possibility of being used in primary or secondary care levels. There is evidence that including physiological measures and biomar- kers substantially improves the predictive ability of neonatal scores (Morse et al., 2015). A strength of our study is the availability of information about neonatal mortality from the entire country, giving us enough sample for split- ting it into the development and validation datasets. In addition to being a statistical model, it includes the assessment of the classificatory power of the model through the qualitative refinement methodology that we implemented. We did not include non-at-risk neonates in the analyses; therefore, it is possi- ble that some predictors could overestimate mortality. Furthermore, we could not test the prediction ability of the score by including laboratory biomarkers as predictors. However, we considered that the data were still valuable as we included all registered deaths at a national level, adding up to a significant number of participants in the retrospective cohort. Even though our included variables are similar to other risk assessment models for neonates, our study varies from other scores in that we did not find a clear gradient in the survival across birth weight categories, which could be related to potential residual
confounding, probably due to the lack of laboratory and physiological mea- sures for neonates. We believe that this limitation is not a circumstance that could invalidate the study, given that the ability to predict in the validation cohort was similar for predicting death <48 and <72 and, even, <15 days of life. The resulting risk score, The Score Bebé ®, has a good ability to pre- dict neonatal mortality. The proposed web-based tool has a good acceptance for further external validation and has potential for nationwide implementa- tion, with special emphasis on the neonatal risk assessment of primary and secondary care in Ecuador.
REFERENCES
Ahmed, M. and Won, Y. (2017) ‘Cross-National Systematic Review of Neonatal Mortality and Postnatal Newborn Care: Special Focus on Pakistan’, Internati- onal Journal of Environmental Research and Public Health, 14(12), p. E1442. doi:10.3390/ijerph14121442. Dorling, J.S., Field, D.J. and Manktelow, B. (2005) ‘Neonatal disease severity scoring
systems’, Archives of Disease in Childhood - Fetal and Neonatal Edition, 90(1), pp. F11–F16. doi:10.1136/adc.2003.048488. Houweling, T.A.J.et al. (2019) ‘A prediction model for neonatal mortality in low- and middle-income countries: an analysis of data from population surveillance sites in India, Nepal and Bangladesh’, International Journal of Epidemiology, 48(1), pp. 186–198. doi:10.1093/ije/dyy194. Instituto Nacional de Estadísticas y Censos (2021) Nacidos Vivos y Defunciones
Fetales |. Available at: https://www.ecuadorencifras.gob.ec/nacidos-vivos-y-defun ciones-fetales/. Marchand, B. et al. (2018) Atención integral a las enfermedades prevalentes de la infancia (AIEPI) clínico. Cuadros de procedimientos. Second. Edited by Ministerio de Salud Pública del Ecuador. Quito-Ecuador: Ministerio de Salud Pública del Ecuador. Morse, S. et al. (2015) ‘A Systematic Review: The Utility of the Revised Ver-
sion of the Score for Neonatal Acute Physiology among Critically Ill Neo- nates’, The Journal of perinatal & neonatal nursing, 29(4), pp. 315–344. doi:10.1097/JPN.0000000000000135. UNICEF (2020) Levels and trends in child mortality. Available at: https://data.unice f.org/resources/levels-and-trends-in-child-mortality/.
LISTED IN THE AHFE DIGITAL BOOKSTORE CATALOGUE
Explore the complete digital volume
Healthcare and Medical Devices
Read this individual research paper free through the original publisher, or explore the full digital proceedings book.
ISBN 978-1-958651-27-8
Explore this ISBN in the AHFE Bookstore ↗Listed in the July 2026 bookstore catalogue; search by ISBN to confirm current availability · Digital book purchase optional