Junkai Shao, Wenzhe Tang, Bingqing Yang, Chengqi Xue (2022). Design of Point Pop-ups with Visual Representation based on Weather Map Interface. In: Intelligent Human Systems Integration (IHSI 2022): Integrating People and Intelligent Systems. AHFE Open Access, vol. 22. https://doi.org/10.54941/ahfe100936
The point pop-ups in the weather map interface are essential for displaying real-time weather information in different geographic environments. However, with the explosive development of multimodal map information, the unfriendly expression of most pop-ups breaks the smooth user experience, which brings great challenges to the visual design of pop-ups. This paper regarded point pop-ups in the Chinese weather map as the research object and discussed the design strategy of pop-ups from four aspects: information capacity, combination type, layout mode, and transparency. By comparing the design schemes of different factor levels, the user's behavior performance in the two groups of experiments was analyzed. The results found that the behavior performance on graphic-text pop-ups was better than text-only ones at the same level. When point pop-ups were distributed in the weather map interface with high density, the operability and readability of comprehensive weather information could be ensured by adjusting the overlapping and transparency.
Intelligent Human Systems Integration (IHSI 2022): Integrating People and Intelligent Systems https://openaccess.cms-conferences.org/#/publications/book/978-1-7923-8988-7
INTRODUCTION
The weather map interface mainly comprises information elements such as geographic environment, dynamic climate, and regional points (Wang et al. 2010; Khamaj & Kang, 2018; Widiaty et al.2018), among which the point pop-ups is essential for displaying real-time weather information in different geographical environments. Through the pop-up windows of multiple regional points, users can analyze and process climate changes in different regions (Kaye et al. 2012; Abdullah et al. 2015). Therefore, a practical design for point pop-ups is the key to ensure that users can effectively perceive and judge the weather situation (Montello, 2009). With the rapid development of GIS information technology, the visual design of map interface has become a research hotspot in recent years. Ooms et al. (2014 ) analyzed users' visual behavior based on the interest region of 2D and 3D grids to understand the impact of different map spatial information on users' reading and understanding process. Vega-Garcia (2012) explored the user's visual cognitive characteristics and proposed visual guidance rules for the map information components. Chen et al. (2000) investigated the graphic classification and symbol structure to develop a set of symbol design software and dynamic link library for the map spatial information. Ren et al. (2020) took the map point information as the research object and discussed the impact of presenting location in GIS map information on user performance. To sum up, current research on map interfaces with different topics focuses on information architecture, scene layout, and functional elements. However, few scholars have studied the visual information design of the weather map interface from the user's operational performance, especially the pop-up window design of regional points. In general, the pop-up window design of map point information must be simple and straightforward to ensure the expected user experience (Kuosmo-nen, 2014). First of all, the most common problem is the lack of uniform standards for the design of point pop-ups. The differentiated representations of pop-ups are likely to cause perception barriers, resulting in erroneous clicks or invalid operations (Wu & Li, 2019). Secondly, with the rapid increase of multimodal map information, the content and layout of point pop-ups gradually conflict with the user's memory rules (Burnham, 2010; Saadé & Otrakji, 2007). Thirdly, pop-ups with a large amount of information need to occupy more interface space, which will occlude the surrounding information and affect users' perception and decision-making on the global map information. Therefore, the scientific and reasonable design for point pop-ups is essential to improve the user's performance in dealing with important information.
METHODS AND MATERIALS
PARTICIPANTS Twenty-five graduate students from Southeast University volunteered to participate in this experiment (13 males, average age 23.60, SD = 2.3274). All participants were
Intelligent Human Systems Integration (IHSI 2022): Integrating People and Intelligent Systems https://openaccess.cms-conferences.org/#/publications/book/978-1-7923-8988-7 physically and mentally healthy and had no color blindness, normal or corrected vision. Before the experiment, the subjects were asked to avoid strenuous exercise to maintain a better mental state and fully understand the experiment content.
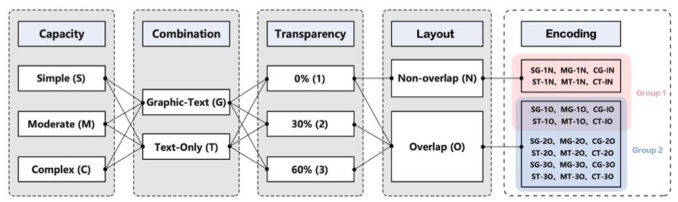
STIMULI The experimental materials were selected from pop-up windows displayed by different point information in the Chinese weather map interface. The information capacity presented by the pop-up window could be divided into three levels: Simple (S), Moderate (M), and Complex (C). The combination type could be divided into two levels: text-only and graphic-text combination. Specifically, the text-only pop- ups displayed information in the form of text, while the graphic-text pop-ups displayed information in the form of a combination of text and graphic. The layout mode of 25 pop-ups was divided into two levels: non-overlapping and overlapping. Non-overlapping layout referred to a 5×5 matrix composed of each pop-up window with an interval of 5mm. Overlapping layout referred to the original 5×5 matrix being reduced to 80% by the same proportion. The transparency of pop-ups was divided into three levels: 0%, 30%, and 60%. The information encoding for pop-ups based on different factor levels was shown in Figure 1.
Figure 1. The information encoding for pop-ups based on different factor levels.
In the first group of experiments, the influence of the three-factor design for pop-ups on participants' behavior was explored, namely information capacity, combination type, and layout form. In the second group of experiments, under the condition of overlapping pop-ups, the influence of information capacity, combination type, and transparency on participants' behavior was explored.
PROCEDURE Based on the hierarchical elicitation approach (HEA), this paper conducted behavioral experiments on the visual representation design of point pop-ups (Yang et al. 2021). The experimental stimulus process was programmed through the E-prime 2.0 platform and presented on a 21-inch LCD screen with a resolution of 1920×1080. In this study, there were 24 kinds of stimulus materials, and each stimulus appeared 6 times randomly. Before the experiment, participants needed ten training trials to
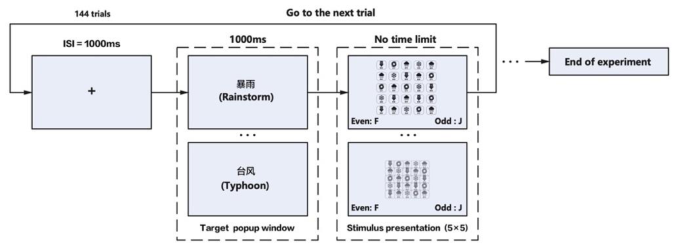
Intelligent Human Systems Integration (IHSI 2022): Integrating People and Intelligent Systems https://openaccess.cms-conferences.org/#/publications/book/978-1-7923-8988-7 familiarize themselves with the entire experimental tasks and operating procedures. In the formal experiment, a cross focus first appeared in the center of the screen to focus the participant's attention, and then the target information to be searched and counted was presented in the center. At this point, participants browsed the 5×5 matrix stimulus material composed of different pop-ups and determined the number of target pop-ups as quickly as possible. If the number of point pop-ups is even, the participant responded by pressing the F key on the keyboard, otherwise pressing the J key, as shown in Figure 2.
Figure 2. Information content and stimulus process for pop-ups.
RESULTS
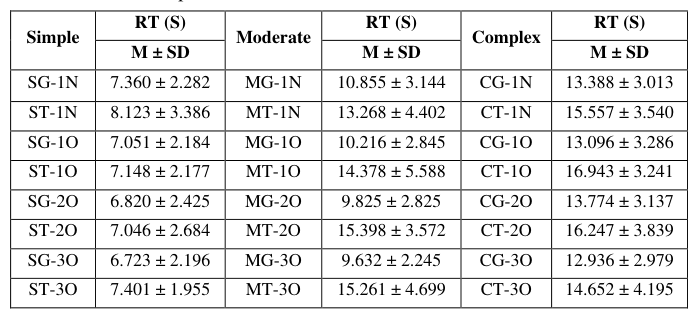
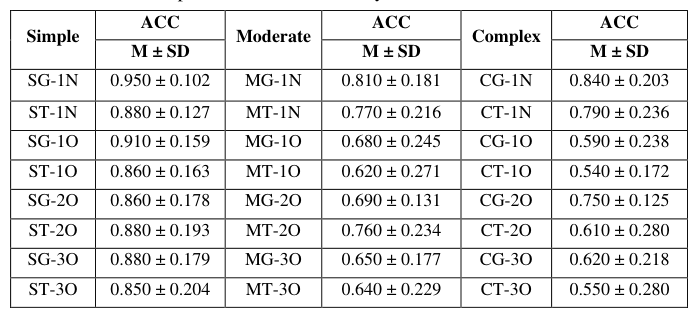
Participants' behavioral data for completing all stimulus tasks (see Table 1 and Table 2), including reaction time (RT) and accuracy (ACC), were collected by E-prime program and statistically analyzed by SPSS 26.0. Repeated-measures analysis of variance (ANOVA) and analysis of means (ANOM) were adopted. For data results that violated the sphericity hypothesis, the Greenhouse-Geisser method was used for correction. Mauchly's test showed that the reaction time (P = 0.292 > 0.05) and accuracy rate (P = 0.502 > 0.05) of the first experiment conformed to the spherical hypothesis. It was found that the three-factor interaction effect among information capacity, combination type, and layout mode was not significant in reaction time [F (2, 48) = 1.860, P = 0.167 > 0.05] and accuracy rate [F (2, 48) = 0.082, P = 0.912 > 0.05]. However, the two-factor interaction effect between information capacity and combination type in reaction time [F (2, 48) = 12.381, P < 0.001, η2 = 0.340] and accuracy rate [F (2, 48) = 13.037, P < 0.001, η2 = 0.337] was significant. In addition, the main effect of information capacity (P < 0.001, η2 = 0.904) and combination type (P < 0.001, η2 = 0.642) was both significant in reaction time. The main effect of information capacity (P < 0.001, η2 = 0.554), combination type (P = 0.005 < 0.05, η2 = 0.281), and layout mode (P < 0.001, η2 = 0.553) was also significant in accuracy rate.
Intelligent Human Systems Integration (IHSI 2022): Integrating People and Intelligent Systems https://openaccess.cms-conferences.org/#/publications/book/978-1-7923-8988-7
Table 1: Descriptive statistics for reaction time under different level factors.Table 2: Descriptive statistics for accuracy rate under different level factors.
Intelligent Human Systems Integration (IHSI 2022): Integrating People and Intelligent Systems https://openaccess.cms-conferences.org/#/publications/book/978-1-7923-8988-7 suggested that at the same level, the user's operational performance in graphic-text type was better than that in text-only type, and the performance in the concise information was better than that on the complex one. Similarly, for the second experiment, the mean analysis of reaction time in the overlapping pop-ups found that the performance in the simple graphic-text type with 60% transparency was the best [SG-3O (M = 6.723, SD = 2.196)], and the complex text-only type with 0% transparency was still the worst [CT-1O (M = 16.943, SD = 3.241)]. The mean analysis of accuracy in the two experiments found that at the same level, participants performed better in non-overlapping pop-ups than in overlapping ones, and better in graphic-text type than in text-only type. For the pop-ups with non-overlapping, participants performed the best in the simple graphic-text type [SG-1N (M = 0.950, SD = 0.102)]. However, for the pop-ups with overlapping, participants performed the worst in the complex text-only type [CT-1O (M = 0.540, SD = 0.172)]. Since this study emphasized the importance of reaction time in behavioral experiments, accuracy could be regarded as a reference for performance evaluation. In addition, the design scheme with a longer reaction time was mainly concentrated in the complex text-only pop-ups with overlapping states (CT-O), where users have the lowest accuracy. The results showed that when users understood the contents of multiple overlapping pop-ups, regardless of whether the pop-ups were processed transparently, the redundant text-only information might increase the user's mental workload, leading to operational errors. The design scheme with the best operational performance was mainly concentrated in the simple pop-ups without transparency (SG-1), indicating that the simplified expression of graphical and textual information semantics could greatly improve the user's cognitive efficiency.
DISCUSSION
Two groups of behavioral experiments found that information capacity and combination type significantly affected participants' behavioral performance, while transparency had no significant effect. In addition, the layout mode had a significant effect on participants' operational accuracy. Whether the pop-ups were overlapped or processed transparently, the simple pop-ups had more advantages in reaction time and accuracy than the same level of other schemes. The findings supported the previous research that graphic-text pop-ups could convey more effective information than text- only ones, especially when the point pop-ups had more information capacity (Kau & Winer, 1987; Klinkenberg, 2008). It should be emphasized that in the interaction process of map interface information, the user's operation accuracy is crucial to the stable performance of the entire system. Therefore, the combination of graphics and text is the best choice, which can help users quickly and accurately understand the multimodal information resources of the map interface. In addition, although there was no significant difference in reaction time between the two layout forms, participants' operation accuracy in non-overlapping pop-ups was significantly higher than that in overlapping pop-ups. The results indicated that the overlapping pop-ups might increase the participant's cognitive load in classifying and
Intelligent Human Systems Integration (IHSI 2022): Integrating People and Intelligent Systems https://openaccess.cms-conferences.org/#/publications/book/978-1-7923-8988-7 identifying information content and reduce their operational performance. The second experiment was expected to improve the user's processing efficiency by adjusting the transparency of the point pop-ups. Although the final results showed that the difference in reaction time and accuracy rate between different levels of transparency was not significant, the mean analysis suggested that transparency processing still indirectly affected the participant's operational performance. For example, participants had the best reaction time in SG-3O scheme (60% transparency) and the highest accuracy in SG-1N scheme (0% transparency). Therefore, when the point pop-ups with high-density distribution appear in the Chinese weather map interface, the transparency and overlapping can be adjusted appropriately to grasp the real-time global information.
The information capacity in pop-ups should be designed to transmit as much important content as possible while ensuring users' cognitive efficiency. Therefore, moderate graphic-text pop-ups can be recommended first. In addition, given the spatiality and timeliness of the point pop-ups with high-density distribution, transparency processing can improve the readability of global information when multiple point pop-ups were overlapping layouts, and the setting range of transparency is 30% ~ 60%. For the visual design of the Chinese weather map interface, designers need to design corresponding pop-ups by comprehensively considering different factors according to the specific interface tasks. Especially in emergencies, priority is given to the pop-up design with faster response time under the premise of ensuring accurate operation.
CONCLUSIONS
According to two behavior experiments in this paper, the four design factors of point pop-ups included information capacity, combination type, layout form, and transparency to analyze the impact on user behavior efficiency. The results showed that graphic-text types carried more information and performed better in reaction time and accuracy than text-only ones at the same level. Moreover, both information capacity and combination type significantly affected the user's reaction time and accuracy. However, transparency had no significant effects on the two behavioral performances, and layout mode had significant effects on the operational accuracy. The research findings provided a certain theoretical basis and reference value for the visual design of point pop-ups in the weather map interface.
ACKNOWLEDGMENTS
The authors would like to gratefully acknowledge the reviewers’ comments. This work was supported jointly by National Natural Science Foundation of China (No. 71871056), Post-graduate Research & Practice Innovation Program of Jiangsu Province (No. SJKY19_0067), Equipment Pre-Research & Ministry of Education of
Intelligent Human Systems Integration (IHSI 2022): Integrating People and Intelligent Systems https://openaccess.cms-conferences.org/#/publications/book/978-1-7923-8988-7
China Joint Fund (6141A020226).
REFERENCES
Abdullah, A., Alshamat, S., Bakhashwain, A., and Aslam, A. (2015), “Automatic text removal and replacement in scanned meteorological thematic maps.” Journal of Computer Sci-ences, 11(5), 772-783. Burnham, B.R. (2010), “Cognitive load modulates attentional capture by color
singletons during effortful visual search.” Acta psychologica, 135(1), 50-58. Cheng, P.G., Gong J.Y., and Sui, H.G. (2000), “Design and implement of map symbol design system in GIS.” Journal of Image and Graphics, 5(12), 1006-1011. Kau, A., and Winer, G.A. (1987), “Incidental learning in young children tested with
words or words plus pictures as stimuli.” Journal of Experimental Child Psychology, 43(3), 359-366. Kaye, N.R., Hartley, A., and Hemming, D. (2012), “Mapping the climate: guidance on appro-priate techniques to map climate variables and their uncertainty.” Geoscientific Model Development, 5(1), 245-256. Khamaj, A., and Kang, Z. (2018), “Usability evaluation of mobile weather hazard
alert appli-cations.” Industrial and Systems Engineering Review, 6(1), 21-40. Klinkenberg, J.M. (2008), “Relationship between text and image (attempt at systematiza-tion).” Slovak Review A Review of World Literature Research, 17(2), 5-28. Kuosmonen, E.L. (2014), “Instructions on a windows Phone 8 application: design
strategies and application principles.” Department of Game Design, Uppsala University. Montello, D.R. (2009), “Cognitive research in GIScience: recent achievements and future prospects.” Geography Compass, 3(5), 1824-1840. Ooms, K., Maeyer, P., and Fack, V. (2014), “Study of the attentive behavior of novice
and expert map users using eye tracking.” Cartography & Geographic Information Science, 41(1), 37-54. Ren, J., Wang, H., and Shao, J. (2020), “Experimental research on geographic information system interface map information layout.” Information Communication Technologies Conference, 108-112. Saadé, R.G., and Otrakji, C.A. (2007), “First impressions last a lifetime: effect of
interface type on disorientation and cognitive load.” Computers in Human Behavior, 23(1), 525-535. Vega-Garcia, C. (2012), “Making maps: a visual guide to map design for GIS (Second edi-tion).” The Photogrammetric Record, 27(139), 389-390. Wang, B., Zhang, L., and Cao, H.Y. (2010), “Human-computer interface design for
simulation of activity-travel patterns. ” Advanced Materials Research, 143-144, 996-1001. Widiaty, I., Riza, L.S., Somantri, L., Abdullah, A.G., and Abdullah, C.U. (2018), “Geographic information system.” Journal of Engineering Science and Technology, 13(7), 1979-1991. Wu, X., and Li, Y. (2019), “An experimental analysis method of visual performance
on the error factors of digital information interface.” International Journal of Pattern Recog-nition and Artificial Intelligence, 34(9), 2055019.
Intelligent Human Systems Integration (IHSI 2022): Integrating People and Intelligent Systems https://openaccess.cms-conferences.org/#/publications/book/978-1-7923-8988-7
Yang, B., Wang, H., and Shao, J. (2021), “Construction method of user mental model in inter-action design.” 4th International Conference on Intelligent Human Systems Integra-tion, 382-387.
Intelligent Human Systems Integration (IHSI 2022): Integrating People and Intelligent Systems https://openaccess.cms-conferences.org/#/publications/book/978-1-7923-8988-7
LISTED IN THE AHFE DIGITAL BOOKSTORE CATALOGUE
Explore the complete digital volume
Intelligent Human Systems Integration (IHSI 2022): Integrating People and Intelligent Systems
Read this individual research paper free through the original publisher, or explore the full digital proceedings book.
ISBN 978-1-7923-8988-7
Explore this ISBN in the AHFE Bookstore ↗Listed in the July 2026 bookstore catalogue; search by ISBN to confirm current availability · Digital book purchase optional