Diego Esquivel-Alvarez, Cesar Postigo-Sanchez, Rosa Salas-Castro, Edgar Ramos-Palomino (2021). Inventory planning and management model to increase the level of service in a telecommunications product distribution company. In: Human Systems Engineering and Design (IHSED2021): Future Trends and Applications. AHFE Open Access, vol. 21. https://doi.org/10.54941/ahfe1001189
Telecommunications product distribution companies have begun to have a low level of service with their clients due to lack of stock and lost sales, these represent 54.13% of the total problems that distributors have. Inventory control plays an important role, since it gives us, in advance, generate an order and the quantity of the product. The objective is to increase the service level of a distribution company, which has the same problems mentioned initially, therefore, inventory management and planning will be implemented focusing on the ABC multicriteria, Forecast in relation to the level of service and EOQ with variable demand to minimize unfinished and / or rejected sales and reduce excess inventory. The research study wants a service level scope of 86.72% by 2019 and 98.31% by 2020.
Human Systems Engineering and Design (IHSED 2021) https://openaccess.cms-conferences.org/#/publications/book/978-1-7923-8987-0
INTRODUCTION
Many distribution and / or trading companies use different strategies to fulfill their orders (Scholz-Reiter, Heger, Meinecke and Bergmann, 2012). Although they do not have the same customer sector, they still have the same concept that they face.
In these years, telecommunications product sales houses in Peru have had a great growth, in 2018, according to MTC-OGCC, more than 13,500 permits for product distribution were registered and a total of 706 sales houses at the same time. End of 2018. This increase in new distribution companies is due to the growth of the telecommunications sector, since this sector has grown both inter-nationally and nationally. According to the National Institute of Statistics and Informatics (INEI), this sector grew by 5.6% based on GDP and according to Osiptel, public and private investment in 2019 grew by 18%, in monetary terms, at the end of 2019, the uvo sector an investment of $ 1,500 MM.
This growth influences companies in this sector to be more demanding both within (workers) and outside (Suppliers) of the company. Due to this, they look for better distributors and / or marketers that offer a high service in terms of qual-ity, (Delivery time, quantity, place, etc.) (Nemtajela and Mbohwa, 2017; Do Rego and De Mesquita, 2015). On the other hand, distributors in Peru are more interested in large clients such as Telefónica, Entel to improve their sales capacity, increase their portfolio, increase profits, improve service level and even reduce costs. However, it does not always turn out as planned, the sales losses are very noticeable due to poor inventory management caused by the demand resulting from misclassification of products and erroneous calculations of the most efficient economic lot (EOQ) (Mehdizadeh, 2020; Pando, San-José, García-Laguna and Sicilia, 2018; Zhu, Dekker, Van Jaarsveld, Renjie and Koning, 2017). For this reason, these distributors are forced to store a large number of articles that have an erroneous demand in order not to lose the contracts of large companies, which despite having these problems generates more income than wholesalers and re-tailers (Roda, Macchi, Fumagalli and Viveros, 2014).
STATE OF THE ART Inventory management (IM)
Over the years, telecommunications product distribution companies have been in constant change due to the evolution of technology (Scholz-Reiter et al., 2012; Salam., Panahifar and Byrne, 2020), so the supply chain that these companies manage should focus more on their inventories, because many of these lack a production system, so managing inventories is essential to obtain better income (Behrouzi and Wong, 2011; Yang, Xiao and Shen, 2009).
Human Systems Engineering and Design (IHSED 2021) https://openaccess.cms-conferences.org/#/publications/book/978-1-7923-8987-0
ABC Multicriteria. There is a difficulty when it comes to managing inventories, on the one hand, the uncertain demand, and on the other, the environment, causing variables to arise that influence an efficient classification (Scholz-Reiter et al., 2012; Nemtajela and Mbohwa, 2017). Given the surrounding situation, the use of criteria will allow a more optimal inventory classification.
Demand estimation. Better forecasting of consumer demands helps retailers to order more accurately from the distributor (Pando et al., 2018). However, the retailer does not send the same demands received by consumers to the distributor as a direct order because the retailer is responsible for keeping the fast moving and some medium moving spare parts in the warehouse to shorten the delivery time to obtain consumer satisfaction and decrease. backorder or lost sales costs.
EOQ with variable demand. An EOQ model taking into account the price, the demand and the deteriorated or past stock, I deepened the study in the inventories, leading to the conclusion that under these variables the inventory model and the solution procedure can be obtained or illustrated (Tiwari. Wee and Sarkar, 2017).
Service level The image of companies depends a lot on what their customers say and without a good service control, the company's sales would fall and it would go bankrupt. In other words, increasing the level of customer service in production and inventory control is one of the main objectives of an industry (Ongkicyntia, and Rahardjo, 2018).
Effective service can create an approach to the customer, invisible links, be-cause the products will always be present (Memari, Rahim, Hassan and Ahmad, 2017). Organizations must establish a minimum service level, this will be taken as an objective point (Salam at al., 2020), so that companies can supply them-selves with the current inventory so that the inventory base that they must maintain can be calculated to ensure the availability of the product that satisfies to your client (Behrouzi and Wong, 2011; Yang et al., 2009.
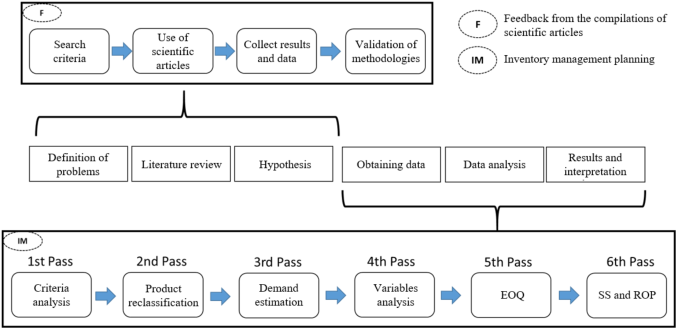
INPUT Already detailed above, the increase in the level of service is very effective in distributors, for this we propose planning and inventory management with the use of quantitative methods. We will focus on the target stock to achieve cost reduction. For this, it is essential to use the ABC Multicriteria classification, in order to obtain the most representative products of the distributor (Mehdizadeh, 2020; Stojanović and Regodić, 2017) and under the results of the non-constant Fore-cast, an EOQ model will be made under the necessary characteristics to request orders from the supplier, replenish the appropriate stock and calculate the Safety Stock (Lagodimos., Skouri,
Human Systems Engineering and Design (IHSED 2021) https://openaccess.cms-conferences.org/#/publications/book/978-1-7923-8987-0
Christou and Chountalas, 2018). See figure 1 for the proposal process.
Figure 1. Supply chain, ABC TELECOM, adapted from Ramos, Pettit, Flanigan, Romero and Huayta (2020); Ng and Chung (2009); Pasandideh, Niaki, and Ahmadi (2018).
MODEL VALIDATION Problems of the case study
The company uses the OTIF indicator to know the level of service that the company has. According to Table 1, the SFR of the most important families, before the contribution, is 85.66%.
Table 1: Calculation of the SFR for the year 2019, Own elaboration Family Total orders Order delivered SFR OTIF
Table available in the original PDF paper.
Jonard 17283 14965 86.59% 78.62% CABLEMATIC 10519 8849 84.12% 74.78% TOTAL 27802 23184 85.66% 77.10% For this article we will use the SLS to measure service efficiency. To measure the level of service under the SLS it is necessary to count the amount of sales without the need for an emergency order, according to the following table it gives us a value of 90.50%. for the Jonard family and 87.15% for the CABLEMATIC family.
Human Systems Engineering and Design (IHSED 2021) https://openaccess.cms-conferences.org/#/publications/book/978-1-7923-8987-0
Table 2: Calculation of sales without discrepancies for the year 2019, Own elaboration
Table available in the original PDF paper.
Month Orders placed Delivery orders Waiting orders % of sale Jonard 14965 13543 114 90.50% CABLEMATIC 8849 7711 1138 87.15% TOTAL 23184 21254 1252 89.25% The sales service level of a Mype of 20 workers focused on distribution must be more than 85%.
Inventory planning results Improvement of the ABC of the company. Under the criteria of the authors Iqbal, and Malzahn (2017) and the criteria table, a new multicriteria ABC was calculated.
Table 3: Multi-criteria classification of families, adapted from Kaabi and Jabeur (2016), Arboleda and Castillo (2017) Family Traditional ABC Multicriterial ABC HYC A C CABLEMATIC A A INNO A B MILLER B A FIS B B JONARD B A FUJIKURA C B BRADY C C YHT C C KLEIN TOOLS C C Demand estimation and inventory replenishment. Based on Kaabi and Jabeur (2016), we will calculate the economic lot according to the policy (r, Q) oriented to a changing demand, the safety stock and the re-order point for the JONARD and CABLEMATIC family
Table available in the original PDF paper.
Table 4: EOQ Calculation, Adapted from Kaabi and Jabeur (2016)
Table available in the original PDF paper.
Unit cost Family Annual demand of order Storage unit cost
Proposed model The proposed model is divided into 2 parts: the 1st part is sales management, which ranges from the sales order by the customer to the delivery of the same and the requirements to the supplier. The 2nd part of the simulation covers the management of inventories and supplies where the time that the products arrive at the warehouse is taken into account either by normal order or emergency order, likewise, periodic reviews are carried out and under the level of the reorder point It is decided if you need to replenish stock and place the required security SS.
Data for simulation To begin with the simulation, the data from tables 4 and 5 will be taken, with these calculated data we will record them in the simulation.
Table 6: Variables for the simulation
Table available in the original PDF paper.
Variables JONARD CABLEMACTIC Safety Stock 37 60 Requested lot 779 633 Inventory 200 150 Reorder Point 382 318 The average inventory is a data provided by the company, since monthly stocks are counted per family. So the final average inventory of each month for JONARD is 200 and for CABLEMATIC it is 150.
Validation results Taking into account the following inventory planning calculations that were made based on what was proposed in the contribution section. A simulation is performed. Taking into account 110 replications, taking into account 8 hours of work per day, 6 days a week and a total of 4 weeks per month, the simulation of 288 days was carried out for both families. The level of service under the use of SLS has increased to 86.85%.
Human Systems Engineering and Design (IHSED 2021) https://openaccess.cms-conferences.org/#/publications/book/978-1-7923-8987-0
We obtain income by reducing the costs covered in order to obtain profitability. On the cost side, these were reduced. According to table 12, Emergency Order costs and other costs and lost sales due to lack of stock are shown.
It was taken as an emergency order unit cost on average for JONARD and CABLEMATIC is $ 3.5. The annual average cost was calculated under the policy (r, Q) with variable demand taken from Nemtajela and Mbohwa, (2017) and Do Rego and De Mesquita (2015).
Table 1. Annual costs under proposed data.
Table available in the original PDF paper.
Family CU ($) Loss on sale Cost Emer. Order Other costs JONARD 9040.88 $.5317.0 $.4501 $.5364 CABLE MATIC 5847.17 $.2641.5 $.3248 $.2150 Based on the proposed data, the income of the most important business families rose, increasing profitability.
The variation in demand oscillates at a value of 0 <α <1 taking from Xu (2017) a distributor of products the Alpha can opt for the values 0.2, 0.3 and 0.4 these calculations of the alpha were obtained by analyzes that the authors carried out.
Table 2. Projected service level for 2020.
Table available in the original PDF paper.
α D(SL) EOQ(SL) SLS 0.2 17358 895 96.31% 0.3 17396 897 95.12% 0.4 17433 896 96.13% Under the alpha value, we observe that the values for the JONARD family, following the forecast prepared, reach a service level greater than 95% for each situation for the year 2020.
Indicators obtained (before and proposed) Our diagnosis based on results is the deficient inventory planning process, due to the lack of classification of products to order from the supplier and the error of the economic batch obtained. Taking into account Table 7, the indicators that the simulation gave us and these are compared with the results of 2019. However, the annual costs that were reduced are also compared.
Human Systems Engineering and Design (IHSED 2021) https://openaccess.cms-conferences.org/#/publications/book/978-1-7923-8987-0
SLS 76.45% 86.72% 10.27% It can be seen in table 14 that the company's objective was reached during 2019 if it chose to carry out inventory planning. The level of service for both OTIF and SLS increased by more than 85%, placing it as a high and competitive level of service before the distribution companies (Lam and Shiu, 2010). The company's 2020 objective was to achieve a service level greater than 90%, which was achieved, but there were some limitations: for the simulation of the year 2020, due to the pandemic crisis, it was difficult to collect data of the company. Therefore, the forecast demand for the year 2019 was taken and the same input distributions as well as the lied time.
CONCLUSIONS
The applied research confirms the initial hypothesis because it increases the profitability of the company by applying the demand forecast analyzed for the telecommunications market. In this way, the SFR indicator increases by 9.61% compared to the current one, and the OTIF increases to 93.15%, which indicates the effectiveness of the methodologies used.
This study shows that the company did not take into account a planning and inventory management process, as well as a storage control. All this produced high costs that limited the company to generate a higher percentage of profits and to satisfy all customers. Likewise, the application of the EOQ, Safety Stock and Reorder Point methodology, based on the new demand calculated under the single and double exponential attenuation forecast, is optimal for the company, reducing the company's operating expenses by 5.5%.
According to our findings, inventory management suggests policies for the study company: (i) for those spare parts classified in group A, the Economic Or-der Quantity (EOQ) and the re-order point will be determined, and some of them must be kept in inventory and ordered frequently; (ii) for those spare parts classified in group B, the EOQ and reorder point will also be determined, but the management of this group of spare parts need less attention than those of group A; here only a periodic review is needed; and (iii) spare parts classified in group C must be kept in stock and requested when necessary.
The results obtained were favorable for the sales that were registered in 2019, however, with the year 2020, due to the pandemic there have been limitations for a calculation efficiency, the 2020 sales were reduced at the beginning of the year, due to the quarantines and curfew that was recorded in the Lima - Peru area, there were also several data and new variables that had an influence and the simulation did not adapt these variables for the results, leading to the result obtained in the projection for the year 2020 would not be the most realistic.
Human Systems Engineering and Design (IHSED 2021) https://openaccess.cms-conferences.org/#/publications/book/978-1-7923-8987-0
Finally, it was concluded that the proposed methodology in logistics management generated greater benefit than the previous process applied by the company.
REFERENCES
Arboleda, J. and Castillo, A. (2017) “Modelo integrado de clasificación abc multicrité-rio,aplicado en el área de picking de un centro de distribución de repuestos,”. Behrouzi, F. and Wong, K. Y. (2011) “An investigation and identification of lean
supply chain performance measures in the automotive SMES.” Do Rego, J. R. and De Mesquita, M. A. (2015). “Demand forecasting and inventory control: A simulation study on automotive spare parts,” Int. J. Prod. Econ., vol. 161, pp. 1–16. Iqbal, Q. and Malzahn, D. (2017) “Evaluating discriminating power of single-criteria
and multi-criteria models towards inventory classification,” Comput. Ind. Eng., vol. 104, pp. 219–223. Kaabi, H. and Jabeur, K. (2016) “A new hybrid weighted optimization model for multi criteria ABC inventory classification,” in Advances in Intelligent Systems and Computing, 2016, vol. 427, pp. 261–270. Lagodimos, A. G., Skouri, K., Christou, I. T. and Chountalas, P. T. (2018) “The
discrete-time EOQ model: Solution and implications,” Eur. J. Oper. Res., vol. 266, no. 1, pp. 112–121. Lam, P. L. and Shiu, A. (2010) “Economic growth, telecommunications development and productivity growth of the telecommunications sector: Evidence around the world,” Telecomm. Policy, vol. 34, no. 4, pp. 185–199. Ng. T. W. and Chung, W. (2009). “The Roles of Distributor in the Supply Chain–
Push-pull boundary,” Int. J. Bus. Manag., vol. 3, no. 7. Mehdizadeh, M. (2020). “Integrating ABC analysis and rough set theory to control the inventories of distributor in the supply chain of auto spare parts,” Comput. Ind. Eng., vol. 139, p. 105673. Memari, A., Rahim, A., Hassan, A. and Ahmad, R. (2017). “A tuned NSGA-II to
optimize the total cost and service level for a just-in-time distribution network,” Neural Comput. Appl., vol. 28, no. 11, pp. 3413–3427. Nemtajela, N. and Mbohwa, C. (2017) “Relationship between Inventory Management and Uncertain Demand for Fast Moving Consumer Goods Organisations,” Procedia Manuf., vol. 8, pp. 699–706. Ongkicyntia, A. and Rahardjo, J. (2018). “Replenishment strategy based on histor-
ical data and forecast of safety stock,” in Proceedings - 2017 International Conference on Soft Computing, Intelligent System and Information Technology: Building Intelli-gence Through IOT and Big Data, ICSIIT 2017, 2017, vol. 2018-January, pp. 353–358. Pando, V., San-José, L. A., García-Laguna, J. and Sicilia, J. (2018). “Optimal lot-size policy for deteriorating items with stock-dependent demand considering profit maximiza-tion,” Comput. Ind. Eng., vol. 117, pp. 81–93. Pasandideh, S. H. R., Niaki, S. T. A. and Ahmadi, P. (2018). “Vendor-managed
invento-ry in the joint replenishment problem of a multi-product single-supplier
Human Systems Engineering and Design (IHSED 2021) https://openaccess.cms-conferences.org/#/publications/book/978-1-7923-8987-0 multiple-retailer supply chain: A teacher-learner-based optimization algorithm,” J. Model. Manag., vol. 13, no. 1, pp. 156–178. Ramos, E., Pettit, T. J., Flanigan, M., Romero, L. and Huayta, K. (2020). “Invento-ry
Management Model Based on Lean Supply Chain to Increase the Service Level in a Distributor of Automotive Sector,”. Roda, I., Macchi, M., Fumagalli, L. and Viveros, P. (2014). “A review of multicriteria classification of spare parts: From literature analysis to industrial evidences,” J. Manuf. Technol. Manag., vol. 25, no. 4, pp. 528–549. Salam, A., Panahifar, F. and Byrne, P. J. (2020). “Retail supply chain service levels:
the role of inventory storage,” J. Enterp. Inf. Manag., vol. 29, no. 6, pp. 887– 902, 2016. Scholz-Reiter, B; Heger, J., Meinecke, C. and Bergmann, J. (2012). “Integration of de-mand forecasts in ABC-XYZ analysis: Practical investigation at an industrial company,” Int. J. Product. Perform. Manag., vol. 61, no. 4, pp. 445–451. Stojanović, M. and Regodić, D. (2017). “The significance of the integrated
multicriteria ABC-XYZ method for the inventory management process,” Acta Polytech. Hungarica, vol. 14, no. 5, pp. 29–48. Tiwari, S., Wee, H. M. and Sarkar, S. (2017). “Lot-sizing policies for defective and dete-riorating items with time-dependent demand and trade credit,” Eur. J. Ind. Eng., vol. 11, no. 5, pp. 683–703. Xu, X. (2017). "Coordinating a Three-level SC with Service Level Contract and Profit
Sharing Contract," Washington State University, vol. 03, no. 18, pp. 156-173. Yang, D., Xiao, T. and Shen, H. (2009) “Pricing, service level and lot size decisions of a supply chain with risk-averse retailers: Implications to practitioners,” Prod. Plan. Control, vol. 20, no. 4, pp. 320–331. Zhu, S., Dekker, R., Van Jaarsveld, W., Renjie, R. W. and Koning, A. J. (2017) “An
improved method for forecasting spare parts demand using extreme value theory,” Eur. J. Oper. Res., vol. 261, no. 1, pp. 169–181.
Human Systems Engineering and Design (IHSED 2021) https://openaccess.cms-conferences.org/#/publications/book/978-1-7923-8987-0
LISTED IN THE AHFE DIGITAL BOOKSTORE CATALOGUE
Explore the complete digital volume
Human Systems Engineering and Design (IHSED2021): Future Trends and Applications
Read this individual research paper free through the original publisher, or explore the full digital proceedings book.
ISBN 978-1-7923-8987-0
Explore this ISBN in the AHFE Bookstore ↗Listed in the July 2026 bookstore catalogue; search by ISBN to confirm current availability · Digital book purchase optional