Pictorial Human Body (2022). Establishing Threshold for Visual Discrimination of Height in. In: Advances in Ergonomics In Design, Usability & Special Populations: Part I. AHFE Open Access, vol. 18. https://doi.org/10.54941/ahfe100809
Human height is usually determined by objective measures. Taking into account that body height can have perceptual dimensions, it seems interesting to investigate this personal attribute by a more subjective approach. However, for this it would be former necessary to establish the capability to discriminate difference between figures depicturing body heights. Thus, the objective of this study was to establish the smallest perceptible difference whilst judging the similarity between different human figures representing body heights. Methods: 140 pairs of human figures were presented to 37 participants. The differences between human figures varied from 0 (equal) to 6 cm proportionally to the real height. Each participant judged whether the figures were similar or different. Results: The percentage of correct answers increased when the difference between figures increased. This percentage was higher than 70% for differences corresponding to 4 cm or higher of the real height for both genders. Conclusion: Relative difference (sensory threshold) of 4 cm was consistently established for visual discrimination of height in pictorial human body. This sensory threshold can be considered when studies on perceptual body height are conducted in the future.
Height is a universal parameter of individual characterization. This parameter is related to age, gender, functional aspects and health, among others, and usually measured by interval systems in continuous variables, i.e. inches and centimeters. However, the concept of individual height or stature also carries strong psychological meanings. Thus, this complex variable has long been investigated using different instruments and procedures, considering the target populations and objectives involved. In this sense, height or stature has been studied in adults and children by means of questionnaires, scales and objective measurements evaluating social, emotional and clinical outcomes.
Human Height Studied in Different Populations for Different Purposes Shorter height or stature has been extensively studied in children as it is during childhood that variations in normal
Ergonomics In Design, Usability & Special Populations I (2022) https://openaccess.cms-conferences.org/#/publications/book/978-1-4951-2106-7 growth are observed. The influence of short heights on social and psychological aspects has motivated an enormous number of studies since the 1960s. However, there is clear controversy in the findings. Stabler, Whitt and Moreault (1980), who studied social judgments in short children reported that these individuals have diminished social judgment. In their literature review, they mentioned that behavior adopted by these children tend to accentuate the discrepancy between their stature and chronological age. These children would prefer the company of younger ones, they might become withdrawn and isolated from colleagues, show lower indices of self-esteem, see themselves as unhappy (Gordon, Crouthamel, Post, and Richman, 1982), and could be unable to respond positively to competitive challenge (Stabler et al, 1980). However, these findings are not supported by reports from other authors (Drotar, Owens and Gotthold, 1970; Voss, Bailey, Mulligan, Wilkin and Betts, 1991; and Sandberg, Brook and Campos 1994). Moreover, parents´ and physicians´ perception seem to differ from their children´s. Erling, Wiklund and Albertsson-Wikland (1994), who studied the perception of well-being in short stature children compared their perception with their parents and reported that the parents rated the children's well-being as lower.
Still regarding short children, controversy on the use of hormone treatment for idiopathic short stature makes the issue more complex. While a number of studies reports evidence pro the use of hormones (Boulton, Dunn, Quigley, Taylor and Thompson, 1991; Lanes, 2000), or at least little evidence (Downie, Mulligan, Stratford, Betts and Voss, 1997), others state the contrary, considering that the treatment might not allow for the expected effects (Theunissen, Kamp, Koopman, Zwinderman, Vogels and Wit, 2002; Visser-van, Sinnema and Geenen, 2006), and that short stature might not be associated with psychological morbidity (Sandberg et al, 1994; Zimet et al, 1997). An in-depth discussion of this issue is clearly beyond the scope of this report. However, it is interesting to mention conclusions from two studies. According to Zimet’s et al (1997) study, although no association between short stature and alterations in psychosocial and intellectual functioning might be found in children, short stature in childhood might lead to dysfunction in adulthood, being associated with lower educational achievement and self-esteem, and greater emotional distress. In order to investigate the problem prospectively, a longitudinal community based study - The Wessex Growth Study – was conducted. Ulph, Betts, Mulligan and Stratford (2004) reported no association between short stature and poorer psychosocial adaptation in children followed for 10 years, starting from 7-9 years, revaluated at 11-13 years (Downie et al 1997) and as young adults (18-20 years, Ulph et al, 2004).
Despite this, the relation between short stature and poorer psychosocial adaptation have continued deserving attention from more recent studies, and positive association were reported for adults (Chu and Geary, 2005; Cawley, Joyner and Sobal, 2006; Pisanski and Feinberg, 2013; Yancey and Emerson, 2014). In these studies, emotional distress, psychosocial adaptation and height preferences were studied in shorter adults and the general adult population by means of different evaluative dimensions.
Height and attractiveness was investigated using self-reports of dating behavior and photo observations by Shepperd and Strathman (1989). According to them, males preferred shorter females as dates, whilst females preferred taller males. However, for males the relationship between height and attractiveness was less clear. Jackson and Ervin (1991) assessed male and female height preferences considering social and physical attractiveness, professional status, personal adjustment, athletic orientation, masculinity and femininity, and reported that shortness is a more negative stereotype than tallness is a positive one. Results were clearer for males than females. Pierce (1996) conducted two meta-analyses to investigate female and male height preferences for romantic partners. Although the height effect was not consistent throughout the studies included in the analysis, in general, there was some evidence supporting the female preference for taller males. Moreover, reviewing an expressive body of comparative studies, either between or within cultures, Pisanski and Feinberg (2013) confirmed predictable patterns concerning the preference of some physical traits perceived as attractive, including height.
Regarding the perception of skills and personal characters, height has also been associated with cognitive and professional aspects. Although studies have been more concentrated on male evaluations, taller females were also considered more intelligent, assertive, ambitious and affluent than shorter females (Chu and Geary, 2005).
Although evidence has been reported for the association between height and psychosocial adaptation in adults, such clear results are not reported for children. One aspect to be considered is that assessing height perception might be very different from assessing height self-perception. Moreover, understanding the problem seems to be challenging when considering that studies evaluate different target populations, diverse origins of short heights and use different procedures and instruments.
Different Procedures and Instruments for Evaluating Human Height Ergonomics In Design, Usability & Special Populations I (2022) https://openaccess.cms-conferences.org/#/publications/book/978-1-4951-2106-7
Body image is a multidimensional construct and requires multiple theoretical rationales and measuring methods (Keeton, Cash and Brown, 1990). Among them, there are more objective measures and more subjective instruments. The former are usually applied by many authors only as sample selection criteria, and the participants are assessed by other instruments thereafter, according to the objective of the study. Among those measures are the direct metric ones (centimeters, inches), as well as the use of percentiles of the participants´ height of a study or the population height normal curve, as used in a comprehensive study by Gordon et al (1982).
Using scales is another interesting approach, widely used in the context of perceiving weight and body mass index (BMI). These scales can have pictorial elements, presented in conjunction, shown with progressively different dimensions or, individually, or can even be presented in an analogical visual format. The aim of these instruments is to usually assess body image disturbances within eating disorder contexts (Gardner and Brown, 2010).
Regarding height perception, only one pictorial scale for height assessment was found in the available literature. This scale, Silhouette Apperception Technique (SAT), was designed to assess the perception by children and adolescents during the growing-up stage and is available in male and female versions (Erling, Wiklund and Albertsson-Wikland, 1994). The scale has also been used to assess the perception of parents and caretakers concerning the child´s current height at the time of the assessment and also their expectations about the child´s future height. The scale shows five figures, drawn from the percentiles of the normal growth curve, representing five levels which vary from 1 (short/small) to 5 (tall/high). One predominant application of this technique was concerning the assessment of body height of children in the context of hormonal therapies for low heights (Grew, Stabler, Williams and Underwood, 1983; Visser-van, Geenen, Kamp, Huismans, Wit and Sinnema, 2005; Hunt, Hazen and Sandberg, 2004). Specific methods that use images have also been proposed in other studies such as the one by Chu and Geary (2005), which use modified virtual images to represent the same woman in different heights.
Another frequently used instrument to assess body self-perception is the questionnaire, proposed in different versions. Among them, the Attitude to Growth (ATG) Scale refers to an instrument developed for short-height and growth-hormone-deficiency children (Boulton, Dunn, Quigley, Taylor & Thompson, 1991). This is a self- administered instrument and was applied by Boulton et al. (1991) to assess the impact of low height in varied psychic functioning aspects of the participants. There are also Issues Related to Growth Problems and a Height Questionnaire (IRGPH) which, as reported by Brütt, Sandberg, Chaplin,Wollmann, Noeker, Kołtowska-Häggström, and Bullinger Brütt (2009), has structured and open questions aiming at collecting information concerning issues addressed in the literature as relevant for the modulation of a psychosocial impact on short heights. It was developed to use for children aged 8 years old or more, under treatment, but can also be answered by parents or guardians. The authors also describe The Short Stature in Children – A Questionnaire for Parents, which aims at covering the domains ‘suffering’, ‘future anxieties’, ‘behavioral problems’ and ‘coping efforts’ through affirmative sentences the respondents have to agree with according to a four-point Likert scale.
Contribution of Psychophysics to the Study of Human Height The self-image related to the body mass and body weight index, of perceptual and attitudinal character using the psychophysical approach has attracted much attention. As a consequence, different techniques have been made available such as schematic drawings, affective, cognitive and behavioural assessments, computer programs with videos and photos and even scales of figures for those evaluations (Gardner and Boice, 2004; Gardner and Brown, 2010). However, little has been developed within this scope to assess the self-perception of an individual regarding his own body height. Considering this, psychophysics seems a relevant approach to help in the development of instruments for this purpose.
Psychophysics, as defined by Gescheider (1997), refers to the study of the relation between stimulus and sensation. Essential to psychophysics is the concept of sensory threshold, which is based on the idea that mental events should assume critical values in order to be consciously experimented. Two sensory threshold are usually described, the absolute and the difference threshold. The absolute threshold is defined as the smallest value of stimulus that is necessary to produce the sensation. The difference threshold is the minimum detectable difference between two levels/intensity of a particular sensory stimulus. In this context, the difference threshold or, just noticeable difference (JND), can be easily understood as the smallest perceptible difference between two stimuli of the same type and quality, but with different magnitudes (Allick, Toom, Raidvee, Averin and Kreegipuu, 2013). Although this concept had been applied to evaluate different dimensions such as noise, shine intensity, weight, linear length, pixels, and so on, no difference threshold was found in the available literature for the distinction between the smallest differences Ergonomics In Design, Usability & Special Populations I (2022) https://openaccess.cms-conferences.org/#/publications/book/978-1-4951-2106-7 among height human figures.
Objective The aim of this study is to establish the smallest perceptible difference between two human figures so as to determine the difference threshold for pictorial height. This value will be useful to construct instruments for assessing the perception of height or stature more objectively associated to perceptual aspects. Thus, the objective of this work was to establish the just noticeable difference or the smallest perceptible difference in the height of human figures and the lowest level of error whilst judging the similarity between figures representing different body heights.
METHOD
Participants 37 university students participated in this study. 19 were women and 18 men with an average age of 26.6±6.5 and 26.0±3.0 years and an average height of 166.2±5.8 and 177.7±5.4 cm, respectively. The participants did not present any reported visual perceptive restriction. They voluntarily signed a written informed consent to participate in the study.
The number of participants was established through sample calculation carried out using the G*Power 3.1 program and was based on the following parameters: binomial test (comparison of a proportion of successes (80%) in relation to a constant value, 50%, chance of success and failure), using a one-tailed test (proportion of successes higher than 80%), alpha of 5% and power test of 80%. The size of the effect was estimated from the relation between the two proportions (0.5 and 0.8) to be compared, which resulted in a sample size of 18 individuals. As the differences between the genders were not known, it was decided that two groups of participants of different genders would be recruited and thus the sample size was doubled.
Procedures Initially, and in order to graphically represent the different Brazilian statures, a professional artist participated in the work. To create the figures, a standard door (2.10m) was included in the figure as a known physical measure. The original size of the door was transposed into a digital image of 17cm. From this parameter, silhouettes representative of different statures were created for each gender. Considering the Brazilian population, the following ranges of height were adopted: from 157.5 to 164.5cm for females and from 169.5 to 176.5cm for males. By the method of constant stimulus, the silhouettes were designed varying at 1.0 cm intervals, proportionally to the actual height.
After creating the representative silhouettes for male and female heights, a routine was created for the computing Program PsychoPy2 which allowed for the random presentation of pairs of figures in order to test the perceptive threshold of the existing difference between statures and define variation intervals between the different silhouettes. The test used random combinations of figures to present pairs of identical figures and with differences varying from 1 to 6cm. Therefore, the combinations of tested figures were: identical figures, different by 1cm, 2cm, 3cm, 4cm, 5cm and 6cm. Each of these combinations was presented 20 times to each individual, making a total of 140 pairs of figures. The program is able to search for the answers of each participant and return the number of successes and failures, according to the actual difference existing between the figures presented.
Data Collection Data was collected in a room adequately prepared with controlled illumination and sound; each individual was seated on a comfortable chair at a standard distance of 50 cm from the computer. The participant was informed of the task he/she had to perform consisting of observing and judging the human figures in terms of them being or not
Ergonomics In Design, Usability & Special Populations I (2022) https://openaccess.cms-conferences.org/#/publications/book/978-1-4951-2106-7 being identical. The pairs of figures were presented to the participant for 4 seconds and, immediately after that the participant answered the question about the similarity between the figures and was given free time for this step. Depending on his/her own decision, the individual had to answer the decision taken using the computer keyboard by pressing the key designated for each of the conditions: identical figures or different figures. In order to make the task easier, stickers were put on each key, with the answer yes (are identical) and no (are not identical).
During the presentation of the 140 pairs of figures, an interval of 1 minute was allowed after the presentation of the first 70 pairs to allow the participant to rest, and therefore avoided having a tiring effect on his/her answers. The total application time for each participant was approximately 20 minutes.
Data Analysis In order to analyze the results, the judgments that correctly evaluated the pair of silhouettes presented were considered as successes: an answer indicating equal height of figures when the figures had the same height and an answer indicating an absence of equality when the figures presented different sizes. Answers different from these just described were considered wrong ones. The magnitude of errors was calculated.
The data was descriptively analyzed through the medians and quartiles and the percentage of successes for each of the combinations of tested figures was presented.
The successes for each of the combinations were statistically compared using the Kruskal-Wallis test with multiple comparisons and the Mann-Whitney test, with an adjustment of Bonferroni (p=0.0023); as the data are of discrete quantitative nature, they allow for the application of non-parametric tests. The quantity of successes between the genders was also compared by the Mann-Whitney test. The level of significance adopted was 0.05. The data were analyzed using the SPSS 11.5 (Chicago, IL) software.
RESULTS
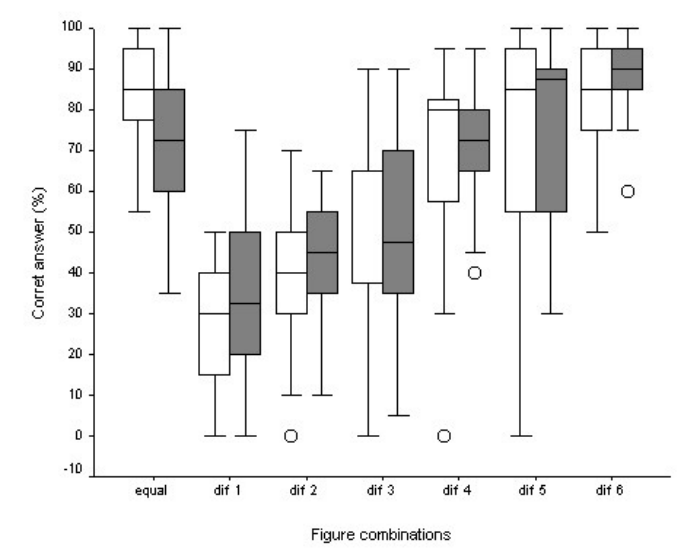
The average percentage of successes when the figures were identical was of 77±17%. When the figures were of different sizes, the average percentage of successes for minor differences was low, but as the difference of sizes between the figures increased, a progressive increase in the percentage of success was observed, as shown in Figure 1. When the difference between the figures was of 4cm, the percentage of successes reached values above 70%, and the lowest level of success (minimum) was twice the one obtained when the difference between the figures was of 3cm.
Table 1. Average percentage, standard-deviation, minimum and maximum of successes for combinations of different figures (differences in cm)
Table available in the original PDF paper.
Difference between the figures (cm) identica
l 1 2 3 4 5 6 total 77±17 31±19 42±16 55±22 73±16 78±21 87±13
maximu m 100 75 70 90 95 100 100
minimu m 35 0 10 15 30 30 50
The comparison between the number of successes for each possible combination between figures presented significant statistical difference using the Kruskal-Wallis test (p<0.000). The multiple comparison revealed a Ergonomics In Design, Usability & Special Populations I (2022) https://openaccess.cms-conferences.org/#/publications/book/978-1-4951-2106-7 difference between the percentage of successes in conditions where the figures were identical and when the differences among them were small: 1cm, 2cm and 3cm, since for these cases the participants found it difficult to identify these differences and answering that the figures were identical (Table 2). The lowest differences (1cm, 2cm and 3cm) also presented lower levels of successes than the combinations where the figures had higher differences in size (4cm, 5cm and 6cm).
Table 2. Values of p for comparisons between differences.
the figures (cm) 6 0.067 <0.000 <0.000 <0.000 <0.000 0.096
Differences between
No significant statistical difference was found in the number of successes and failures between males and females (p=0.0886) as shown in Figure 2.
Figure 2. Percentage of successes of females (white boxes) and males (grey boxes) for each combination of figures: identical, different by 1cm (dif 1), 2cm (dif 2), 3cm (dif 3), 4cm (dif 4), 5cm (dif
5) and 6cm (dif 6).
Ergonomics In Design, Usability & Special Populations I (2022) https://openaccess.cms-conferences.org/#/publications/book/978-1-4951-2106-7
DISCUSSION
Differences below 4cm between the silhouettes, proportionally to the actual size were identified by the judgment of the participants as identical in almost half of the studied combinations (average success of 55%). For differences higher than 4cm between the figures, however, the level of success was higher than 70%. Although some authors adopt lower values, according to Nunnaly (1978), results from studies evaluating measurement reliability or consistency should reach 70% of agreement to be considered consistent. Thus, statistically, it was observed that the smallest perceptible difference of 4 cm identified here can be considered a reliable value for the assessment of human figures in relation to the real height represented by the silhouette.
No results were found in the literature that could be directly compared with the ones described here. Accepting the concept of JND also as the minimum level of stimulation detected for at least 50-percent of time (Chaplin, 2010), or in more than 50% trials, making a parallel interpretation, the number of correct answers (70% for 4 cm) observed in the present study can be considered not only reliable, but also high.
Some aspects of the methodological procedures adopted in the design of the human figures used here might possibly explain the high level of correct answers. One of them is that the figures were presented in pairs. According to Nachmias (2011), studying discrimination between size and shape, the difference between both is reduced when figures are presented simultaneously than presented successively. Furthermore, according to this author, the discrimination of height seems to increase when the width is kept unchanged, a measure also taken in the present design.
Another feature of the design that might have played a role in the high percentage of correct answers is that an external reference was provided to help the perceptual judgment of the figures. The figures were framed by a door, representing the real dimensions of a door. Biernat, Manis and Nelson (1991) evaluating height judgment in photographs of unknown persons, identified differences between genders. When interpreting their error results, they mentioned that the variation found might be explained by the fact that the photos were not full length, and did not provide height cues to support the judgment. These design characteristics might also explain the fact that there was no difference in correct answers between genders in the present study. As mentioned in the Introduction, besides height being an essential element of physical characterization, it is also an attribute of social representation. In this context, some authors have reported differences between genders (Chu and Geary, 2005), whilst others not (Hunt at al., 2000). However, in the present context, height was evaluated in a more controlled psychophysical condition, which may lead to the consistent results obtained.
CONCLUSIONS
The results showed that a 4 cm difference proportional to the actual height in human figures was identified with successes higher than 70% for males and females and are, therefore, a reliable biased threshold to use in future studies aimed at using human figures for psychophysical assessments of body height.
Acknowledgements: This study was partially supported by CNPq (Proc. N. 301772-2010-0 and Proc. N. 158634/2013-6) and PNPD Capes (Proc. N. 23038006938/2011-72).
REFERENCES
Allick, J., Toom, M., Raidvee, A., Averin, K. & Kreegipuu, K. (2013, May). An almost general theory of mean size perception.
Vision Research, 83(3):25-39. Biernat, M., Manis, M. & Nelson, T.E. (1991). Stereotypes and Standards of Judgment. Journal of Personality and Social Psychology, 60(4):485-499.
Ergonomics In Design, Usability & Special Populations I (2022) https://openaccess.cms-conferences.org/#/publications/book/978-1-4951-2106-7
Boulton, T.J., Dunn, S.M., Quigley, C.A. Taylor, J.J., & Thompson, L. (1991). Perceptions of self and short stature: effects of two years of growth hormone treatment. Acta Paediatrica Scandinavica, 377(Supplement):20-7. Brütt, A.L., Sandberg, D.E., Chaplin, J., Wollmann, H., Noeker, M., Kołtowska-Häggström, M., & Bullinger, M. (2009, August
18). Assessment of Health-Related Quality of Life and Patient Satisfaction in Children and Adolescents with Growth Hormone Deficiency or Idiopathic Short Stature – Part 1: A Critical Evaluation of Available Tools. Hormone Research. 72(2):65–73. Cawley, J., Joyner, K. & Sobal, J. (2006). Size Matters: The Influence of Adolescents' Weight and Height on Dating and Sex.
Rationality and Society, 18(1):67-94. Chaplin, J.P. Dictionary of Psychology. E-book from Random House, LLC, 01/12/2010, 528 pages. Chu, S., & Geary, K. (2005, June). Physical stature influences character perception in women. Personality and Individual Differences, 38(8):1927–1934. Downie A.B., Mulligan J., Stratford R.J., Betts P.R. & Voss L.D. (1997, January 11). Are short normal children at a
disadvantage? The Wessex growth study. British Medical Journal, 314(7074):97-100. Drotar D., Owens R. & Gotthold J. (1980). Personality adjustment of children and adolescents with hypopituitarism. Child Psychiatry Human Development, 11(1):59-66. Erling, A., Wiklund, E. & Albertsson-Wikland, K. (1994, December). Prepubertal children with short stature have a different
perception of their well-being and stature than their parents. Quality of Life Research, 101(3):477-480. Gardner, R.M. & Boice, R. (2004, February). A computer program for measuring body size distortion and body dissatisfaction.
Behavior Research Methods, Instruments, & Computers, 36(1):89-95. Gardner, R.M. & Brown, D.L. (2010, January). Body image assessment: A review of figural drawing scales. Personality and Individual Differences, 48(2):107–111. Gescheider, G.A. (1997). Psychophysics: The Fundamentals. Lawrence Erlbaum Associates: 3rd Edition. New Jersey, USA. Gordon, M., Crouthamel,C., Post, E.M. & Richman, R.A. (1982, September). Psychosocial aspects of constitutional short stature:
Social competence, behavior problems, self-esteem, and family functioning. The Journal of Pediatrics, 101(3):477-480. Grew, R.S., Stabler B., Williams R.W. & Underwood L.E. (1983, October). Facilitating patient understanding in the treatment of growth delay. Clinical pediatrics (Phila), 22(10):685-690. Hunt, L., Hazen, R.A., & Sandberg, D.E. (2000). Perceived versus Measured Height. Which is the stronger predictor of
psychosocial functioning? Hormone Research, 53(3):129–138. Jackson, L.A. & Ervina, K.S. (1992). Height Stereotypes of Women and Men: The Liabilities of Shortness for Both Sexes . The Journal of Social Psychology, 132(4):433-445. Keeton, W.P., Cash, T.F. & Brown, T.A. (1990, Spring). Body image or body images? Comparative, multidimensional
assessment among college students. Journal of Personality Assessment, 54(1-2):213-230. Lanes, R. (2000, July). Growth velocity, final height and bone mineral metabolism of short children treated long term with growth hormone. Current Pharmaceutical Biotechnology, 1(1):33-46. Nachmias, J. (2011, February 23). Shape and size discrimination compared. Vision Research, 51(4):400–407. Pierce, C.A. (1996). Body height and romantic attraction: A meta-analytic test of the male-taller norm. Social Behavior and
Personality, 24(2):143-149. Pisanski, K. & Feinberg, D.R. (2013, May 1). Cross-cultural variation in mate preferences for averageness, symmetry, body size, and masculinity. Cross-Cultural Research, 47(2):162-197 Sandberg, D.E., Brook A.E. & Campos, S.P. (1994, December). Short stature: psychosocial burden requiring growth hormone
therapy? Pediatrics, 94(6):832-840. Shepperd, J.A. & Strathman, A.J. (1989). Attractiveness and height: The role of stature in dating preference, frequency of dating, and perceptions of attractiveness. Personality and Social Psychology, 15(4):617-627. Stabler, B., Whitt, J.K., & Moreault, D.M. (1980, June). Social judgments by children of short stature. Psychological Reports,
46(3):743-746. Theunissen, N.M.C., Kamp, G.A., Koopman, H.M., Zwinderman, K.A.H., Vogels, T. & Wit, J. (2002, May). Quality of life and self-esteem in children treated for idiopathic short stature. The Journal of Pediatrics, 140(5):507–515. Ulph, F., Betts, P., Mulligan, J. & Stratford, R.J. (2004, January). Personality functioning: the influence of stature. Archives of
Disease in Childhood, 89(1):17-21. Visser-van Balen, H., Geenen, R., Kamp, G.A., Huismans, J., Wit, J.M. & Sinnema, G. (2005, June 8). Motives for choosing growth-enhancing hormone treatment in adolescents with idiopathic short stature: a questionnaire and structured interview study. BioMed Central Pediatrics, 5(1):15. Visser-van Balen, H., Sinnema, G. & Geenen, R. (2006, May). Growing up with idiopathic short stature: psychosocial
development and hormone treatment; a critical review. Archives of Disease in Childhood, 91(5):433-439. Voss, L.D., Bailey, B.J.R., Mulligan, J., Wilkin, T.J. & Betts, P.R. (1991). Short stature and school performance — the Wessex Growth Study. Acta Paediatrica Scandinavica, 377(Suppl):29-31. Yancey, G. & Emerson, M.O. (2014, January 21). Does height matter? An examination of height preferences in romantic
coupling. Journal of Family Issues, 35(1):1-21.
Ergonomics In Design, Usability & Special Populations I (2022) https://openaccess.cms-conferences.org/#/publications/book/978-1-4951-2106-7
LISTED IN THE AHFE DIGITAL BOOKSTORE CATALOGUE
Explore the complete digital volume
Advances in Ergonomics In Design, Usability & Special Populations: Part I
Read this individual research paper free through the original publisher, or explore the full digital proceedings book.
ISBN 978-1-4951-2106-7
Explore this ISBN in the AHFE Bookstore ↗Listed in the July 2026 bookstore catalogue; search by ISBN to confirm current availability · Digital book purchase optional