Alessandra Amendolaa, Alfonso Pellecchiaa, Luca Sensinib (2019). The Use of Electronic Banking Services in Italy: the Case of Credit Cards. In: Advances in The Human Side of Service Engineering. AHFE Open Access, vol. 8. https://doi.org/10.54941/ahfe100289
Among the electronic banking services, that of credit cards can be considered as an index of standard of living. Although Italy is one of the leading developed countries, the use of credit cards, and more generally of electronic payment instruments, is not widespread compared to other western countries. Our aim is to investigate such differences highlighting their socio-economic implications, for example in terms of competition in the credit card markets. Using the most recent Bank of Italy Survey on Household Income and Wealth as data source, we employ count data models in order to identify the socio-economic, demographic and geographic variables affecting the number of credit cards held by Italian households. Results show that the considered variables are statistically significant in explaining the process. Particularly, we find that the geographic location is an important determinant of families’ behavior. This result is consistent with the socio-economic gap between the North and the South of Italy. Other relevant predictors are the level of education, the gender and the marital status.
A credit card is a system of payment since it allows the cardholder to pay for goods and services without using cash. This presupposes that the card issuer has granted a line of credit, mostly uncollateralized, from which the user borrows to either pay to the seller or withdraw cash from an ATM. In case of revolving credit card, the cardholder does not pay his balance in full each month, but in installments and the issuer charges an interest rate.
These characteristics of credit cards entail many economic issues. Firstly, from an industrial organization perspective, the credit card industry can be viewed as a network industry, like electricity supply, telecommunications and railroads.1 In fact, the participation of a new economic agent to the network involves positive externalities for other participants.
More precisely, credit cards are two-sided network goods (Rochet and Tirole 2004; Rysman 2009) as the benefits for the users depends on the number of sellers in the network and, similarly, the benefits for the sellers increase with the number of the users (Chakravorti 2003). In turn, these network effects give rise to competion policy issues (Carlton and Frankel 1995; Lemley and McGowan 1998).
1See Economides (1996) for an introduction to the economics of networks. https://openaccess.cms-conferences.org/#/publications/book/978-1-4951-2091-6
In this context, the fact that consumers hold or use credit cards from multiple networks is known as “multi-homing”' and in some theoretical models it is of great importance in determining the outcome of the industry (Rochet and Tirole 2003; Guthrie and Wright 2007). Empirically, however, it is not clear what should be intended for multi- homing (Snyder and Zinman 2008). More precisely, two issues arise. First, one should establish whether what matters is merely the possession of multiple credit cards or even their actual use. The second question concerns the substitutability between debit cards and credit cards in deciding whether a given cardholder is a multi-homer or not.
Secondly, since credit cards allow borrowing without applying for personal loans, there exists an incentive in building up large debts (Loke et al. 2011). White (2007) argues that the sharp increase in bankruptcy filing rates in the United States from 1980 to 2004 has been due to the growing credit card debt of families. Castronova and Hagstrom (2004) model the credit card demand as a two-stage decision: first, cardholders obtain the right to borrow within a certain limit; then they borrow a fraction of that limit. Using the Survey Consumer Finances as data source, they conclude, among other things, that consumer who want to borrow more do not apply for an higher limit, but hold more credit cards. Thus, the multiple credit cards can be seen as a device to access to more financing.
Although borrowing by means of credit cards could seems irrational, given the high interest rates charged and the large profits earned by issuers (Ausubel 1991), some authors have maintained that this behavior is nonetheless consistent with economic theory (Zywicki 2000). Brito and Hartley (1995) show that consumers could be willing to pay high interest rates on credit card debts in order to avoid the costs of bargaining with financial institutions or those associated with precautionary money holding.
If so, another apparent contradiction emerges. Data show that many consumers simultaneously hold costly credit card debts and low-return liquid assets, so that it would be rational to repaying their outstanding balances (Gross and Souleles 2002; Telyukova and Wright 2008). However, this action (known as “co-holding”) can be explained as an attempt to self-control compulsive buying or the need to complete transactions for which a credit card cannot be used (Gathergood and Weber 2012).
In the light of these considerations, it is of interest to study the factors affecting the choice of holding multiple credit cards. On one hand this could be a first step toward a more in deep understanding of multi-homing. 2 On the other hand, these factors influencing the number of credit cards held by an individual could help in predicting family bankruptcy end explaining the “co-holding” phenomena.
In the literature, several econometric techniques have been used to model the credit card ownership of individuals or households. If the focus is on the choice between to use or not use credit cards, the natural choice is the logit or probit models (Yayar and Karaca 2012). Other studies, such as (Pulina 2011), try to identify the factors affecting the type of credit card used by means of a multinomial logit model. When data on the number of credit cards held are available, several authors (Kinsey 1981; Chien and Devaney 2001; Tan et al. 2011) have used the tobit model. However, since the variable under consideration is a nonnegative integer, it can be better to resort to count data models as, for example, in (Loke et al. 2011).
In this paper we aim at investigate the determinants driving the credit card ownership and analyse the implication of socio-economic, demographic and geographic variables in the card payment system. Following the approach of Loke et al. (2011) we focus on the number of credit cards held by households and employ count data models. Particularly, we estimate both Poisson and negative binomial models and compute the marginal effects of the covariates on the number of credit cards held. The data used in the empirical analysis come from the most recent Survey of Household Income and Wealth (SHIW) conducted by the Bank of Italy.
We found that factors such as age, income, wealth, sex, geographic location, education and marital status are effective in explaining the number of credit cards held by Italian household, with the last three exerting the stronger impact.
The paper is organized as follow. The next section highlights the main features and some trends of the Italian credit card markets. Section 3 illustrates the econometric models used, while Section 4 is devoted to the description of data and variables. Results are presented and discussed in Section 5. Finally, the last section draws some conclusions.
2The two concepts are not overlapping but clearly multiple credit cards are a necessary, although not sufficient, condition for multi-homing. Human Side of Service Engineering (2019)
SOME TRENDS IN THE ITALIAN PAYMENT CARDS MARKETS Credit card belongs to the broader category of payment cards which also includes debit cards and prepaid cards. Debit cards are generally issued by banks to account holders. They can be used to withdraw from ATMs or instead of cash when purchasing good and services. Withdrawals and payments are debited to the cardholder almost in real time. Put another way, the cardholder is not allowed to pay the money back at a later time as for credit cards, so that enough funds must be available on the bank account when the debit card is used.
A prepaid card can be used only after it has been loaded with funds by the holder. Like a debit card, it allow to withdraw or to pay good and services but without necessarily holding a bank account. Basically, it works in the opposite way of a credit card, because instead of buying something to pay later, the holder pays in advance what will be bought afterwards.
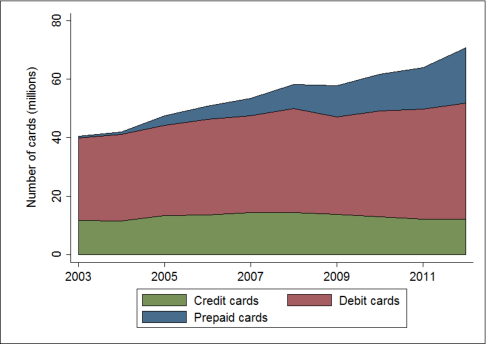
Table 1 reports some trends in the number of payment cards issued in Italy in the years 2003-2012. The same data are depicted in Figure 1. The number of credit cards remained fairly constant during the period reaching a total of about 12,000 units in 2012. On the contrary, debit cards followed an increasing trend and experienced a negative growth rate only in 2009. Currently, they amount to almost 40,000 units, which are the 56% of the payment cards circulating in Italy.
As regards prepaid cards, their growth has been impressive. They increased from 677 in 2003 to 18,804 in 2012, which is to say a compound growth rate of 44% per year. In 2011, the number of prepaid cards has passed that of credit cards (14,203 and 12,189, respectively).
As Figure 2 shows, the per capita number and value of transactions realized by credit cards has increased over the years. In 1992, on average, Italian people aged 18 and over used their credit card 4 times spending 395 euros.3 Thirteen years later, these figures were 10 and 737, respectively.
Like in other countries (Chakravorti 2003), also in Italy the credit card industry has been under the scrutiny of antitrust authorities, even in recent years.4 This is not surprising, since, as it is evident from Table 2, both the issuing and the acquiring5 credit card markets are highly concentrated, with CartaSì as a leader. The CR4 concentration ratio6 is 66.1 in the former market and 85.9 in the latter.
3In constant 2000 euros. 4See Italian Competition Authority (2004, 2009, 2010). 5Acquiring is the process that enables merchants to accept the credit cards issued to consumer by bank and other financial institutions. 6 In economics, the CR4 is one of the most used concentration ratios and it is computed as the sum of the market shares of the four largest firms. Like others concentration ratios, such as the Herfindahl–Hirschman Index (HHI), it measures the degree of monopoly power exerted by firms in a given market. Human Side of Service Engineering (2019)
FIGURE 1: Number of payment cards by type, Italy, 2003-2012
Figure available in the original PDF paper.
Source: Our elaboration on Bank of Italy data.
FIGURE 2: Per capita number and value of transactions realized by credit cards, Italy, 1999-2012
Source: Our elaboration on Bank of Italy data.
TABLE 2: Market shares in the credit card issuing and acquiring markest (percentages), Italy, 2008 Marke Issuer Acquirer Market share t share
A very commonly used technique for modelling count data is the Poisson regression. Given a set of N independent observations ( yi, xi)where yi is a count and xi is a vector of covariates, assume that yi given xi is distributed as a Poisson, that is
yi
−μ μ
Equations and mathematical formulas are available in the original paper PDF.
The conditional mean is parametrized as
where β is a vector of parameters to be estimated.7 Since Var ( yi∨xi)=E ( yi∨xi)=μi, the model is heteroskedastic. It can be easily estimated by maximizing the log-likelihood function, which is given by
The equality between the mean and the variance of the Poisson distribution, also known as equidispersion property, is very often rejected by data, since the variance exceeds the mean. A simple solution to this problem is to assume a Negative Binomial (NB) distribution for yi (given xi), which allows a more flexible modeling of the variance. The NB distribution writes as
7Note that, by (2), μ>0. Human Side of Service Engineering (2019)
where Γ (∙) is the gamma function and α is an additional parameter to be estimated. The mean and variance are now E ( yi∨xi)=μi and Var ( yi∨xi)=μi+α μi
2. If the conditional mean is still parametrized as in (2), then the log- likelihood becomes
Note that if α=0, (4) reduces to the Poisson distribution (1), which means that the Poisson model is nested within the NB model. Then one can choose between the two models by means of an LR test of H 0:α=0against H 1: α>0. Given the expression of the conditional variance of the NB model, this is equivalent to test for overdispersion (Long and Freese 2001).
Alternatively, both a Wald test and an LM test are available. The former can be performed using the t test statistic of the estimated α parameter, while the latter requires testing the significance of α in the following auxiliary OLS regression:
2−yi ^μi
where ^μi=exp( xi ' β ) are the fitted values of the Poisson model and ui is an error term (Cameron and Trivedi 1998).
With the estimated parameters at hand, marginal effects can be calculated. The effect of one-unit change in the j-th regressor on the conditional mean, evalueted at the sample mean of the covariates, is given by
A better approach (Bartus2005) is to use (7) (with xiin place of x) to compute the marginal effect over all individuals and then taking their average, that is
Besides, for a dummy variable, one should use the finite difference method. In this case the marginal effect is the change in the conditional mean when the variable changes from 0 to 1. Formally, let xi=[ zidi ] and β=[β zβd ], where di is the dummy variable. Then
DATA AND VARIABLES The data used in this study come from the Survey of Household Income and Wealth (SHIW) conducted by the Bank of Italy in 2010.8 The survey involved 7951 households, which are representative of the Italian population. The respondent was the head of the household, who supplied information on composition of the family and the socio- demographic characteristics of its members, employment, income and consumption, wealth, use of the payment instruments and relationship with the financial intermediaries. While some questions concern every member, some others involve the household as a whole.
The variables drawn or constructed from the dataset9 are described in Table 3, while their descriptive statistics are shown in Table 4 and 5.
CRECAR is the number of credit cards held by the household and represents our dependent variable. On average, each family in the sample holds 0.47 credit cards. However, about the 68% of the sample have no credit cards, while a large portion (about 30%) holds one or two. The maximum number of credit cards held is seven. The variable is overdispersed, since its variance is equal to 0.8.
As regressors we consider two distinct sets of variables.10 The first set includes the following variables:
the age of the head of household (AGE). It is expected that households whose head is older held more credit cards. However, behind a certain threshold value the relationship should invert and become negative. To test this hypothesis, we include the square of AGE (labelled as AGESQ) as an additional regressor;
the number of the household members (NCOMP). Larger families are likely to own more credit cards, so the expected sign of the corresponding coefficient is positive;
household net wealth (WEALTH). A larger wealth should reflects an higher standard of living and thus the propensity to hold more payment instruments. Moreover, for wealthy people, increasing the number of credit cards held could be a way of showing their social status (Gan et al. 2008). Then we expect a positive coefficient for this variable;
the household net disposale income (INCOME). Households that earn more should fulfill the income requirement for credit card eligibility more easily, so it is expected that this variable positively affects the credit card ownership.
The second set of covariates aims to capture the effect of geographic and other socio-demographic factors and consists of the following groups of dummy variables:
Geographic location (NORTH, CENTRE and SOUTH). This group of dummies records the location where the household resides. As it is well known, in Italy the level of social and economic development reduces going from North to South. Thus, assuming NORTH as the reference group, we expect the sign of the SOUTH coefficient to be negative, that is households located in the southern regions should possess less credit cards. By the same reasoning, the CENTRE variable should negatively impact on the number of credit cards, but its effect should be lower in magnitude;
Municipality size (SMUN, MMUN, LMUN). These variables consider whether a given household resides in a small (up to 40,000 inhabitants), medium (from 40,000 to 500,000 inhabitants) or large (more than 500,000 inhabitants) municipality, respectively. Considering SMUN as reference, both MMUN and LMUN coefficient are expected to be positive, since living in a more dynamic social 8The survey is carried out since 1977 every one or two years. We used the most recent available data. 9The dataset is freely available at http://www.bancaditalia.it/statistiche/indcamp/bilfait/dismicro. 10 Before proceeding, it is worth noting that CRECAR is available only at a family level, while most of the variables we are going to discuss in the text concerns the head of household (see Table 3). Then we are assuming that the latter variables give a good description of some characteristics of the household considered as a whole. This seems to us to be a better solution with respect to resort to some index based on all family members' data. Human Side of Service Engineering (2019) and economic environment - as it occurs in larger cities - should foster the credit card ownership;
Sex (MAL, FEM). Both variables are either zero or one depending on the gender of the family head, being MAL the omitted category. The sign of the FEM coefficient is not a priori determinable;
Education (NSC, CSC, HSC, BDP). By means of this group the effect of education is considered. The head of family could have no education (NSC), attended the compulsory school (CSC), hold a high school diploma (HSC) or attained a Bachelor/post-graduate degree. Again, considering the first variable as the reference group, the coefficients of the remaining dummies should exhibit a positive sign. Indeed, more educated individuals are expected to be more confident in using a larger number of credit cards and managing additional bills;
Marital status (MAR, SIN, SDW). Here we take into account whether the head of family is married (MAR), single (SIN) or separated/divorced/widower/widow (SDW). Married people could possess multiple credit cards in order to manage the family balance sheet more efficiently. On the other hand, not married individuals (especially singles) could be more prone to credit card ownership because of a more free lifestyle. Thus for this variables we have no a priori knowledge about the sign of their coefficients. As before the omitted category is the first one (MAR).
Summing up, and jointly considering the reference groups defined above, the “base”' head of houseold is a married male, with no educational qualification and living in a small municipality located in the North of the country.
Moreover, on the basis of the figures reported in Table 5, we can state that the most frequent profile in the sample is a married male, who has completed the compulsory school and residing in a medium sized city of northern Italy.
TABLE 3: Descrption of the variables Variable Description CRECARa Number of credit cards held by the family members (dependent variable) AGEb Age of the head of household NCOMPa Number of the household members WEALTHa Net wealth (real assets + financial assets - financial liabilities) INCOMEa Net disposale income of the household
Table available in the original PDF paper.
DUMMYVARIABLES Geographiclocationa NORTH* North CENTRE Centre SOUTH South Municipalitysizea
SMUN* Small municipality (up to 40,000 inhabitants) MMUN Medium municipality (from 40,000 to 500,000 inhabitants) LMUN Large municipality (more than 500,000 inhabitants) Sexb MAL* Male FEM Female Educationb
NSC* No educational qualification CSC Compulsoryschooldegree HSC High schooldegree BDP Bachelor’s degree or post-graduate qualification Maritalstatusb MAR* Married SIN Single SDW Separated/divorced or widower/widow aVariable (or group) refers to the household as a whole. bVariable (or group) refers to the head of household. * Reference group.
Marital status MAR* 4956 62.3 SIN 993 12.5 SDW 2002 25.2 Total 7951 100 *Reference group
EMPIRICAL RESULTS AND DISCUSSION Using the data set described above, both the Poisson and the NB models have been estimated by means of maximum-likelihood. Estimation results are reported in Table 6. In the Poisson model most of the estimated coefficients are significant at least at the 5% level. However, the test based on the auxiliary OLS regression (6) rejects the null hypothesis of equidispersion (α=0). The same apply to the result of the LR test. Furthermore, both the Akaike (AIC) and the Bayesian (BIC) information criterions are higher in the case of the Poisson model. Thus, the NB model has to be preferred to the Poisson model and in discussing results we will focus on the former of the two.
Nevertheless, the overdispersion is not severe. In fact, the estimated α is small (0.09 in the auxiliary OLS regression and 0.08 in the negative binomial model) and the parameter standard errors of the two models are very similar.
From the third column of Table 6, we see that, in the NB model, 14 regressors out of 16 have a statistically significant impact - generally at the 1% level - on the number of credit card held by Italian households.
The coefficient of AGE is positive, while that of AGESQ is negative, which implies an inverted U relationship between the age and the number of credit cards. Put differently, this means that the number of credit cards held increases as age increases, but only up to a certain value, from which it decreases. From the estimated coefficients, this value is equal to 0.0836/(2*0.0009) = 46.44, as can also be seen from Figure 3, which plots the number of credit cards as a function of the age for the base level individual and setting all variables but dummies to their means.
The last column of Table 6 reports the average marginal effects (AME) of the negative binomial model computed according to (8) and (9). For AGE the AME is -0.006, which means that, on average, one more year of age is associated with 0.006 fewer credit cards. Thus the impact of the age on the credit card ownership is fairly small. 11 11However, since the relationship is not linear, the marginal effect varies with the age.
The NCOMP parameter is not significant, meaning that the number of credit cards is unaffected by the household size. Maybe, this variable would be better measured if it was net of the number of children in the family. Actually, they are not legally able to own a credit card.
The household net wealth (WEALTH) is significant but, contrary to what was expected, it exerts a negative effect on the quantity of credit card. The magnitude of the marginal effect, however, is negligible: if wealth increases by one million, then number of credit cards reduces by only 0.027.
Instead, the number of credit cards increases with income (INCOME) by 0.005 for each additional thousand euros or, which is the same, by 5 for each million euros. Thus, when considering the economic well-being of households, the decision on how many credit cards to hold seems to be driven mainly by income, although its effect is not so high.
Turning to the dummy variables included in the model, those associated to the geographic location (CENTRE and SOUTH) are both strongly significant and negative, confirming that, as one moves from North to South along the country, households tend to hold fewer credit cards. As already noted, this can be explained by the lower level of socioeconomic development prevailing in the southern part of Italy. Particularly, households living in the South own 0.338 fewer credit cards than those residing in the North (which represents the reference group). The same applies to families located in the central Italy, but the effect is much lower (0.078).
Among the variables recording the size of the municipality where the household lives, MMUN and LMUN, only the former is significant and shows a positive sign. Looking at the magnitude of the marginal effect, we can state that the number of credit cards held by families living in medium sized cities increases by 0.038 with respect to that held by families residing in small municipalities. We also found that households whose head is a woman possess fewer credit cards than households with a male head, although the difference is quite small (0.089). The number of credit cards held is higher when the head is more educated, as shown by the positive sign of the coefficient CSC, HSC e BDP. Particularly, families whose head attended the compulsory school hold 0.237 more credit cards than those whose head has no education. If the head of household attained a high school diploma or a Bachelor/post- graduate degree, then the family holds 0.593 and 0.707 credit cards, respectively, more than the reference group. In other word, an increasing relationship between the number of credit cards held and the level of education seems to exist. Finally, households held fewer credit cards, if their heads are single or separated/divorced/widower/widow. The marginal effects are 0.135 and 0.156 respectively.
FIGURE 3: Number of credit cards as function of age
Figure available in the original PDF paper.
CONCLUDING REMARKS In this paper we have studied the determinants of the use of one of the major electronic banking services (credit cards) by Italian families. Using data from the most recent Survey of Household Income and Wealth (SHIW) conducted by the Bank of Italy and count data models, we have found that factors such as wealth, income and geographic location of the household, and socio-demographic characteristics of the head of household are effective in predicting the number of credit cards held. Among those factors, those exerting a stronger impact are the location where the household resides and the level of education and the marital status of the head of household.
More precisely, families living in the South of Italy and whose head is single or separated/divorced/widower/widow possess fewer credit cards, while families whose head is more educated held more credit cards. These results could be of help in understanding some characteristics of the credit card market such as “multi-homing” and “co-holding”.
Perhaps, other factor could be included among the determinants of the number of credit cards, but the availability of data and the absence of a theory that could guide this choice are quite binding. A possible solution would be the use of panel data and then the modelization of unobserved heterogeneity. We leave this for future research.
(0.0611) (0.0614) (0.0241) Overdispersion test 0.09 - (0.0002) - F test - 17.55 - (0.0000) Log-likelihood -5879.35 -5870.57 Parameters 16 17 AIC 11790.70 11775.15 BIC 11902.39 11893.82 Pseudo R2 0.2158 0.1954 Observation 7951 7951 Significant at: *** = 1% level; ** = 5% level; * = 10% level. Standard errors of parameters and elasticities and p-values of the tests in parentheses. For the Poisson model standard errors are robust. Reference groups: NORTH, SMUN, MAL, NSC, MAR.
REFERENCES
Ausubel, L.M. (1991), “The Failure of Competition in the Credit Card Market”, AMERICAN ECONOMIC REVIEW Volume 81 No. 1. Bartus, T. (2005), “Estimation of marginal effects using margeff”, STATA JOURNAL Volume 5 No. 3. Brito, D.L., Hartley, P.R. (1995), “Consumer Rationality and Credit Cards”, JOURNAL OF POLITICAL
ECONOMY Volume 103 No. 2. Cameron, A.C., Trivedi, P.K.(1998), “Regression Analysis of Count Data”. Cambridge University Press, Cambridge, UK. Carlton, D.W., Frankel, A.S.(1995), “The antitrust economics of credit card networks”, ANTIRUST LAW
JOURNAL Volume 63 No. 2. Castronova, E., Hagstrom, P.(2004), “The demand for credit cards: evidence from the Survey of Consumer Finances”, ECONOMIC INQUIRY Volume 42 No. 2. Chakravorti, S. (2003), “Theory of Credit Card Networks: A Survey of the Literature”, REVIEW OF NETWORK
ECONOMICS Volume 2 No. 2. Chien, Y.W., Devaney, S.A. (2001), “The Effects of Credit Attitude and Socioeconomic Factors on Credit Card and Installment Debt”, JOURNAL OF CONSUMER AFFAIRS Volume 35 No. 2. Economides, N. (1996), “The economics of networks”, INTERNATIONAL JOURNAL OF INDUSTRIAL
ORGANIZATION Volume 14 No. 6. Gan, L.L., Maysami, R.C., Koh, H.C. (2008), “Singapore credit cardholders: ownership, usage patterns, and perceptions”, JOURNAL OF SERVICES MARKETING Volume 22 No. 4. Gathergood, J., Weber, J. (2012), “Self-control, Financial Literacy and the Co-holding Puzzle”, CFCM WORKING
PAPER 4, Centre for Finance and Credit Markets. Gross, D.B., Souleles, N.S. (2002), “Do Liquidity Constraints and Interest Rates Matter for Consumer Behavior?
Evidence from Credit Card Data”, QUARTERLY JOURNAL OF ECONOMICS Volume 117 No. 1. Guthrie G., Wright, J. (2007), “Competing Payment Schemes”, JOURNAL OF INDUSTRIAL ECONOMICS Volume 55 No. 1. Italian Competition Authority (2004), “I566 - CARTASI’-AMERICAN EXPRESS - Provvedimento n. 13434”.
BOLLETTINO SETTIMANALE31, 5–79. — (2009). “C9817 – ISTITUTO CENTRALE DELLE BANCHE POPOLARI/SI HOLDING - Provvedimento n.
19513”. BOLLETTINO SETTIMANALE5, 45–52. — (2010). “I720 - CARTE DI CREDITO - Provvedimento n. 21768”. Bollettino settimanale 43, 11–106. Kinsey, J. (1981), “Determinants of Credit Card Accounts: An Application of TobitAnalysis”, JOURNAL OF CONSUMER RESEARCH Volume 8 No. 2. Lemley, M.A., McGowan, D. (1998), “Legal Implications of Network Economic Effects”, CALIFORNIA LAW
REVIEW Volume 86 No. 3. Loke, Y.J., Yen, S.T., Tan, K.G.T. (2011), “Credit Card Averters and Amassers: Evidence from Malaysia”, ASIAN ECONOMIC JOURNAL Volume 25 No. 4. Long, J.S., Fresse, J. (2001), “Regression Models for Categorical Dependent Variables Using Stata”.Stata Press,
College Station, Texas. Pulina, M. (2011), “Consumer behavior in the credit card market: a banking case study”, INTERNATIONAL JOURNAL OF CONSUMER STUDIES Volume 35. Rochet, J.C., Tirole, J. (2003), “Platform Competition in Two-Sided Markets”, JOURNAL OF THE EUROPEAN
ECONOMIC ASSOCIATION Volume 1 No. 4. — (2004), “Two-Sided Markets: An Overview”, Unpublished paper. Rysman, M. (2009), “The Economics of Two-Sided Markets”, JOURNAL OF ECONOMIC PERSPECTIVES Volume 23 No. 3. Snyder, C.M., Zinman, J. (2008),“Consumer Homing on Payment Cards: From Theory to Measurement”,
Unpublished paper. Tan, A.K.G., Yen, S.T., Loke, Y.J. (2011), “Credit card holders, convenience users and revolvers: A tobit model with binary selection and ordinal treatment”, JOURNAL OF APPLIED ECONOMICS Volume 14 No. 2. Telyukova,.I.A., Wright R. (2008), “A Model of Money and Credit, with Application to the Credit Card Debt
Puzzle”, REVIEW OF ECONOMIC STUDIES Volume 75 No. 2. White, M.J. (2007), “Bankruptcy Reform and Credit Cards”, NBER WORKING PAPER 13265, National Bureau of Economic Research.
Yayar, R., Karaca, S.S. (2012), Identifying the factors affecting the consumer credit card ownership: empirical evidence from Turkey”, JOURNAL OF APPLIED ECONOMIC SCIENCES Volume 7 No. 2. Zywicki,T.J. (2000),,Economics of Credit Cards”, LAW AND ECONOMICS WORKING PAPER 22, School of
Law, George Mason University.
LISTED IN THE AHFE DIGITAL BOOKSTORE CATALOGUE
Explore the complete digital volume
Advances in The Human Side of Service Engineering
Read this individual research paper free through the original publisher, or explore the full digital proceedings book.
ISBN 978-1-4951-2091-6
Explore this ISBN in the AHFE Bookstore ↗Listed in the July 2026 bookstore catalogue; search by ISBN to confirm current availability · Digital book purchase optional