Kanji Okazaki, Keiichi Watanuki (2026). Voice-Based Human Relaxation Assessment Using Autoencoder-Driven Anomaly Detection of Calm Speech. In: Affective and Pleasurable Design. AHFE Open Access, vol. 204, pp. 39–49. https://doi.org/10.54941/ahfe1007330
Speech contains paralinguistic cues that reflect psychophysiological states, making it a promising non-contact signal for monitoring mental well-being. However, supervised stress prediction is often impractical because high-stress utterances are difficult to collect at scale, ethically sensitive, and typically weakly labeled. Additionally, real-world datasets frequently exhibit substantial cohort imbalance and repeated measurements per participant. Therefore, we propose a relaxation-first one-class screening approach. Using speech data collected in Tamura City, Fukushima Prefecture, Japan, we first computed a calm score for each recording using an in-house logistic regression-based emotion estimator. We then validated Tamura as a practical relaxed reference cohort through a participant-aware comparison procedure, employing cluster bootstrapping with matched downsampling of an external cohort. The Tamura cohort exhibited a higher mean calm score than the non-Tamura cohort (mean difference = 10.43; Hedges’ g = 0.34; Welch t-test p = 2.5×10⁻⁹), along with a higher rate of “high-calm” samples under a stringent upper-tail criterion (calm ≥ 95.0). Uncertainty was quantified using bootstrap confidence intervals. Using Tamura as the reference distribution for normal data, we trained a denoising autoencoder on standardized 128-dimensional log-Mel summary features, defining the anomaly score as the reconstruction error. The decision threshold (τ= 0.6484) was calibrated by controlling the false-positive rate on normal validation data. The model demonstrated stable convergence (final loss ≈ 0.36) and produced interpretable, deployment-ready outputs: near-threshold normal samples remained below τ (e.g., 0.6338), whereas clear anomalies exceeded it (e.g., 1.016). Overall, this study presents a coherent pipeline linking data constraints, imbalance-aware validation, and autoencoder-based deviation detection, offering a practical approach to low-burden, voice-based relaxation screening. However, we emphasize that “calm” is a model-derived proxy and requires further validation against human-grounded assessments.
Speech contains paralinguistic cues that reflect psychophysiological states, making it a promising non-contact signal for monitoring mental well-being (Gobl and Ní Chasaide, 2003). Speech emotion recognition provides a Received February 21, 2026; Revised April 2, 2026; Accepted April 16, 2026; Available online July 20, 2026
40 Okazaki and Watanuki methodological framework for extracting state-related acoustic features and mapping them to affective dimensions (El Ayadi et al., 2011). Recent work further support the use of voice-based biomarkers for stress and mental-state assessment, including pilot evidence in healthy adults (Namkung et al., 2024) and meta-analytic findings suggesting fundamental frequency as a potential marker of stress (Veiga et al., 2025). However, supervised stress prediction is often impractical in real world settings: high-stress utterances are difficult to collect at scale, ethically sensitive, and typically weakly labeled. Moreover, real-world datasets frequently exhibit substantial cohort imbalance and repeated measurements per participant, which can bias naïve event-level analyses.
To address these constraints, we reformulate the problem as a relaxation- first, one-class screening approach, consistent with anomaly-detection paradigms that learn a representation of “normal” data and flag deviations at inference (Chalapathy and Chawla, 2019). Rather than learning “stress” from scarce high-stress samples, we instead learn a relaxed reference distribution from speech collected under conditions where non-stress states are more readily obtainable, and subsequently detect non-relaxed states as deviations from this baseline. We use speech data collected in Tamura City, Fukushima Prefecture (Abukuma Highlands), and test the hypothesis that this setting yields comparatively calmer speech, as quantified by a model- derived calm indicator.
For each recording, we computed a calm score using an in-house logistic regression-based emotion estimator. To validate Tamura as a reference cohort relative to speech from other regions, we employed a comparison procedure that accounts for both imbalance and within-participant dependence. Specifically, Tamura data were resampled at the participant (cluster) level, while the external cohort was downsampled within each bootstrap replicate to match the number of recordings. This approach yields bootstrap confidence intervals (CI) for differences in mean calm scores and in the proportion of “high-calm” samples.
After establishing the reference cohort, we trained a denoising autoencoder (AE) on normal data and defined the anomaly score as the reconstruction error. At inference, an utterance is flagged as an ANOMALY when ( ) s x τ ≥, where τ is calibrated to control the false-positive rate on normal validation data. To support reproducibility, we visualize the distribution of anomaly scores ( ) s x and automatically identify representative near-threshold NORMAL and ANOMALY examples.
The contributions of this study are threefold: (i) a relaxation-first one- class formulation under realistic data constraints; (ii) robust validation of a reference cohort that accounts for imbalance and repeated measures; and (iii) reproducible AE-based deviation detection with calibrated thresholding.
METHODOLOGIES Tamura City (Fukushima Prefecture), located in the Abukuma Highlands, is a plateau-like mountainous regions characterized by abundant natural
Voice-Based Human Relaxation Assessment 41 landscapes and low-density residential areas. Such environments are often regarded as psychologically restorative; accordingly, we treated speech recorded in Tamura as a practical source of relaxed (non-stress) reference data for relaxation-oriented screening.
To operationalize “relaxed” speech, we computed a calm score for each recording using an in-house logistic regression-based emotion estimator. Recording from Tamura exhibited a higher mean calm score than those from other regions (see figures), supporting its use as a candidate reference cohort.
Because the dataset is severely imbalanced (with substantially more non- Tamura recordings) and includes repeated measures (multiple recordings per participant), naïve event-level comparisons may obscure true group differences. To address this, we employed a participant-aware bootstrap procedure. Specifically, Tamura data were resampled at the participant (cluster) level using identifiers inferred from filenames, and in each bootstrap replicate, the non-Tamura cohort was downsampled to match the number of recordings in the resampled Tamura set. This procedure yields bootstrap CI for (i) the mean difference in calm scores (Tamura − non-Tamura) and (ii) the difference in “high-calm” rates under a predefined threshold (Efron and Tibshirani, 1993; Davison and Hinkley, 1997).
Emotion-vector domain shift analysis. Beyond the calm score, we evaluate cohort differences using the full eight-dimensional emotion vector (sad, happy, angry, fearful, disgust, surprise, calm, neutral). Under balanced resampling (by downsampling the non-Tamura cohort to match Tamura), we quantified distributional separation using the energy distance with permutation testing and assessed discriminability via cross-validated logistic-regression AUC. For interpretability, we visualized the balanced samples in a 2-D embedding (UMAP) and summarize cohort composition within Gaussian mixture model (GMM) clusters using the proportion of Tamura samples.
Using Tamura as the normal reference distribution, we formulated deviation detection as a one-class screening problem rather a supervised stress prediction task, which is constrained by scarce and weakly labeled high-stress data (Chalapathy and Chawla, 2019). We train an autoencoder (AE) on reference (normal) data to learn the latent structure of relaxed speech (Hinton and Salakhutdinov, 2006; Vincent et al., 2010).
Given a standardized feature vector 128 x∈[Equation or mathematical symbol available in the original paper PDF] , the AE produces a reconstruction ˆx, and the anomaly score ( ) s x is defined as reconstruction error, measured by the mean squared error (MSE). The decision rule is ( ) ˆy s x τ = [Equation or mathematical symbol available in the original paper PDF] ≥[Equation or mathematical symbol available in the original paper PDF][Equation or mathematical symbol available in the original paper PDF][Equation or mathematical symbol available in the original paper PDF][Equation or mathematical symbol available in the original paper PDF] ,
where τ is calibrated on normal validation data to control the false-positive rate, providing an operationally interpretable constraint on spurious anomaly detections. For reproducibility, we report learning curves and visualize anomaly-score distributions across training, validation, and test sets, with the decision threshold τ overlaid. We further highlight representative near- threshold NORMAL and ANOMALY examples to illustrate model behavior in ambiguous regions.
DATA PROCESSING All audio files were converted into a unified format and processed using the same feature pipeline employed for model training and inference. Each waveform was loaded in mono and resampled to 6,000 Hz using librosa (McFee et al., 2015) with the (res_type=“kaiser_fast”) resampling mode. The signal was then amplitude-normalized using librosa.util.normalize. When enabled via conditions.json, waveform boundaries were trapped using a full-length Hamming window prior to mel-spectrogram extraction to reduce boundary transients in short recordings (Harris, 1978).
From each recording, we extracted a 128-bin log-Mel representation using librosa.feature.melspectrogram with parameters _ 128 n mels = , _ fft 2048 n = , _ 512 hop length = , _ 51 win length = , and 2 power = , where 128 T S × ∈[Equation or mathematical symbol available in the original paper PDF] denotes the resulting Mel power spectrogram and T is the number of time frames. The Mel power spectrogram was then converted to a decibel scale using power_to_db (referenced to the per-sample maximum), yielding a log-scaled spectrogram dB S , defined elementwise as: ( )
Equations and mathematical formulas are available in the original paper PDF.
S S S
, , 10log , m t dB m t m t m t
The log-scaled spectrogram was subsequently reduced to a fixed-length representation by taking the temporal mean across frames. To match the training pipeline, we define 128 v ∈[Equation or mathematical symbol available in the original paper PDF] as the per-recording, per-Mel-band summary feature obtained by time-averaging the log-scaled Mel spectrogram and applying a fixed scaling and log compression:
( ) ( ) ( ) 0 , mean
t dB m t m
Here, v is a 128-D feature vector (one value per Mel band) obtained after temporal aggregation; the division by 80 and sign inversion map the dB-scaled values to a convenient numerical range, and the subsequent log transform compresses the dynamic range while ensuring numerical stability via a small offset ε . To ensure strict compatibility between training and inference, the feature vector was standardized using parameters computed on the training- set and stored in the run directory (scaler_mean.npy, scaler_std.npy), i.e., ( ) / x v µ σ = − . During training, we employed a denoising objective by adding zero-mean Gaussian noise ( 0.05 σ = ) to the standardized 128-D feature vector x and training the AE to reconstruct the clean x. This standardized vector 128 x∈[Equation or mathematical symbol available in the original paper PDF] was used consistently for (i) calm-score related analyses (via the upstream logistic-regression emotion model) and (ii) AE- based anomaly scoring.
For the autoencoder (AE) pipeline, we applied the best-performing AE checkpoint (model_ae_best.keras) to reconstruct the standardized feature
Voice-Based Human Relaxation Assessment 43 vector x, yielding ˆx. We define the anomaly score ( ) s x as the mean squared reconstruction error (MSE) defined as
1 , ( ) 12 ˆ ˆ 8 i i i s x MSE x x x x
A fixed decision threshold 0.6484 τ = , determined on the validation set using a false-positive rate (FPR)-based criterion (stored in threshold.json), was then applied:
ANOMALY if ( ) s x ≥ τ
NORMAL otherwise For reporting and reproducibility, inference outputs included threshold metadata (threshold.json), feature extraction and training conditions (conditions.json), and runtime statistics (e.g., processing_time_in seconds, peak and RMS amplitude, recording duration). The AE was trained for up to 200 epochs, with both training and validation logged throughout. For relaxation (calm) characterization, “high calm” events were defined using a threshold of calm ≥ 95.0 (threshold-based binarization). This cutoff was intentionally set as a stringent upper-tail criterion to capture only clearly calm utterances. Because the calm score is model-derived and may vary across speakers and recording conditions, a high threshold reduces ambiguity and focuses on highly confident calm instances, serving as a high-specificity proxy for relaxed speech, rather than classifying moderately elevated scores as relaxed. This choice is consistent with evidence that vocal and stress-related acoustic markers exhibit substantial inter-speaker variability (Namkung et al., 2024; Veiga et al., 2025). Participant-aware resampling was implemented by parsing participant identifiers from filenames when available applying a cluster bootstrap with B = 5000 replicates. This procedure was used to compute cCI for group differences (Tamura vs. non-Tamura), following established bootstrap methods for dependent or repeated-measures data (Efron and Tibshirani, 1993; Davison and Hinkley, 1997), and was aligned with the analysis scripts.
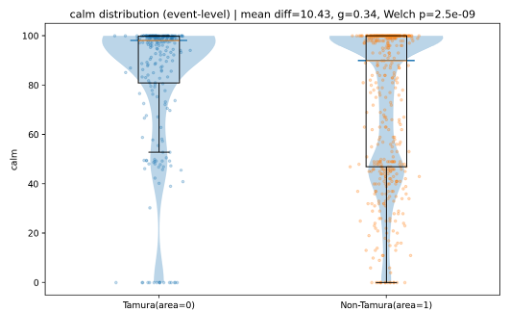
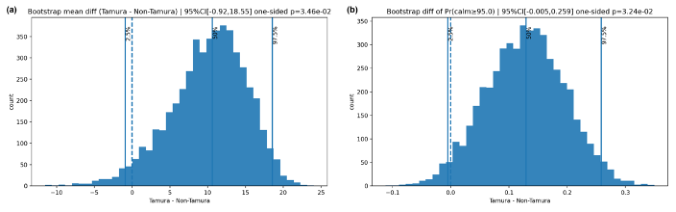
EXPERIMENTS, RESULTS, AND DEMONSTRATION To assess whether Tamura City can serve as a “relaxed-baseline” data source, we compared calm scores between the Tamura cohort and a non- Tamura reference cohort using the same emotion estimator (our eight-class logistic-regression model). The calm-score distribution exhibited a positive shift for Tamura (Figure 1), with a mean difference of 10.43 points and a small-to-moderate standardized effect size (Hedges’ g = 0.34); a Welch’s t-test further indicated a statistically significant difference (p = 2.5 × 10⁻⁹). To mitigate reliance on parametric assumptions, we additionally quantified uncertainty using bootstrap resampling of the mean difference (Figure 2(a)). The bootstrap 95% CI was [−0.92, 18.55]. Although this interval includes zero, a one-sided test for a positive shift remained significant (p = 3.46 ×
44 Okazaki and Watanuki 10−²), suggesting that Tamura redordings tend to be calmer on average, albeit with non-negligible uncertainty due to sample variability.
Figure 1: Calm-score distributions for Tamura and non-Tamura cohorts.
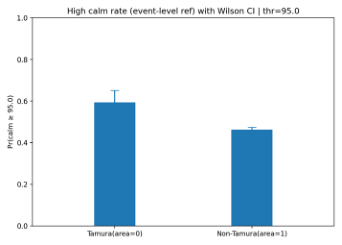
We further evaluated whether Tamura recordings more frequently fall into a “high-calm” regime using a stringent threshold (calm ≥ 95.0). The observed high-calm rate was higher in the Tamura cohort than in the reference cohort (Figure 3). Bootstrap analysis of the difference in proportions yielded a 95% CI of [−0.005, 0.259], while a one-sided test for a positive-shift remained significant (p = 3.24 × 10−²; Figure 2(b)). Taken together, the upward shift in mean calm scores and the elevated high-calm rate provide empirical support for using Tamura recordings as a practical proxy for relaxed speech in relaxation-oriented modeling.
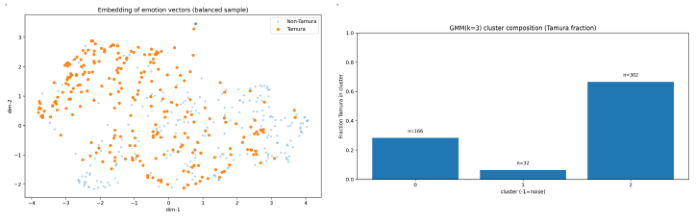
Emotion-vector domain shift analysis. While the calm score provides a unidimensional proxy, the full 8-D emotion vector reveals a broader distributional shift between cohorts. Under balanced resampling (B = 200; downsampling the non-Tamura cohort to match Tamura), the energy distance consistently indicated a significant difference between Tamura and non-Tamura emotion vectors (median = 0.6028; 5–95% = 0.5143–0.7079; permutation p ≤ 0.005 with P = 200). A logistic regression classifier trained on the same 8-D vectors achieved strong cross-validated separability (median AUC = 0.8299; 5–95% = 0.8021–0.8547), suggesting that Tamura
Voice-Based Human Relaxation Assessment 45 represents a distinct domain in the emotion-score space rather than a minor sampling fluctuation. Consistent with this finding, GMM clustering (k = 3) produced clusters with markedly different Tamura fractions (median range across clusters = 0.4550; 5–95% = 0.3389–0.6002), further supporting the presence of a cohort-level distributional shift (Figure 4(a,b); Table 1).
Figure 3: High-calm event rates by cohort (calm ≥ 95.0).Figure 4: (a) Balanced 2-D embedding of emotion-score vectors (Tamura vs. non- Tamura); (b) GMM cluster composition by cohort (Tamura fraction; k = 3).
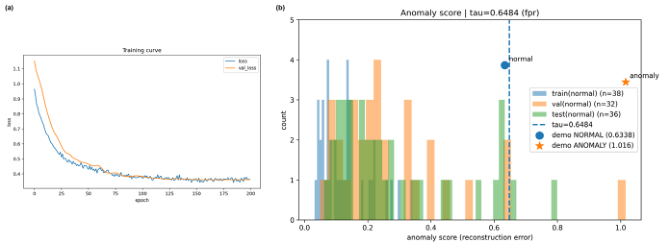
Next, we trained an AE-based anomaly detector to operationalize “deviation from the relaxed baseline” as a single scalar anomaly score (reconstruction error). The training curves indicate stable optimization: both training and validation losses decreased smoothly and converged over 200 epochs, reaching a similar final level (≈0.36) without late-epoch divergence (Figure 5(a)). When applied to held-out normal splits, anomaly scores were largely below the calibrated decision threshold (τ = 0.6484; Figure 5(b); train/val/test sizes: n = 38/32/36), suggesting that the detector maintains a low false-positive rate under normal conditions while still accommodating near-threshold cases.
Finally, we validated end-to-end behavior in a demonstration setting by scoring two representative samples using the same inference pipeline as in deployment. The “demo NORMAL” sample yielded an anomaly score of 0.6338, below the threshold (τ = 0.6484), whereas the “demo ANOMALY” sample produced a score of 1.016, exceeding τ, resulting in the expected binary decisions (Figure 5(a)). This demonstrates that the system can provide
46 Okazaki and Watanuki an interpretable, real-time decision signal grounded in reconstruction error, while maintaining a simple operational interface: a single-threshold scalar score derived from a short speech segment.
Table 1: Summary of imbalance-aware domain-shift metrics between Tamura and non-Tamura cohorts.
Table available in the original PDF paper.
Metric Median q05 q95 Notes Energy distance 0.6028 0.5143 0.7079 Permutation test p ≤ 0.005 (P = 200), balanced resampling (B = 200)
Energy p-value 0.0050 0.0050 0.0050 Lower-bounded by 1/(P+1) due to finite permutations (P = 200) LogReg AUC (CV) 0.8299 0.8021 0.8547 5-fold CV; balanced resampling (B=200) Δ Tamura fraction range (GMM k=3) 0.4550 0.3389 0.6002 Range(max−min) across clusters; per resample (B = 200)
Figure 5: (a) Learning curve, (b) score distribution and thresholding examples.
DISCUSSION
The results indicate that speech collected in Tamura City can serve as a pragmatic relaxed baseline for building relaxation-oriented detectors. Beyond the observed shift in calm scores, emotion-vector analysis revealed a robust cohort-level distribution difference with strong discriminability (AUC = 0.83) under imbalance-aware resampling. This supports the use of Tamura speech as a practical relaxed-reference cohort and highlights the importance of explicitly accounting for domain shifts when deploying relaxation screening models to other regions. In event-level comparisons, the Tamura cohort exhibited higher calm scores (mean difference = 10.43, Hedges’ g = 0.34, Welch’s t-test p = 2.5 × 10⁻⁹; Figure 1). Under participant- aware resampling, which mitigates the imbalanced introduced by the larger non-Tamura cohort, the estimated mean difference remained positive (one- sided p = 3.46 × 10−²), although the 95% CI [−0.92, 18.55] included zero (Figure 2(a)). This pattern suggests a consistent directional shift toward higher calmness, while also indicating that participant-level variability limits
Voice-Based Human Relaxation Assessment 47 the precision of the effect size. A similar trend was observed for the “high- calm” criterion (calm ≥ 95.0): Tamura exhibited a higher high-calm rate with one-sided significance (p = 3.24 × 10−²), whereas the 95% CI [−0.005, 0.259] remained near zero (Figure 2(b)). From a practical perspective, Tamura recordings provide an efficient means of collecting “likely relaxed” speech at scale. However, larger and more balanced datasets are required to improve the stability and precision of effect estimates.
Methodologically, the proposed pipeline provides a coherent response to data scarcity and deployment constraints. Rather than relying on limited and uncertain high-stress labels, we learn the reference distribution of non-stress speech and detect deviations using an AE. This formulation aligns well with operational settings in which atypical states are rare, labels are noisy, and fast, interpretable signals are required. Training was stable over 200 epochs, with training and validation losses converging to similar levels (Figure 5(a)). The decision rule is transparent, based on thresholding the reconstruction- error score at τ = 0.6484. Inference-time examples demonstrate the expected behavior: a near-threshold NORMAL case (0.6338 < τ) and a clearly anomalous case (1.016 ≥ τ) (Figure 5(b)). These results support the interpretability of the system for end users and stakeholders.
Several limitations must be addressed prior to operational use.
(1) Proxy validity: “Calm” is derived from a logistic regression-based emotion estimator rather than human-grounded or clinical labels; thus, the observed shift validates model-defined calmness rather than relaxation per se. (2) Confounding and domain shift: Differences between cohorts may reflect
environmental conditions, recording devices, demographics, speech content, or acquisition protocols. Even with resampling, such factors may bias the estimates. (3) Dependence structure: Repeated measures and heterogeneous numbers of recordings per participant may still influence uncertainty estimates. (4) Threshold robustness: The threshold τ controls the false-positives rate
on current normal splits, but its stability under naturalistic conditions (e.g., spontaneous speech, background noise, variable duration) remains unverified.
Accordingly, the next step is to evaluate agreement with human-centered criteria: including (i) self-reports, (ii) expert ratings, and, where feasible, (iii) lightweight physiological correlates, alongside robustness testing in real- world environments. We also investigate whether subject-specific calibration or domain adaptation can improve reliability without increasing operational burden.
CONCLUSION AND FUTURE WORK This study proposed a data-availability-driven framework for voice-based state monitoring that leverages readily obtainable relaxed speech from Tamura City as a learnable reference distribution and detect deviations, rather than
48 Okazaki and Watanuki directly modeling scarce high-stress speech. Using a logistic regression-based emotion estimator, Tamura recordings exhibited higher calm scores than non- Tamura recordings (event-level mean difference = 10.43, Hedges’ g = 0.34, Welch’s t-test p = 2.5 × 10⁻⁹; Figure 1). After accounting for imbalance and repeated measures via participant-aware cluster bootstrapping with downsampling, the directional effect remained positive (one-sided p = 3.46 × 10−² for Tamura > non-Tamura; Figure 2(a)). Similarly, the “high-calm” rate (calm ≥ 95.0) was higher in Tamura (one-sided p = 3.24 × 10−²; Figure 2(a,b)). Furthermore, analysis of the 8-D emotion-vector under balanced resampling revealed a significant cohort-level distribution shift (energy distance median = 0.6028, permutation p ≤ 0.005) and strong separability (median AUC = 0.8299), supporting the use of Tamura as a distinct relaxed- reference domain (Table 1; Figure 4(a,b)).
We further implemented an AE-based anomaly detector trained on relaxed- speech acoustic features (e.g., log-mel representations) and established a transparent operational rule based on reconstruction-error scoring with a fixed threshold (τ = 0.6484) calibrated to control false positives on held-out relaxed speech. The learning curve demonstrated stable convergence without evident train–validation divergence (Figure 5(a)). Inference-time behavior was readily interpretable, with a near-threshold normal example (0.6338 < τ) and a clearly separated anomaly example (1.016 ≥ τ) (Figure 5(b)). Together, these findings support the feasibility of a “relaxed baseline → deviation detection” framework for low-burden screening.
Future work will focus on human-grounded validation and deployment robustness: (i) evaluating agreement with self-reports and expert ratings under naturalistic speech conditions, (ii) quantifying and mitigating domain- shift factors (e.g., device, environment, demographics, and speech content) across cohorts, (iii) assessing threshold stability and calibration strategies (global vs. subject-adaptive) for controlling false positives, and (iv) extending the pipeline to real-time operation and longitudinal monitoring, where within-person changes may be more informative than absolute scores.
ACKNOWLEDGMENT
The authors sincerely thank the residents of Tamura City, Fukushima Prefecture, Japan for their cooperation in data collection. We also acknowledge our laboratory colleagues and team members for their support in study planning, coordination, recording operations, and evaluation. Finally, we thank the reviewers and organizers for their constructive feedback, which has improved this manuscript.
REFERENCES
Chalapathy, R. and Chawla, S. (2019) ‘Deep learning for anomaly detection: A survey’, arXiv (arXiv:1901.03407). Davison, A.C. and Hinkley, D.V. (1997) Bootstrap Methods and Their Application.
Cambridge: Cambridge University Press. Efron, B. and Tibshirani, R.J. (1993) An Introduction to the Bootstrap. New York: Chapman & Hall.
Voice-Based Human Relaxation Assessment 49 El Ayadi, M., Kamel, M.S. and Karray, F. (2011) ‘Survey on speech emotion
estimation: features, classification schemes, and databases’, Pattern Recognition, 44(3), pp. 572–587. doi: 10.1016/j.patcog.2010.09.020. Gobl, C. and Ní Chasaide, A. (2003) ‘The role of voice quality in communicating emotion, mood and attitude’, Speech Communication, 40(1–2), pp. 189–212. doi: 10.1016/S0167-6393(02)00082-1. Harris, F.J. (1978) ‘On the use of windows for harmonic analysis with the discrete
Fourier transform’, Proceedings of the IEEE, 66(1), pp. 51–83. doi: 10.1109/ PROC.1978.10837. Hinton, G.E. and Salakhutdinov, R.R. (2006) ‘Reducing the dimensionality of data with neural networks’, Science, 313(5786), pp. 504–507. doi: 10.1126/ science.1127647. McFee, B. et al. (2015) ‘librosa: Audio and music signal analysis in python’, in
Proceedings of the 14th Python in Science Conference (SciPy 2015), pp. 18–25. Namkung, H. et al. (2024) ‘Vocal Biomarkers of Mental Stress in Healthy Adults: An Open-Labeled Pilot Study’, Psychiatry Investigation, 21(11), pp. 1018–1027. doi: 10.30773/pi.2024.0131. Veiga, D. de L. et al. (2025) ‘The Fundamental Frequency of Voice as a Potential
Stress Biomarker: A Systematic Review and Meta–Analysis’, Stress and Health, 41(5), e70112. doi: 10.1002/smi.70112. Vincent, P. et al. (2010) ‘Stacked denoising autoencoders: Learning useful representations in a deep network with a local denoising criterion’, Journal of Machine Learning Research, 11, pp. 3371–3408.
LISTED IN THE AHFE DIGITAL BOOKSTORE CATALOGUE
Explore the complete digital volume
Affective and Pleasurable Design
Read this individual research paper free through the original publisher, or explore the full digital proceedings book.
ISBN 978-1-964867-80-9
Explore this ISBN in the AHFE Bookstore ↗Listed in the July 2026 bookstore catalogue; search by ISBN to confirm current availability · Digital book purchase optional