Sandi Baressi Šegota, Ivan Lorencin, Nikola Anđelić, Vedran Mrzljak, Antun Gršković, Juraj Ahel, Klara Smolić, Dean Markić (2025). Data Synthetization and Feature Analysis: A Study in Bladder Cancer Recurrence Data. In: Human Systems Engineering and Design (IHSED2025): Future Trends and Applications. AHFE Open Access, vol. 198, pp. 477–484. https://doi.org/10.54941/ahfe1006801
1 Faculty of Engineering, University of Rijeka, Vukovarska 58, 51000 Rijeka, Croatia ↗
2 Faculty of Informatics, Juraj Dobrila University of Pula, Zagrebaˇcka 30, 52100 Pula, Croatia ↗
3 Department of Urology, Clinical Hospital Center Rijeka, Krešimirova 42, 51000 Rijeka Croatia; Faculty of Medicine, University Of Rijeka, Bra´ce Branchetta 20, 51000 Rijeka, Croatia ↗
The application of synthetic data within the biomedical domain is rapidly gaining momentum, driven by the growing need for robust datasets suitable for machine learning (ML) and statistical modeling. In scenarios where access to real patient data is limited due to privacy concerns or scarcity, synthetic data offers an attractive alternative. These artificially generated datasets aim to mimic the statistical characteristics of original data, enabling researchers to conduct exploratory analysis, develop predictive models, or validate findings without compromising patient confidentiality. However, the increasing use of synthetic data raises several methodological and interpretative challenges, particularly regarding the correct sequence and context for applying statistical analyses. One of the central issues identified in contemporary literature concerns the timing of data analysis relative to the synthetic data generation process. Some studies conduct statistical or ML analyses directly on real datasets and use synthetic data for validation or augmentation. Others, conversely, perform all stages of analysis including feature importance estimation, correlation assessment, and model training on synthetic data. This inconsistency raises the question of whether statistical analysis conducted solely on synthetic datasets yields reliable insights, or whether it constitutes a methodological flaw. The prevailing assumption is that analysis should ideally be performed on real data to preserve statistical integrity, but empirical evaluation of this notion remains limited. In the current study, the authors address this issue by applying a synthetic data generation method specifically, the Tabular Variational Auto encoder (TVAE) to a biomedical dataset focused on bladder cancer recurrence. This dataset includes various diagnostic variables, and the primary goal is to assess how well synthetic data replicates analytical insights drawn from the original data. To achieve this, the authors conduct both correlational analysis and machine learning-based feature importance estimation. The results derived from synthetic datasets of varying sizes are then compared to those obtained from the original data. The findings indicate that while synthetic data can approximate general trends observed in the original dataset, there are notable differences depending on the analytical technique employed. In particular, models such as Random Forest appear more sensitive to variations introduced during the synthetization process. This sensitivity manifests as shifts in feature importance rankings and variability in predictive performance, especially when working with smaller synthetic datasets. On the other hand, simpler statistical methods such as correlation coefficients display more stability, suggesting that some analytical approaches may be more robust to data generation artifacts than others. These observations underscore the importance of methodological caution when interpreting results based on synthetic biomedical data. While synthetic datasets hold considerable promise for advancing data-driven research in biomedicine, they are not a one-size-fits-all solution. The sequence in which synthetic data is introduced into the research pipeline whether before or after statistical analysis—can significantly influence the validity of the findings. As such, researchers must critically assess the suitability of synthetic data for specific analytical tasks and ensure transparency in reporting their methodological choices. Future work should further explore the impact of different generative models and dataset properties on the reliability of synthetic-data-driven insights.
Data synthetization is an extremely useful tool in data science, especially biomedicine where limited amounts of data are common due to well-known difficulties in data acquisition within this domain (Zheng, 2015). While data synthetization has many potential benefits – such as data pseudo- anonymization, creation of more robust machine learning models and overall
model quality increase, an important note remains that this data is not real-world data, and the methods used for synthetization may or may not introduce changes to the data that may not be readily apparent with common analysis techniques (Giles, 2022).
One of the techniques that is commonly used for data analysis is feature importance determination. While this technique is commonly used by machine learning experts as a first step in feature engineering approach, it can also be used as a technique to determine which of the parameters influence the output variable – e.g. which of the patient metrics influence the likelihood of a positive diagnosis (Baressi Šegota, 2024).
A question arises – should the analysis of this be performed only on original data, or can it be done on synthetic data? Most synthetization techniques are designed to copy the statistical distributions within data, which may not copy the exact feature influences as well. This paper tests one of the most commonly used techniques – tabular variable autoencoder (TVAE) on a bladder cancer recurrence dataset, and evaluates the connection between variables with four feature importance metrics in order to determine if there is a change of feature importances between original and synthetized datasets. The paper will first present the used methodology – including the used dataset, synthetization approach and feature importance determination. Following this, the results of feature scores will be presented and discuss, with the final part presenting the conclusions drawn from those results.
METHODOLOGY
Dataset The dataset used in this study is the Bladder Cancer Recurrence dataset (Singh, 2021) - a freely publicly available dataset consisting of data for 294 patients. The data used as the input in this study consists of three data vectors – the number of individual tumors, their size (in centimeters, for largest tumor) and the type of treatmant applied (placebo, pyridoxine or thiotepa – encoded as numerical classes 0, 1 or 2 respectively). The targeted output was a binary target indicating whether a recurrence of the cancer occurred within the patient (0 indicating no recurrence, and 1 indicating one or more recurrences) (Andrews, 1985; Wei, 1989).
Data Synthetization With TVAE The Tabular Variational Autoencoder (TVAE) is a generative model designed to synthesize tabular data while preserving statistical relationships among variables (Li, 2019). It extends the conventional Variational Autoencoder (VAE) framework to accommodate heterogeneous data types—continuous, ordinal, and categorical—commonly found in structured datasets (Ö˘gretir, 2022). The TVAE comprises two neural networks: an encoder qφ(z|x) and a decoder pθ(x|z), where x ∈Rd denotes a data sample in d-dimensional space, and z ∈Rk is a latent variable sampled from a prior distribution. The encoder maps the observed data x to a latent representation z by approximating the posterior distribution, while the decoder reconstructs x from z. A standard
Data Synthetization and Feature Analysis: A Study in Bladder Cancer Recurrence Data 479
Equations and mathematical formulas are available in the original paper PDF.
The objective function of the TVAE is the evidence lower bound (ELBO), which balances reconstruction accuracy and regularization of the latent space (Fonseca, 2023):
−DKL
qφ (z|x) ∥p (z)
logpθ (x|z)
L (θ, φ; x) = Eqφ(z|x) Here, DKL denotes the Kullback-Leibler divergence between the approximate posterior and the prior distribution. The reconstruction term is modeled using appropriate likelihood functions based on data types: Gaussian for continuous variables and categorical cross-entropy for discrete variables. To stabilize training, TVAE discretizes categorical features using one-hot encoding and normalizes continuous features via Gaussian Mixture Models (GMMs), preserving multimodal distributions (Apellániz, 2024). Once trained, synthetic data generation proceeds by sampling latent vectors zi ∼N(0, I) and passing them through the decoder (Wu, 2024):
x pθ(x|zi) (3)
The decoder network outputs parameters for each feature’s distribution, from which synthetic values are sampled. For categorical variables, this corresponds to drawing from a softmax distribution; for continuous ones, from a parameterized Gaussian mixture. TVAE’s capacity to learn complex joint distributions makes it particularly suited for applications requiring realistic data synthesis in structured domains, such as biomedical datasets. Importantly, by training the model on real patient records and subsequently generating new records from latent samples, researchers can perform downstream tasks (e.g., correlation analysis, classification, or feature ranking) without direct exposure to sensitive data, thereby enhancing privacy without entirely sacrificing fidelity (Apellániz, 2024). Nonetheless, like all generative models, the quality of the synthetic data depends on latent dimensionality, network architecture, and data preprocessing pipelines. Empirical validation remains essential to confirm the preservation of meaningful relationships and avoid artifacts that may distort downstream inferences (Tan, 2024).
In this study, the model is developed with training for 25,000 epochs, which achieved the overall data similarity index of 94,56%, indicative of a high-quality data synthetization. A total of 1000 points are synthetized and mixed with the data at different levels (100, 250, 500, 750 and 1000 points), prior the feature influence analysis.
Feature Influence Identifying relevant features is a central task in biomedical data analysis, particularly when working with high-dimensional datasets or synthetic data. Two complementary strategies for quantifying feature importance are examined in this study: statistical correlation-based approaches, and model- based importance estimation using ensemble learning. Correlation methods
quantify the degree of association between individual features and a target variable, typically assumed to be continuous or ordinal. Let xi ∈Rn denote the vector of observations for feature i, and y ∈Rn the corresponding target values. The Pearson correlation coefficient evaluates the strength of a linear relationship between xi and y, assuming both variables are normally distributed (Benesty, 2009):
ρPearson
j = 1(yj −¯y)2 (4) This metric captures only linear dependencies and is sensitive to outliers and non-normality.
The Spearman rank correlation assesses monotonic relationships by comparing ranks rather than raw values. If R(xi) and R(y) are the rank- transformed vectors (Wissler, 1905):
(5)
xi, y
R (xi) , R(y)
ρSpearman
Spearman correlation is robust to outliers and capable of detecting non- linear monotonic trends.
Kendall’s τ measures ordinal association by evaluating the concordance of pairwise observations (Schaeffer, 1956):
τ
xi, y
2 (6) where C is the number of concordant pairs and D is the number of discordant pairs. Kendall’s τ is particularly suitable when the data exhibit ties or a high degree of ordinal noise. In all three methods, the magnitude of the correlation coefficient is taken as a proxy for feature importance. Features with coefficients near zero are assumed to contribute little explanatory power to the target variable.
Random Forests (RF) are ensemble learning models based on collections of decision trees trained on bootstrap samples and random feature subsets (Tanha, 2017). Feature importance in RF models is typically computed using the mean decrease in impurity (MDI), which quantifies how much each feature reduces the Gini impurity or mean squared error across all trees in the forest. Let T denote the set of all decision trees in the ensemble, and for each feature xi, let St
i be the set of splits involving xi in tree t ∈T. The total importance of xi is (Šegota, 2025):
X
X
(s) · Ns
I Nt
where 1
I
(s) is the impurity reduction at split s, Ns is the number of samples reaching that node, and Nt is the total number of samples in tree t. This method captures non-linear interactions and is robust to multicollinearity among features. However, it may exhibit bias in favor of features with more levels or broader numerical ranges (Meyer, 2021). In the current study,
Data Synthetization and Feature Analysis: A Study in Bladder Cancer Recurrence Data 481
feature rankings obtained from correlation-based and model-based analyses are compared to assess the fidelity of synthetic data in preserving variable relevance. Discrepancies in these rankings serve as indicators of structural distortion introduced during the synthetization process.
RESULTS AND DISCUSSION
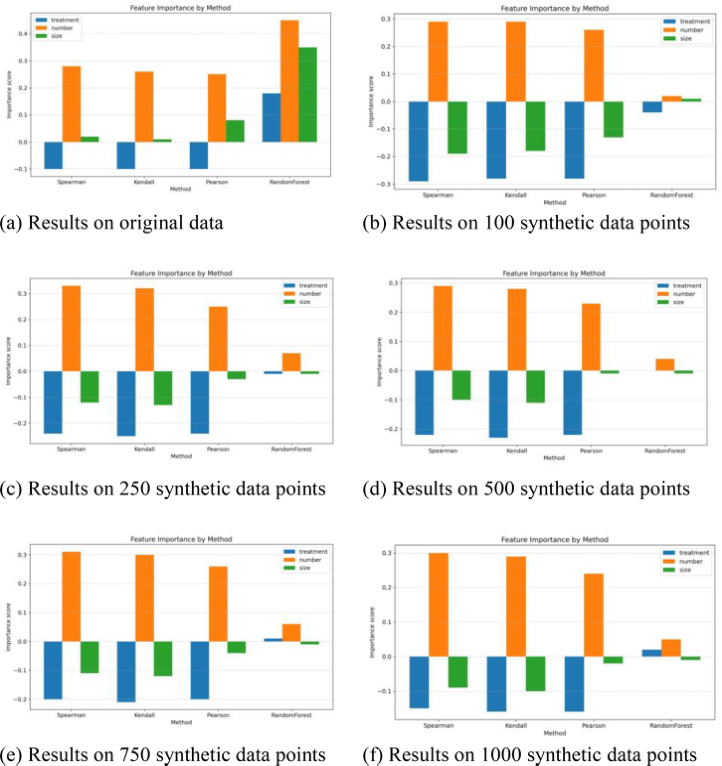
The data shown in Figure 1. demonstrates the scores of various metrics, per each of the targets. The first given graph is the feature importance on the original data, while the remaining ones are evaluations on the synthetic datasets with different amount of data points. While some of the influences are contained, we can see changes in the correlation smaller in case of number of tumors, which remains similar, but higher for other two metrics. Notably, the size metric reverses its correlation into negative. This change is also the case for the random forest feature importance, with the metrics showing a significantly different scores compared to the original dataset.
Figure 1: The comparison of metrics on real and synthetic datasets.
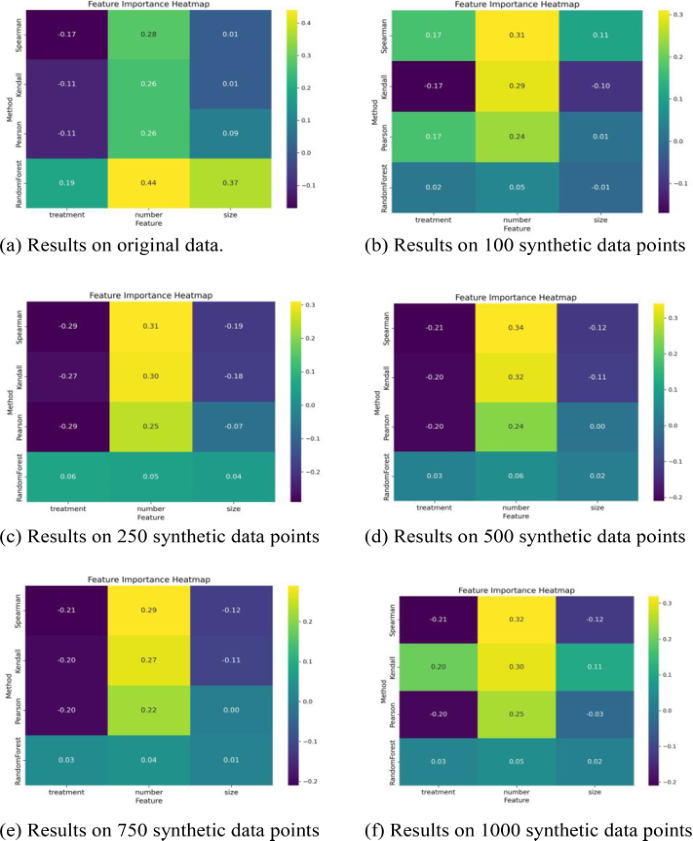
The similar can be seen in Figure 2, where the scores are shown as heatmaps. Each row presents one of the evaluation methods, and each column presents one of the used inputs. The position of the images is the same, with the first (upper left) being the original data heatmap, while the others are calculated on the different amounts of synthetic data. This visualization confirms the previously given one with a clear difference visible between the heatmap for original data and synthetic data. The differences between the different amounts of sznthetic data are present, but not not as pronounced. The differences seen between these subfigures in Figure 2 are expected statistical variation introduced by undersampling data.
Figure 2: The comparison of heatmaps of scores.
Data Synthetization and Feature Analysis: A Study in Bladder Cancer Recurrence Data 483
CONCLUSION
This paper performed the analysis with the goal of testing how the feature influence changes between the original, real-world collected, data and the data that was generated using TVAE synthesizer. The dataset used dealt with the bladder cancer recurrence rates – with three features tested (size of tumor, number of tumors and the type of used therapy. A total of 1000 data points are synthesized, and the evaluation is performed on different sized, randomly selected, subsets of the data.
The results demonstrate significant differences in the measured feature importances between original data and the synthesized data. While the values are consistent amongst the different sized synthetic datasets, they differ greatly from the original data. This points towards an important conclusion and that is that even if the synthetization method shows high performance (standard evaluation techniques – comparison of column shapes and column data pairs shown a high evaluation of over 94% for the used synthetic dataset), it cannot be assumed that the feature influences contained in the synthesized dataset are going to be the same as in the original data, at least within the confines of the presented experimental setup. This means that any feature influence analysis should be performed on original data, and not synthesized.
Future work should focus on the generalization of the presented research – testing different synthetization techniques on different datasets to see if there are synthetization methods that allow for the feature importance to be tested on the synthesized datasets.
ACKNOWLEDGMENT
This research is supported by SPIN project “INFOBIP Konverzacijski Order Management” (IP.1.1.03.0120), “Projektiranje i razvoj nove generacije laboratorijskog informacijskog sustava (iLIS)” (IP.1.1.03.0158), “Istraživanje i razvoj inovativnog sustava preporuka za napredno gostoprimstvo u turizmu (InnovateStay)” (IP.1.1.03.0039), “European Digital Innovation Hub Adriatic Croatia (EDIH Adria) (project no. 101083838)” under the European Commission’s Digital Europe Programme and the FIPU project “Sustav za modeliranje i provedbu poslovnih procesa u heterogenom i decentraliziranom raˇcunalnom sustavu”, and University of Rijeka research grants UNIRI-IZ-25-220 and UNIRI-IZ-25-6.
REFERENCES
Andrews, D. F., & Hertzberg, A. M. (1985). DATA: A collection of problems from many fields for the student and research worker. Springer-Verlag. Apellániz, P. A., Parras, J., & Zazo, S. (2024, August). An improved tabular data
generator with VAE-GMM integration. In 2024 32nd European Signal Processing Conference (EUSIPCO) (pp. 1886–1890). IEEE. Baressi Šegota, S. (2025). Determining the energy-optimal path of six-axis industrial robotic manipulators using machine learning and memetic algorithms (Doctoral dissertation, University of Rijeka. Faculty of Engineering).
Baressi Šegota, S., Andeli´c, N., Štifani´c, J., Štifani´c, D., & Car, Z. (2024). Influence of dimensionality reduction approaches on various machine learning models for a biomedical high-dimension dataset. In Book of Proceedings 3rd Serbian International Conference on Applied Artificial Intelligence (SICAAI). Kragujevac: University of Kragujevac. Benesty, J., Chen, J., Huang, Y., & Cohen, I. (2009). Pearson correlation coefficient.
In Noise reduction in speech processing (pp. 1–4). Berlin, Heidelberg: Springer Berlin Heidelberg. Fonseca, J., & Bacao, F. (2023). Tabular and latent space synthetic data generation: A literature review. Journal of Big Data, 10(1), 115. Giles, O., Hosseini, K., Mingas, G., Strickson, O., Bowler, L., Smith, C. R.,... &
Vollmerteke, S. (2022). Faking feature importance: A cautionary tale on the use of differentially-private synthetic data. arXiv preprint arXiv:2203.01363. Li, S. C., Tai, B. C., & Huang, Y. (2019, December). Evaluating variational autoencoder as a private data release mechanism for tabular data. In 2019 IEEE 24th Pacific Rim International Symposium on Dependable Computing (PRDC) (pp. 198–1988). IEEE. Meyer, A., Albarghouthi, A., & D’Antoni, L. (2021). Certifying robustness to
programmable data bias in decision trees. Advances in Neural Information Processing Systems, 34, 26276–26288. Ö˘gretir, M., Ramchandran, S., Papatheodorou, D., & Lähdesmäki, H. (2022, December). A variational autoencoder for heterogeneous temporal and longitudinal data. In 2022 21st IEEE International Conference on Machine Learning and Applications (ICMLA) (pp. 1522–1529). IEEE. Schaeffer, M. S., & Levitt, E. E. (1956). Concerning Kendall’s tau, a nonparametric correlation coefficient. Psychological Bulletin, 53(4), 338. Singh, U. [utkarshx27]. (2021). Bladder cancer recurrence dataset [Data set]. Kaggle.
https://www.kaggle.com/datasets/utkarshx27/bladder-cancer-recurrences Tan, Y., Zhu, H., Wu, J., & Chai, H. (2024). DPTVAE: Data-driven prior-based tabular variational autoencoder for credit data synthesizing. Expert Systems with Applications, 241, 122071. Tanha, J., Van Someren, M., & Afsarmanesh, H. (2017). Semi-supervised self-
training for decision tree classifiers. International Journal of Machine Learning and Cybernetics, 8(1), 355–370. Wei, L. J., Lin, D. Y., & Weissfeld, L. (1989). Regression analysis of multivariate incomplete failure time data by modeling marginal distributions. Journal of the American Statistical Association, 84(408), 1065–1073. Wissler, C. (1905). The Spearman correlation formula. Science, 22(558), 309–311. Wu, J., Chen, S., Zhao, Q., Sergazinov, R., Li, C., Liu, S.,... & Brunzell, H.
(2024, March). Switchtab: Switched autoencoders are effective tabular learners. In Proceedings of the AAAI Conference on Artificial Intelligence, 38(14), 15924– 15933. Zheng, Y. (2015). Methodologies for cross-domain data fusion: An overview. IEEE Transactions on Big Data, 1(1), 16–34.
LISTED IN THE AHFE DIGITAL BOOKSTORE CATALOGUE
Explore the complete digital volume
Human Systems Engineering and Design (IHSED2025): Future Trends and Applications
Read this individual research paper free through the original publisher, or explore the full digital proceedings book.
ISBN 978-1-964867-74-8
Explore this ISBN in the AHFE Bookstore ↗Listed in the July 2026 bookstore catalogue; search by ISBN to confirm current availability · Digital book purchase optional