Olivier Malhomme, Luigui Salazar, Xianyun Zhuang, Robert Plana, Nicolas Bureau (2025). Enhancing the management of nuclear information systems through graph theory-based methods and human-centered modeling. In: Human Interaction and Emerging Technologies (IHIET 2025). AHFE Open Access, vol. 197, pp. 529–540. https://doi.org/10.54941/ahfe1006746
The integration of digital technologies is crucial for enhancing the efficiency and performance of nuclear facilities throughout their entire lifecycle. However, the nuclear industry faces significant challenges due to its intricate supply chain, resulting in fragmented data exchanges and inefficiencies. The expansion of complex information systems has introduced considerable challenges to data management, leading to inconsistencies and inaccuracies that adversely affect operational performance.To address these challenges, this study proposes an integrated analytical approach that combines graph theory with the Technology-Organization-People (TOP) Model for Human-System Integration (HSI). By incorporating the TOP model, we consider the technological, organizational, and human dimensions of complex sociotechnical systems. In addition, a method is introduced to weight edges in data flow graphs, applied to measure the effect of cognitive load of human tasks.A synthetically generated dataset was used to simulate real-world operations, allowing the application of two graph theory methods: Betweenness Centrality to identify critical nodes and Spectral Clustering to group nodes with similar dataflow characteristics, providing insight into the underlying structure and dynamics of the nuclear dataflow. This approach facilitates a more sophisticated analysis and comparison of results, distinguishing between outcomes with and without cognitive load and supports then more informed data management and flow optimization decisions.The results of this study underscore the effectiveness of combining graph theory methods with human-centered models and also highlight the critical role of human factors in data management strategies that subsequently contribute to improved efficiency, reliability, and performance of nuclear facilities throughout their life cycle.
Nuclear power plants have significant advantages in terms of low-carbon energy production, dispatchable energy source, and essential grid stability (Vu and Hartley, 2022). However, their complex lifecycle involves various stakeholders and critical transitions between phases, such as design, procurement, construction, commissioning, operation, and retirement. The integration of digital transformation technologies, such as digital twins, can optimize each phase of the project lifecycle, enabling real-time data acquisition and analysis on the status of each phase (IAEA, 2015). This facilitates informed decision-making and enhances overall project performance, improving time delivery and reducing costs.
Digital transformation is expected to control budgetary requirements and construction resources demands in nuclear programs, reducing the levelized cost of electricity (LCOE) and shortening lead times critical factors in addressing the urgency of climate change. This will enhance operational flexibility and scalability, crucial for achieving global decarbonization targets by 2050 (Hao et al., 2024).
However, efficiently integrating digital technologies into the nuclear sector presents major challenges due to the complexity of addressing a heterogeneous supply chain lifecycle. Moreover, managing big data effectively requires addressing the core dimensions of big data management— volume, velocity, and variety (Jayakrishna et al., 2016)—which involves processing extensive, real-time datasets originating from diverse sources and presented in various formats. To overcome these challenges, an analytical framework that encompasses both digital data elements and other entities within the information system is essential for achieving a deeper understanding of the complex interactions among these components.
This study proposes the application of graph theory and the Technology- Organization-People (TOP) model, based on the research domain of human system integration (HSI), to analyze nuclear data flow. The TOP model is a comprehensive framework that considers the technological, organizational, and social aspects of complex systems, providing a holistic approach to understanding interactions within the information system (Jayakrishna et al., 2016). This methodology has demonstrated efficient depth analysis to get insight into the complex system information based on a synthetic dataset simulating the real-life nuclear operations (Salazar et al., 2025).
Yet, real world systems such as in the nuclear industry present additional challenging elements and added complexity resulting into a multi- dimensionality of the data flow. Many of them are supported by human activities which are represented in the end by a cognitive load.
This study, based on synthetic data incorporating the journey of activity- related data, proposes the integration of the human factor cognitive load to the workload study performed using betweenness centrality in Salazar et al. (2025). It then allows to measure the overall system load, incorporating the structural load and the human cognitive load, represented as a multidimensional value that considers time pressure and task complexity.
LITERATURE REVIEW
The Complexity of Data Management in the Nuclear Industry Managing data in the nuclear sector is a complex task due to the interdependent systems nature of the field (Jayakrishna et al., 2016). The data generated within a nuclear plant comes from a multitude of interconnected subsystems, technical units, and organizational units such as engineering and operations teams. Each of these systems generates disparate types of data, including real-time sensor data, logs, control signals, and operational data, among others (Hao et al., 2024). Furthermore, the process of mapping and managing the interactions, propagation, and impacts of this data on
Enhancing the Management of Nuclear Information Systems Through Graph 531
other parts of the system can become highly complex due to the significant dependencies and propagation of data involved (Nath et al., 2020).
Another factor contributing to the complexity of this issue is the nature of the data, which is characterized by three key attributes: volume, velocity, and variety (Jayakrishna et al., 2016). Nuclear power plants generate a substantial quantity of real-time data from sensors and control systems. They also produce a significant amount of data related to facilities lifecycles, fuel lifecycles, etc. The processing of this continuous stream of data in an efficient manner while ensuring accurate lineage tracking will necessitate the implementation of a meticulous optimization strategy (Nath et al., 2020). The data may also be presented in a variety of formats, including structured sensor logs, unstructured maintenance reports, time-series data from control loops, design change management, or even manual operator inputs.
Furthermore, it is essential to address the issue of fault tolerance and error propagation, which can result in erroneous data (Vu et al., 2022). Errors in sensor readings, calculation errors in data processing, or incorrect operator inputs can propagate through the system, potentially leading to suboptimal decision-making or safety risks. This complexity underscores the need for a comprehensive approach to managing data in the nuclear sector.
Graph Theory and Its Applications A graph theory approach employs a diagrammatic representation of the entire system, delineating its constituent subsystems and their interactions. This approach facilitates a comprehensive understanding of the system, particularly in comparison to other methodologies such as the analytical hierarchy process, which can prove overwhelming in this context. Additionally, these diagrammatic representations can be readily transformed into matrix format, such as an adjacency matrix or incidence matrix representation (Van Steen, 2010), which can be utilized for mathematical computations that are not feasible with other diagrammatic representations, including flowcharts, cause-and-effect diagrams, and so forth (Jayakrishna et al., 2016). The application of graph theory has already been demonstrated in the dynamic description of systems, including nuclear systems (Salazar et al., 2025). Graph theory models have been developed to assess the performance and interrelationship between the sustainability enablers within an organization, to identify a set of sustainability enablers and attributes that impact a manufacturing organization (Jayakrishna et al., 2016).
The application of graph theory-based methods such as the betweenness centrality has been widely adopted in various fields to analyze complex networks. Research has demonstrated the effectiveness of these methods in various contexts, such as point-set correspondence matching (Carcassoni et al., 2002) and distributed cluster management for dynamic publish/subscribe systems (Tariq et al., 2012). In addition, studies have explored the integration of graph theory with machine learning techniques to improve clustering efficiency (Liu et al., 2015) and scalability. The use of betweenness centrality measures and clustering coefficients has also been extended to identify initial seed sets for network coverage
(Saxena et al., 2023). Collectively, these contributions highlight the versatility and effectiveness of graph theory-based methods in tackling complex network analysis and clustering tasks.
Human System Integration Framework Digital transformation has been accompanied by many technological advances that provide significant opportunities to improve flexibility, efficiency, and human well-being, but also increase complexity and the lack of a comprehensive view of the behavior of autonomous agents.
Human System Integration can be defined as a transdisciplinary field that combines systems engineering, human factors, ergonomics, information technology, and sector specific applications such as aerospace, healthcare, and energy. It focuses on integrating technology, organizations, and people throughout the entire life cycle of complex sociotechnical systems. Unlike traditional usability approaches, HIS involves considering human and organizational factors early in the design and development processes (Boy, 2023). It is relevant to point out that it has become an essential topic in the development of digital transformation towards the industry 4.0 and its projection into Industry 5.0 where people’s roles and responsibilities must be at the center of sociotechnical organizations (Pacaux-Lemoine and Flemisch, 2021). Under the HSI approach, the TOP model supports design and development teams in the rationalization of interdependencies between technology, organizations, and people in which a system is considered as a representation of a natural or artificial entity.
The cognitive load is a key concept of Human System Integration, for complex systems investigations and goes toward a physical and cognitive systemic representation (Human Systems Integration Handbook, NASA, 2021; Guy André Boy et al., 2022). Indeed, Cognitive Load Theory (CLT) offers a foundational framework for understanding how working memory constraints affect learning by categorizing load into intrinsic, extraneous, and germane types (Sweller et al., 2011). Intrinsic load relates to task complexity, extraneous to instructional design inefficiencies, and germane to schema development. Therefore, it proposes an approach to model different dimensions of cognitive load and an evaluation grid. Mental effort, often used as a subjective measure of cognitive load, reflects agent’s perceived task difficulty. Galy et al. (2012) explores that additive interaction between intrinsic, extraneous and germane cognitive load combining difficulty with time pressure and alertness. They show the higher the load, the more important resources are demanded, this high demand resulting in reduced efficiency and performance, and how mental overload result of such combination of elements.
Mohammadian et al. (2022), explore the interaction between humans and technology in control rooms and demonstrated that poor human- technology interaction resulted in high cognitive demand and mental workload, underlining how poorly designed systems may affect performance.
Enhancing the Management of Nuclear Information Systems Through Graph 533
Leppink and Pérez-Fuster (2019) further critique simplistic linear models of cognitive load, proposing that mental effort, time on task, and agent certainty interact in complex, non-linear ways. This perspective underscores the necessity for adaptive working environments that accommodate individual variability in cognitive capacity and emotional state, aiming to optimize instructional efficiency and working engagement.
Synthetic Data Generation The use of real-world data from the nuclear industry is limited by confidentiality and the need to protect assets. Thus, another part of the proposed methodology is the use of synthetic data. The latter has received significant attention in various areas, including healthcare and question answering corpora. In Abay et al. (2018), a privacy-preserving synthetic data release method using deep learning was introduced, highlighting the importance of protecting sensitive information. Also, the generation of synthetic question-answer corpora was introduced by combining question generation and answer extraction models, ensuring roundtrip consistency. In addition, an evaluation of different approaches to generate synthetic patient data was introduced, including probabilistic models and generative adversarial neural networks, addressing the challenge of limited availability of real patient data for research purposes (Goncalves et al., 2020).
Overall, the literature on synthetic data generation showcases the importance of privacy preservation, utility evaluation, and the development of innovative methods for generating synthetic data across various domains.
METHODOLOGY
This study adopts a multidisciplinary approach to address the complexities of data management in the nuclear power plant’s information systems leveraging mainly synthetic data generation, graph theory and Human System Integration (HSI) through the TOP model and the integration of the cognitive load. The methodology is divided into several steps: Synthetic Data Generation
The first step in our methodology involves generating synthetic data that accurately reflects the complex interactions within the nuclear facility. This is achieved through a process that begins with a reduced real-life operational dataset, which serves as a foundation for extrapolation using the nuclear oriented Large Language Model (LLM) SPARK (NuclearnAI, 2024). The LLM model is specifically designed to generate new elements that conform to the same dataset structure, thereby enriching and expanding the original dataset.
Following this, expert knowledge is applied to evaluate the various generated elements, as well as their relationships with one another. This allows for the creation of a comprehensive and meaningful dataset that simulates the complex interactions within the nuclear system’s information environment.
Data Sources and Data Transformers Identification Based on the TOP Model The initial stage of the methodology entails the identification and cataloging of all data sources and data transformers within the system. This process is guided by the HSI TOP model, which emphasizes a comprehensive understanding of the system’s architecture through an analysis of its three constituent components: Technology (T), Organizational structure (O), and People (P). A comprehensive examination of the system’s architecture is conducted to delineate the interactions and dependencies between these three elements. This permits a holistic view of the interconnections between technological systems, organizational processes, and human actors. Technology components are modeled through digital systems and physical sensors that generate and process data. The organizational structure is represented by the various departments and teams responsible for data management and decision-making. Human factors are captured by observing operator actions and their influence on data generation and flow.
Graph Conversion and Visualization The input data is converted into a graph that models complex relationships between different entities. A force-directed layout algorithm (such as Spring or Fruchterman-Rheingold) is used to visualize the graph in a 2D space, where nodes represent individual data sources and transformers, and edges indicate the direction of data flow between them. This graphical representation serves as a visual backbone for our analysis: where the dependencies lie, and how changes in one part of the system affect others.
Overall System Load Quantification Using Betweenness Centrality Measure and Cognitive Load Estimation To identify critical nodes, considering the human factors, and then provide insight into the data flow structure, we define the overall system load quantification integrating two parameters: the graph theory based betweenness centrality to measure the structure load and an estimation of the cognitive load, which is explained later.
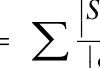
Betweenness Centrality: This measures the extent to which a node lies on the shortest paths connecting other nodes and is commonly used to identify influential or “central” nodes in a network. Here, we interpret betweenness centrality as a distribution of structural load, reflecting their relative importance in facilitating information flow and coordination within the nuclear facility.
S(x,u,y)
Equation reproduced from the original PDF.
S(x,y)
where: - cB (u) is the betweenness centrality of node u - S(x,y) is the set of shortest paths between two nodes x and y - S(x,u,y) is the number of those paths that pass through the node u.
Enhancing the Management of Nuclear Information Systems Through Graph 535
A higher betweenness centrality score indicates a greater potential for a node to control or influence communication and flow within the graph. It can highlight nodes that serve as crucial intermediaries in a network structure, potentially identifying bottlenecks in information or data flow.
Cognitive Load Estimation: To estimate the cognitive load experienced by agents within the facility, we employed a nuanced approach that considers both task complexity and time pressure. The Cognitive Load (CL) reflects the perceived difficulty of tasks performed by individuals, which can significantly impact their performance and decision-making. In this study, we extracted relevant information from dataflow (graph edges) emanating from people nodes to estimate CL. This process involved two key categories defined by nuclear experts: Task Complexity (TC): We identified four distinct subcategories with the validation of nuclear experts.
Action-related keywords (e.g., monitoring, training): 1 point
Data type keywords (e.g., sensor data, control signal, safety alerts): scored on a scale of 1 to 9 points.
These scores are used to quantify the Task Complexity associated with each task. If no known data type is matched, a default base score of 2 is applied.
Time Pressure (TP): We also considered time pressure as a critical factor in cognitive load estimation. Nuclear experts defined three subcategories:
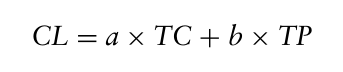
These scores are used to quantify the time pressure associated with each task. The cognitive load is then estimated using a weighted sum of these two components:
Equation reproduced from the original PDF.
Where a is set to 0.7 and b is set to 0.3, giving more relevance to task complexity because of its impact on cognitive load, as explained in the literature review section. People nodes with multiple data flows (graph edges) have a final cognitive value that is the sum of each of them.
At the end, the Overall load system is expressed as:
OSL
node
= α × BC
node
CL(node) norm
norm + β × e
The first element signifies the betweenness centrality value of the node that has undergone normalization, while the second element denotes the exponential behavior of the cognitive load associated with people’s activities, also normalized. α and β are set to 0.5.
RESULTS
The synthetic data simulates the operations of a nuclear facility by capturing the intricate interplay between technological systems and human roles. It represents a complex and highly integrated information environment, where sensor systems continuously collect data from temperature sensors, pressure monitors, level gauges, and radiation detectors. This data feeds into the facility’s control systems, including reactor controllers, cooling unit managers, and power loop regulators, which coordinate essential processes to ensure smooth operation.
To maintain the facility’s integrity, an Automated Maintenance System performs routine tasks efficiently, while a Data Management System stores, processes, and analyzes the vast data generated. High-Performance Computing (HPC) clusters are employed to conduct advanced calculations that support optimization of energy production and resource management. The facility infrastructure includes critical components such as radiation monitoring equipment, cooling systems, turbines, generators, backup power units, and heat exchangers, all of which work in unison to maintain operational stability.
In emergency scenarios, a robust Emergency Response System is activated. These teams include Maintenance and Repair units that address equipment failures, Safety Officers who ensure personnel safety, and Quality Control Specialists who verify that all repairs meet regulatory standards. The Project Manager oversees effort coordination and resources across teams. Supporting this effort, the Radiation Protection Team minimizes exposure risks using specialized protocols and equipment, while the Emergency Response Coordinator ensures efficient communication and collaboration among stakeholders.
Additional specialized roles strengthen operational readiness. The various specialized roles and teams are detailed in Salazar et al. (2025).
As operations scale, SCADA systems offer real-time monitoring and control capabilities, while the Supply Chain Management Unit ensures timely delivery of critical resources.
Subsequently the data can be formatted in the TOP model as explained in the methodology part and it can be converted into a graph.
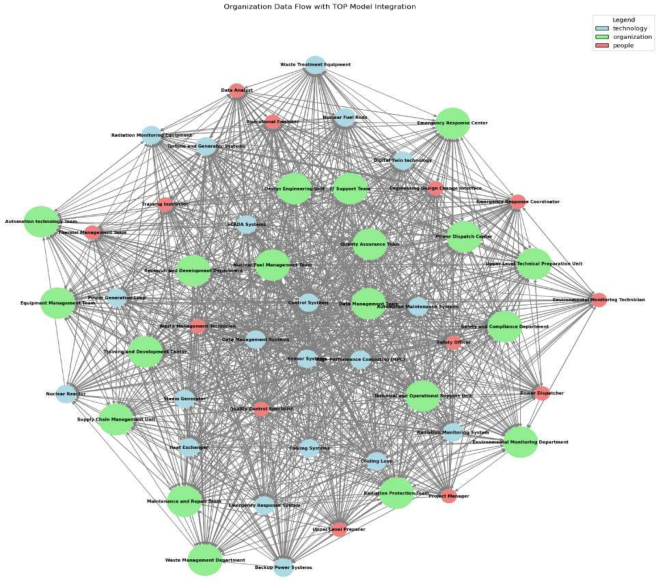
Figure 1 shows the visualization of the graph representing the nuclear complex system information, highlighting the different TOP elements interacting. Then, the community detection algorithm and betweenness centrality analysis are performed.
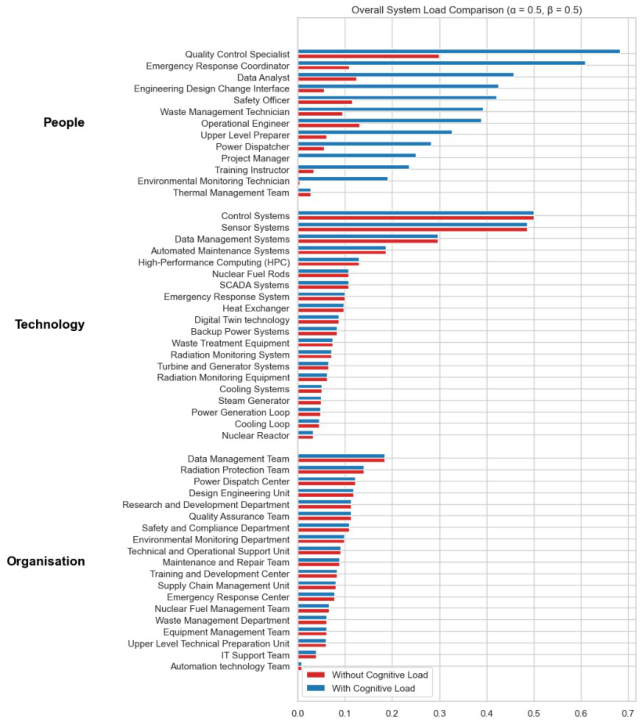
Figure 2 shows a comparison of overall system load between nodes with and without cognitive load integration, where the weighting coefficients α and β are both set to 0.5, indicating equal importance is given to both betweenness centrality and cognitive load in the analysis. The figure illustrates distinct load distribution patterns across People, Technology, and Organization nodes.
Without considering cognitive load (represented by the red bars), the technology nodes exhibit generally higher load. Among them, the Sensor System (0.50) and the Control System (0.49) emerge as the most critical bottlenecks due to their high betweenness centrality.
Enhancing the Management of Nuclear Information Systems Through Graph 537
Figure 1: Graph visualization of the nuclear complex information system highlighting the different TOP elements: organizations (green nodes), technology (blue nodes) and people (red nodes).
However, when cognitive load metrics are incorporated (represented by the blue bars), the overall system load values of People roles increase significantly, becoming the primary system bottlenecks. Notably, the Quality Control Specialist, with a load value of 0.68 (1+0.38), surpasses the technological node Sensor System, becoming the most influential bottleneck in the system. The Emergency Response Coordinator, with a score of 0.6, is now the new second highest score.
A consistent and informative pattern involves groups of interconnected nodes representing Technology, People, and Organization components that collaborate closely and exhibit similar betweenness centrality values when cognitive load is not. This structural similarity may misleadingly suggest that the operational burdens across these domains are comparable.
Moreover, when cognitive load is integrated, people nodes present a sharp increase in overall system load, while their technological and organizational counterparts remain unchanged. These reproducible findings illustrate a widespread phenomenon in which structurally equivalent roles mask the disproportionate cognitive demands placed on human actors.
This finding highlights the risk of underestimating personnel workload when relying solely on structural metrics and further emphasizes the importance of integrating cognitive load considerations to accurately identify critical human bottlenecks in complex socio-technical systems.
Figure 2: Comparison of the overall system load values without cognitive load (red bars) and with cognitive load (blue bars).
CONCLUSION
This study demonstrates the effectiveness of integrating graph theory methods with human-centered modeling to identify and mitigate bottlenecks in nuclear facility data management. By combining the Technology- Organization-People (TOP) model with the graph theory-based betweenness centrality measure and an estimation of cognitive load, we have developed a novel approach that quantifies both structural and human factor load, resulting in a better defined Overall system load.
Our study shows that cognitive load has a strong measurable impact on the quantification of such bottlenecks. Our results show that the proposed methodology is an important step in identifying critical nodes that contribute to structural and human factor bottlenecks in nuclear facility data management. The Overall system load metric provides valuable insights into the underlying complexity of nuclear data flows and highlights areas where improved communication, training, or task optimization can lead to improved efficiency and safety.
Enhancing the Management of Nuclear Information Systems Through Graph 539
The implications of this study are significant because they provide a new perspective on how to address the challenges of nuclear facility management. By considering both network structural and human factors, our approach enables decision makers to develop more effective strategies to optimize data management, reduce cognitive load, and improve overall performance.
In conclusion, this study has demonstrated the potential of integrating graph theory methods with human-centered models to identify and mitigate bottlenecks in nuclear facility data management. The proposed methodology offers a novel approach that combines quantitative and qualitative metrics to provide a comprehensive understanding of complex socio-technical systems.
Perspectives: The use of this method in the nuclear sector, with its very complex systems, led to the necessity of further method development. Quantification and integration of cognitive load pushes integration of human factors to a new level.
To further refine our understanding of system load, subsequent steps will involve extracting and quantifying additional characteristics of the data flow, building upon the cognitive load estimation approach. Specifically, metrics such as completeness, quality, frequency, complexity, and breaks in digital continuity will be considered to provide a more comprehensive representation of the final data flow. This enriched understanding will facilitate more accurate decision-making and optimization in nuclear power plant operations.
Moreover, context mining techniques will be explored in conjunction with SPARK LLM to enhance synthetic data generation capabilities, enabling more realistic simulation scenarios.
Additionally, research into nuclear ontologies will be conducted to improve the TOP model and overall representation of nuclear data, ultimately contributing to a deeper understanding of system dynamics and performance.
ACKNOWLEDGMENT
The authors would like to acknowledge Assystem for the opportunity to share this research.
REFERENCES
Boy, G. A., 2023. An epistemological approach to human systems integration.
Technology in Society, 74, p. 102298. Carcassoni, M. and Hancock, E. R., 2002. Alignment using Spectral Clusters. In BMVC (pp. 1–10). Galy, E., Paxion, J. and Berthelon, C., 2012. What is the relationship between mental workload factors and cognitive load types? International Journal of Psychophysiology, 83(3), pp. 269–275. https://doi.org/10.1016/ j.ijpsycho.2011.09.023 Goncalves, A., Ray, P., Soper, B., Stevens, J., Coyle, L. and Sales, A. P., 2020.
Generation and evaluation of synthetic patient data. BMC medical research methodology, 20, pp. 1–40. Hao, C., Tokuhiro, A., Gomez-Fernandez, M. and Gomez-Torres, A., 2024.
Digitalization as an aggregate performance in the energy transition for nuclear industry. Nuclear Engineering and Technology, 56(4), pp. 1267–1276.
International Atomic Energy Agency, 2015. Milestones in the development of a national infrastructure for nuclear power. International Atomic Energy Agency. Jayakrishna, K., Vinodh, S. and Anish, S., 2016. A Graph Theory approach
to measure the performance of sustainability enablers in a manufacturing organization. International Journal of Sustainable Engineering, 9(1), pp. 47–58. Leppink, J. and Pérez-Fuster, P., 2019. Mental effort, workload, time on task, and certainty: Beyond linear models. Educational Psychology Review, 31, pp. 421–438. Mohammadian, M., Parsaei, H., Mokarami, H. and Kazemi, R., 2022. Cognitive
demands and mental workload: A filed study of the mining control room operators. Heliyon, 8(2). Nath, S. V., Dunkin, A., Chowdhary, M. and Patel, N., 2020. Industrial Digital Transformation: Accelerate digital transformation with business optimization, AI, and Industry 4.0. Packt Publishing Ltd. NuclearnAI (2024) SPARK-mini-instruct. Available at: https://huggingface.co/ NuclearnAI/SPARK-mini-instruct. Pacaux-Lemoine, M. P. and Flemisch, F., 2021, June. Human-cyber-physical system
integration (HSI) in industry 4.0: Design and evaluation methods. In 2021 IEEE 30th International Symposium on Industrial Electronics (ISIE) (pp. 1–6). IEEE. Saxena, R., Paira, P. and Jadeja, M., 2024. CLUS-BET: Improving influence propagation and classification in networks using a novel seed selection technique. Social Network Analysis and Mining, 14(1), p. 81. Sweller, J., Ayres, P. and Kalyuga, S., 2011. Cognitive Load Theory. Explorations in the Learning Sciences, Instructional Systems and Performance Technologies. Cham: Springer. [online] Available at: https://doi.org/10.1007/978-1-4419-8126-4. Tariq, M. A., Koldehofe, B., Koch, G. G. and Rothermel, K., 2012, July. Distributed
spectral cluster management: A method for building dynamic publish/subscribe systems. In Proceedings of the 6th ACM International Conference on Distributed Event-Based Systems (pp. 213–224). Van Steen, M., 2010. Graph theory and complex networks. An introduction, 144(1). Vu, K. and Hartley, K., 2022. Effects of digital transformation on electricity sector growth and productivity: A study of thirteen industrialized economies. Utilities Policy, 74, p. 101326.
LISTED IN THE AHFE DIGITAL BOOKSTORE CATALOGUE
Explore the complete digital volume
Human Interaction and Emerging Technologies (IHIET 2025)
Read this individual research paper free through the original publisher, or explore the full digital proceedings book.
ISBN 978-1-964867-73-1
Explore this ISBN in the AHFE Bookstore ↗Listed in the July 2026 bookstore catalogue; search by ISBN to confirm current availability · Digital book purchase optional