Yasmin Eady, Kofi Kyei, Aldrewvonte Jackson, Bernard Aldrich, Brian Dowtin, Joseph Shelton, Albert Esterline (2024). Measuring How Appropriate Individuals Are for Specific Jobs in a Network of Collaborators. In: Human Factors in Cybersecurity. AHFE Open Access, vol. 127, pp. 41–51. https://doi.org/10.54941/ahfe1004764
We simulate social networks, where undirected edges are mutual friendships, to find the effect of their structure on the aptness of persons for performing a given job. A job J requires a given set of tasks, and each node (person) n can perform a given set of tasks. If the ego network EG of n cannot perform all tasks for J, then n fails on J. Otherwise, n’s score is computed as a weighted sum of measures of centrality, embeddedness (core number), attribute and degree assortativity of the nodes in EG, the degrees of these nodes, and the performance of these nodes on accuracy, speed, and reliability. Experiments were run on random networks from three models across values for an independent variable controlling the number of edges: Erdős-Renyi (ER), Barabasi-Albert (BA), and Watts-Strogatz (WS). Average values for maximum, average, and minimum node scores for each value of the variable for each model were plotted. For all models, the core-number measure largely accounts for the curves’ shapes. Our core-number measure averages over node n’s core number and the averages of n’s neighbors’ numbers and the smallest of these. For ER networks, scores increase with increasing number of edges as nodes become more embedded. For BA and WS networks, there is an initial decrease, conjectured to depend on a person collaborating with many little-embedded helpers, untested and perhaps not well trusted. Our approach for members’ aptness for jobs preserves the security of a secure community, keeping the calculations within the community.
We model social networks where the nodes are individuals and the (undi- rected) edges are mutual friendships explicitly declared between two equal partners. (We use “person” and “node” interchangeably.) Such a network supports collaborative efforts in a particular domain in which the members share competences. Each person is intimately connected with some others who themselves have this connection with others and so on. In our simula- tion experiments, each job requires a certain subset of tasks from a set T of tasks; each person can perform a certain subset of T. A person n and their neighbors comprise the ego network of n, EG. If EG cannot perform all the
tasks required by a given job J, then n fails on J. If n does not fail on J, then we compute a score in [0.0, 1.0] for n. This allows the individuals to be ranked on how well suited they are for J. The score for n combines normalized measures of centrality, embeddedness (core number), similarity of attribute values and of degrees of the nodes in EG (assortativity), the degrees of the nodes in EG, and the performance of the members of EG on accuracy, speed, and reliabil- ity. (A different set of performance properties could be chosen.) A person’s overall score is a weighted sum of these measures, weights determined by the Analytic Hierarchical Process (AHP).
We randomly generated networks from three models, Erd˝os-Renyi, Barabasi-Albert, and Watts-Strogatz, and noted the scores for their nodes as a function of the independent variable governing the number of edges. The averages of the minimum, maximum, and average of the node scores for sev- eral networks for each value of the independent were plotted for each of the three models vs. the respective independent variable; plots were explained by looking at the measures contributing to the scores as functions of the independent variable.
Regarding related work, there is literature on selecting a server (and possi- bly by extension its human owner) for a job that relates to scheduling. Some (e.g., (Tran, 2019)) does emphasize handling the underlying network. Some work on multiagent systems is on a similar problem of selecting an agent for a job, such as (Nyangal, 2016) (where agents are non-human); that work also uses AHP. In Web-based collaboration, there is the notion of helpfulness- based reputation (HBR). De Meo et al. (De Meo, 2017) contrast HBR with centrality-based reputation (CBR), where the most reputable users occupy the most central position in the trust network. They suggest that CBR scores are good predictors of HBR scores.
We have used the concepts presented here with the WebID protocol to produce a framework for determining how apt the nodes are in a simu- lated secure community of servers (Eady, 2023). Nodes are thought of as server-human owner pairs. The WebID protocol (Sambra, 2014) is a secure authentication protocol where a WebID is an URI dereferencing to a user’s RDF profile with foaf:knows triples (reciprocated in our application) linking the subject to a friend. Combining these triples from all in the community describes a secure social network. The work reported in (Eady, 2023) used only Erd˝os-Renyi models. Here we also consider Barabasi-Albert and Watts- Strogatz models, and, unlike in (Eady, 2023), we are concerned with what features of social networks are captured by these models.
Our approach to finding members apt for various jobs preserves the security of a secure community by keeping the calculations within the com- munity no matter what technology is used to establish that security. And our approach accommodates a range of human factors in the form of performance properties.
In the remainder of this paper, the next section explains the measures of a person’s aptness for a job and the AHP weights used to combine them. The third section presents the three random network models used in the exper- iments. The next section presents these experiments and their results and interpretation, and the last concludes and suggests future work.
Measuring How Appropriate Individuals Are for Specific Jobs 43
MEASURES FOR A NODE’S SCORE AND THEIR COMBINATION VIA AHP-DETERMINED WEIGHTS The following are the measures that contribute to the score for a node n in a network G. All values are normalized to be in [0.0, 1.0]. We justify each factor as a contributor to the overall score. They are computed only for a person n who, with their ego network, EG, can handle all the tasks in the job. We also derive the weights for combining these measures using the analytic hierarchy process (AHP).
Equation reproduced from the original PDF.
Centrality: Centrality is a measure of a node’s position in a network. Of the several centrality measures, we use the geometric mean of the eigenvector and betweenness centralities of a node. To find the eigenvector centralities of the nodes in a network G (Bonacich, 2001), form the adjacency matrix A of G then find the principal eigenvector x of A; xm then denotes the eigenvector centrality of node m. Eigenvector centrality is a measure of how influen- tial a node is, intuitively addressing “how many people you know” and “whom you know”. We normalize x by dividing by the sum of its elements so the sum of the elements becomes 1.0; betweenness centrality measures are similarly normalized. The betweenness centrality of a node n for a given net- work G is P
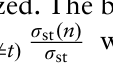
σst where σ st is the number of shortest paths between nodes s and t and σ st(n) is the total number of such paths through n. This measures the extent to which n can regulate the interaction or flow of infor- mation among other nodes. To combine these measures, their geometric mean (Sýkora, 2009) is used. Where xn and Bn are normalized eigenvector and betweenness centrality values of node n, respectively, their geometric mean is √xnBn; again, these values are normalized. This is used since a low value for one measure is not linearly compensate for by a higher value in another, and a small decline in one dimension has the same impact as a small decline in another (United Nations, 2019). Given that the nodes of G are ranked on this mean, the measure used is the average of (1) the relative rank of node n in G and (2) the average of the relative ranks in G of the nodes in EG. The popularity and influence of n makes resources available, and the popularity and influence of n’s neighbors allow them to contribute to n’s aptness for the task.
Core number: For how a network may divide into communities, we may consider a clique, a group of nodes each sharing an edge with every other. This imposes a very strict condition. Something more open-ended is the k- core, a connected set of nodes each joined to at least k of the others. The maximum value of k for the k-cores of a network is its k-core (or simply core) number. The measure we use is the average of (1) n’s core number, (2) the average of the core numbers of the nodes EG, and (3) the minimum core number of any node in EG. If n and their neighbors are well embedded in the network, they have ready access to assistance, which might be jeopardized by an unembedded neighbor.
Average performance: This is the average of the averages of the perfor- mance attributes (speed, accuracy, and reliability) of the nodes in EG. A high value confers an obvious advantage.
Minimum performance: This is the geometric mean of the minimums of the (performance) attributes of the nodes in EG. When people collaborate, minimum values of performance attributes are performance bottlenecks.
Assortativity: If nodes sharing an edge tend to have the same value for an attribute, the network exhibits asssortative mixing, a.k.a. homophily (“birds of a feather flock together”). If they tend to have different values for the attribute, then it exhibits disassortative mixing. We are interested in the case where the attribute has real-number values and the case where the characteristic is the degree of the nodes. In fact, our application consid- ers assortativity on three performance attributes. Our attribute assortativity measure is the average of the assortativity coefficients for EG over the per- formance attributes mapped from [-1.0, 1.0] to [0.0, 1.0]. When those in EG have similar performance values, no one’s work is wasted by others. Our degree assortativity measure is the average of (1) the degree assortativity coefficient of EG as embedded in G and (2) as removed from the rest of G, mapped linearly from [-1.0, 1.0] to [0.0, 1.0]. When a node and its neighbors have similar degrees, no one’s connections are wasted by another’s isolation, within or beyond the group.
Degree: This is the average of (1) the average degree of the nodes in EG and (2) the normalized minimum degree of the nodes in EG. More connections provide access to more resources, and a node in EG whose degree is low might be detrimental to collaborative effort.
Weights determined by AHP (Saaty, 1988) are used to combine our mea- sures to get a single score for each person. The weights for the criteria are computed by first developing the square pairwise comparison matrix C with Cmn (an integer 1–9 or its reciprocal) denoting the importance of the mth criterion relative to the nth criterion; it is an inverse symmetric matrix (Cmn×Cnm = 1). The weights for the criteria are the corresponding entries of the principal eigenvector of C, normalized so that its elements sum to 1.0. The result of applying AHP for our case is shown in Table 1, and our comparison matrix passes the standard consistency check.
Table 1. Weights for the features as determined by AHP.
Table available in the original PDF paper.
Criterion Value Centrality 0.35 Core number 0.23 Average performance 0.15 Minimum performance 0.09 Attribute assortativity 0.07 Degree 0.06 Degree assortativity 0.04
Random Network Models We test our model on randomly generated networks that we interpret as models of friendship networks with undirected friendship links. Regarding
Measuring How Appropriate Individuals Are for Specific Jobs 45
friendship relations as symmetric, De Meo et al. (De Meo, 2017) found that trust networks had large numbers of reciprocated trust links, suggesting an underlying symmetric friendship relation. We image that declaring friendship is a sort of handshake between two equal partners, naturally interpreted as undirected. Such things occur in collaborative efforts and support networks, and the explicit reciprocal friendship provides an undergirding for secure activity. The three models for generating random networks used here are Erd˝os-Renyi (ER), Barabasi-Albert (BA), and Watts Strogatz (WS) networks.
The earliest model for generating random networks is ER model, intro- duced by Erd˝os and Renyi in 1959 (Erd˝os, 1959). In the common version of this model, given n nodes, each possible edge has a fixed probability p of being present, independently of the other edges. There are thus two parame- ters to specify, n and p; for each pair of values, there is a family of networks. One interesting property of social networks is their degree distribution: the number of nodes of the various degrees plotted as a graph number-of-nodes vs. degree. The degree distribution of ER graphs is Poisson (so the number of nodes decays exponentially with increasing degree), so they do not account for the formation of hubs (nodes of high degree). In this respect, they diverge from many social networks, where hubs (such as popular web sites, where edges are in-links) are important. Another property on which many social networks disagree with ER networks is that ER networks tend not to gener- ate triadic closures or triads (where neighbors of a node are neighbors of each other). Instead, they have a low clustering coefficient (ratio of the number of closed triplets—where neighbors of a node are neighbors of each other—to the number of all triples, closed and open).
The BA model became popular for describing network formation based on popularity, as is the case with the Web, where hubs tend to form (Easley, 2010). It was found that the fraction of Web pages that have k in-links is approximately proportional to 1/kc for some constant c (often slightly larger than 2) (Broder, 2000), which decreases much more slowly than a Poisson distribution as k increases. A function that decrease as k to some fixed power is a power law. The BA model (unlike the ER and WS models) exhibits power laws. Power laws result in cases where “the rich get richer” and appear in measures of popularity in many domains besides the link structure of the Web, such as the fraction of books bought by k people (Albert, 2002). The BA model incorporates two important concepts: growth (the number of nodes increases over time) and preferential attachment. The algorithm has (besides the final number of nodes) one parameter, m. The network is initialized with at least m nodes. At each step, a node is added and m existing nodes are selected with probability proportional to their degree as its neighbors (i.e., they are preferentially attached).
The small-world phenomenon is the idea that the world looks small when you note how short the path of friends is from you to anyone, an idea brought to prominence by Milgram’s experiment (Milgram, 1967). The WS model (Watts, 1998) produces graphs with small-world properties and was designed as the simplest possible model that corrects the lack of clustering seen in ER networks, yet it retains the short average path lengths of that model. It interpolates between an ER-like randomized network and a regular ring
lattice (nodes can be arranged in a circle with each node connected to the nearest neighbors on the circle). The construction begins with a ring lattice each node of which has K neighbors, K/2 on each side. Then each edge (u, v) is “rewired” with probability p: replaced with a new edge (u, w) with uniformly random choice of existing node w. The lattice structure results in high clustering while the rewiring produces shortcuts. Watts and Strogatz (Watts, 1998) argued that such a model follows from a combination of two basic notions about social networks: homophily (see “assortativity” above), result in many triads, and weak ties. Granovetter (Granovetter, 1974) found that many of his interviewees heard of their current jobs through contacts often described as acquaintances rather than close friends: “the strength of weak ties.” Limited randomness in the form of long-range weak ties suffices to make the world small (Easly, 2010). The major limitation of the WS model is that it produces an unrealistic degree distribution: a pronounced peak at K. (In contrast, the BA model fails to produce high levels of clustering but does result in hubs.)
EXPERIMENTS We randomly generated networks from the three models, ER, BA, and SW, and noted the behavior of the scores for their nodes as the independent vari- able governing the number of edges for each increased; the number of nodes throughout is 30. For each, a range of values of the independent variable was used in generating the networks. For each value of the variable, 12 networks were generated, and the average of the minimum, maximum, and average of the node scores were plotted. These plots are explained by the behavior of the measures as the independent variable increases. Different random values in a uniform distribution over [0.0, 1.0) were generated for each of the three performance attributes for all 30 nodes in each network. Each node in each network was given as the value of its tasks attribute a list of tasks of random length, between 2 and 5, chosen at random (without replacement) from a list of nine made-up tasks, ‘A’, ‘B’, …, ‘I’. Each run assumed a job with three tasks, ‘B’, ‘D’, and ‘F’. We noted the number of failures (where a person’s ego network cannot handle all the tasks required of the job) for each value of the independent variable of the model in question. Results are presented for ER, BA, and WS networks, in that order.
Using NetworkX’s erdos_renyi_graph (N, p) function, we randomly generated ER networks with 25 equally-spaced values of p from 0.2 to 1.0. Regarding the nodes whose ego networks failed to cover all the tasks required for the job, for p values near 0.1, these were nearly half of all nodes. At p = 0.2, nearly 10% of the nodes fail. This drops off quickly as, just beyond p = 0.4, essentially no nodes fail. We expected that, as p increases, fewer nodes would fail since in general, as p increases, the nodes have more neigh- bors, so they and their neighbors can then handle more tasks. The quick drop just before p = 0.4 and the fact that nearly no nodes thereafter fail were not anticipated. Similar behavior in the number of failures is seen with BA and WS networks in terms of their own independent variables, and the explanation is the same.
Measuring How Appropriate Individuals Are for Specific Jobs 47
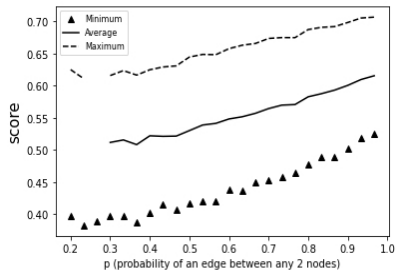
Figure 1 shows the averages (over 12 runs) of the minimum, average, and maximum scores versus the 25 values of p, from 0.2 to 1.0. We expect all three measures to increase since, as p increases, each node has access to more resources. The slope of the average vs. p line is 17% greater than that of the maximum vs. p line, and the slope of the minimum vs. p line is 24% greater than that of the average vs. p line. This closing of the gaps as p increases happens because, as connections get denser, fewer nodes are sig- nificantly impeded by lack of access to resources. Regarding the rankings of the nodes, the two centrality measures give somewhat different rankings, and their geometric mean gives yet a third order, but the rankings are reasonably similar.
Figure 1: Score vs. p.
Looking at the measures contributing to the weighted averages forming the node scores, the measure with the largest weight, centrality, changed little with increasing p. The measure with the next greatest weight, core number, showed a significant increase with increasing p: as the probability of an edge between any two nodes increases, typical nodes become more embedded in the network and are less likely to be connected with not very embedded nodes. The measure with the third highest weight, average performance, changes little with p. The remaining measures have small impacts and only two vary significantly with p: minimum performance decreases with p (as p increases, the typical ego network has more nodes and so more values that could be small) and degree increases significantly with p (as more edges are formed overall but the number of nodes is fixed).
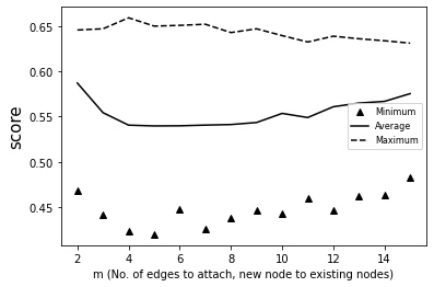
Using NetworkX’s barabasi_albert_graph (N, m) function, we ran- domly generated 30-node BA networks with, as values of m (the number of edges connecting a new node to existing nodes), integers from 2 to 15. Figure 2 shows the averages (over 12 runs) of the minimum, average, and maximum scores versus the 14 values of m, from 2 to 15. The maximum scores are slowly decreasing nearly linearly in m. The curve of the average scorers is mildly concave upwards with a minimum near m = 7, and the curve of the minimum scores is roughly concave upwards (with a minimum at m = 8), with an outlier on the large side at m = 6.
Looking again at the measures contributing to the weighted averages form- ing the node scores, again the measure with the largest weight, centrality, changed little with increasing m. The curve for the measure with the next greatest weight, core number, is concave upward and apparently largely accounts for the shapes of the average and minimum curves. Since the num- ber of edges in the network increases as m increases, we might expect nodes to become more embedded in the network (i.e., come to have a higher core- number measure) as m increases. Why this measure should decrease initially is not so clear, but a conjecture is that it has to do with the formation of hubs. Our core-number measure averages over not just the core number of a node n but also the averages of n’s neighbors’ core numbers and the smallest of these numbers. As a hub n forms, it connects to less embedded nodes. Initially, these neighbors will not be well embedded, bringing down the measure for n. The next highest weighted measure, average performance, is flat, and the next, minimum performance, generally decreases with increasing m, perhaps accounting for the slightly negative slope of the maximum curve. (We expect minimum performance to decrease as the number of nodes in an ego graph typically increases with m, giving a larger population for the minimum.) The remaining measures (attribute assortativity, degree, and degree assortativity) increase with increasing m but evidently do not impact the maximum curve enough to overcome its slight decrease. We expect degree to increase with increasing m as that results in more edges for the fixed number of nodes. And we conjecture that the reason the assortativity measures increase with degree is that a larger number of nodes in an ego graph makes it less likely that any node stands out in attribute values or degree.
Figure 2: Score vs. m.
We used NetworkX’s watts_strogatz_graph (N, K, p) function to randomly generate WS networks. Here K is the number of nearest neighbors to which each node is initially joined in a ring topology (half on one side, half on the other), and p is the probability that each edge is “rewired” (i.e., have a new vertex randomly chosen as its other endpoint). We fixed p at 0.3 as this rewired a significant number of edges yet maintained much of the ring. The values of K were even integers from 2 to 16.
Measuring How Appropriate Individuals Are for Specific Jobs 49
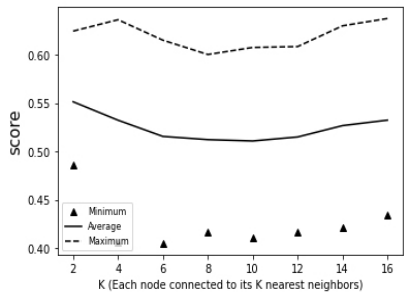
Figure 3 shows the averages (over 12 runs) of the minimum, average, and maximum scores versus the eight values of K. Measures of centrality involved only betweenness centrality as calculations of eigenvector centrality on our WS networks generally failed to converge. The curve for average scores is similar to that for the BA networks: it is concave upward, here with a mini- mum at K = 10. The curve for the minimum scores again is somewhat similar to that for the BA networks: it is roughly concave upward, here with a min- imum at K = 8. The curve for the maximum is only roughly linear and is roughly flat, lacking the slightly negative slope of the maximum BA curve.
Figure 3: Score vs. K.
Regarding the measures contributing to the weighted averages forming the node scores, again, the centrality measure is basically flat, and most of the concave-upward shape of the average and minimum curves can be attributed to the core-number measure. Regarding the latter measure, similar to the BA case, the number of edges increases with K, so we expect nodes to become more embedded as K increases, and what is hard to explain is why this mea- sure decreases initially. The conjecture here is that, when K is small, edges tend to connect to nodes of low degree, and adding a few more edges just connects a node to more low-degree nodes. When the small world starts to fill up, however, nodes become more embedded in the network. Average performance, as with the other network families, is flat. Similar to the BA case, minimum performance decreases and attribute assortativity, degree, and degree assortativity increase with increasing K; explanations here are as with the BA case.
CONCLUSION AND FUTURE WORK We model social networks where the nodes are individuals and the (undi- rected) edges are mutual friendships explicitly declared between two equal partners. They are simulated to find the effect of their structure on the aptness of each person in the network for performing (with help from their friends) a particular job. We compute a score in [0.0, 1.0] for a node with ego net- work EG as a weighted sum (weights per AHP) of measures of its centrality,
embeddedness (core number), similarity of the attribute values and degrees of the nodes in EG (assortativity), the degrees of the nodes in EG, and the performance of the members of EG on the properties accuracy, speed, and reliability. Experiments were run on randomly generated networks from three models across a range of values for an independent variable controlling the number of edges: Erd˝os-Renyi (ER) with variable p (the probability of an edge between any pair of nodes), Barabasi-Albert (BA), with m (the number of edges connecting a new node to existing nodes), and Watts-Strogatz (WS), with K (the number of nearest neighbors to which each node is initially joined in a ring topology). Random values were provided for performance proper- ties. The tasks each person can handle were randomly selected from a set of nine tasks; a test job was defined with three of these tasks. For each model, for each value of the independent variable, the averages of the maximum, minimum, and average scores of the nodes in 12 generated networks were plotted.
For all three models, the measure with the second greatest weight, core number, largely accounts for the behaviours of the curves. Note that our core- number measure averages over not just the core number of a node n but also the averages of n’s neighbors’ core numbers and the smallest of these num- bers. For the ER model, all scores significantly increased nearly linearly with increasing p. The core-number measure increases with increasing p because, with more edges, typical nodes become more embedded in the network and are less likely to be connected with not very embedded nodes. For the BA model, the maximum curve had nearly negligible decrease with increasing m while the average and minimum curves were roughly concave upward. Regarding the core-number measure, we conjecture that the initial decrease occurs because, as a hub forms, it connects to less embedded nodes; initially, these neighbors will not be well embedded, bringing down the core number measure. Finally, the shapes of the curves for the WS model are roughly as with the BA model. For why the core-number measure decreases initially, the conjecture here is that, when K is small, edges tend to connect to nodes of low degree, and adding a few more edges just connects a node to more low-degree nodes. When the small world starts to fill up, however, nodes become more embedded in the network. Intuitively, we would expect that, as the number of edges increases, an arbitrary node would become more embedded even at small values of the independent variable. For both BA and WS networks, the decreasing value of our core-number measure of a node n for small values of the independent variable, however, depends critically on n having more neighbors who are less embedded. In that region, n depends on helpers that are little embedded. The person ends up collaborating with many others who are untested and perhaps not well trusted.
In the future, we intend to investigate how scores vary with additional performance properties, with different distributions of these properties, and with interactions between these properties and network properties. We shall also consider measuring different structural features, such as clustering coeffi- cient and network diameter, but many of these concepts are not independent. Finally, we shall consider other applications, besides the WebID-based com- munities mentioned in the introduction, where our approach to finding
Measuring How Appropriate Individuals Are for Specific Jobs 51
members apt for various jobs preserves the security of a secure community by keeping the calculations within the community.
ACKNOWLEDGMENT
This research is supported by the National Science Foundation (NSF), award number 1900187. Any opinions, findings, and conclusions or recommen- dations expressed in this material are those of the author(s) and do not necessarily reflect the views of NSF.
REFERENCES
Albert, R. and Barabási, A.-L. (2002) ‘Statistical mechanics of complex networks’, Reviews of Modern Physics, 74, pp. 47–97. Bonacich, P., and Lloyd, P. (2001) ‘Eigenvector-like measures of centrality for
asymmetric relations’, Soc. Netw. 23(3), pp. 191–201. Broder, A., Kumar, R., Maghoul, F., Raghavan, P., Rajagopalan, S., Stata, R., Tomkins, A., and Wiener, J. (2000) ‘Graph structure in the Web’, 9th Int. World Wide Web Conf., pp. 309–320. De Meo, P., Musial-Gabrys, K., Rosaci, D., Sarnè, G. M. L., and Aroyo, L.
(2017) ‘Using centrality measures to predict helpfulness-based reputation in trust networks’, ACM Transactions on Internet Technology 17(1), Article 8. Eady, Y., Kyei, K., Esterline, A., and Shelton, J. (2023) ‘Measuring suitability of servers for jobs in a simulated distributed system’, Int. Conf. on Electrical, Computer, Communications and Mechatronics Engineering (ICECCME 2023), Tenerife, Spain. Easley, D. and Kleinberg, J. (2010) Networks, crowds, and markets: reasoning about
a highly connected world, Cambridge Univ. Pr. Erd˝os, P.; Rényi, A. (1959) ‘On random graphs. I’, Publicationes Mathematicae. 6 (3–4), pp. 290–297. Granovetter, M. (1974) Getting a job: a study of contacts and careers. U. of Chicago
Pr. Milgram, S. (1967) ‘The small-world problem’, Psychology Today, 2, pp. 60–67. Newman, M. 2018. Networks. Oxford University Press. Nyanga1, L., van der Merwe, A. F., Tsakira, C., Matope, S., and Dewa, M. T. (2016) ‘Design of a multiagent system for machine selection’, Int. Conf. on Competitive Manufacturing (COMA’16). Saaty, T. L. (1988) ‘What is the analytic hierarchy process?’, in Mitra, G. et al. (eds.)
Mathematical models for decision support. NATO ASI Series, 48. Berlin: Springer. Sambra, A., Story, H., and Berners-Lee, T. (2014) WebID, Web identity and discovery. W3C Editor’s Draft. Available at: https://dvcs.w3.org/hg/WebID/raw-file/tip/ spec/identity-respec.html (Accessed: 12 Jan. 2024). Sykora, S. (2009) Mathematical means and averages: basic properties, Vol. III, 3.
Stan’s Library, Castano Primo, Italy. Tran, H. A., Souihi, S., Tran, D., Mellouk, A., and A. Mabrese, A. (2019) ‘A new server selection method for smart SDN-based CDN architecture’, IEEE Communications Letters, 23(6), pp. 1012–1015. United Nations Development Programme, Frequently asked questions human development index (HDI), Technical Report, 2019. Available at: https://www.undp.org/sites/g/files/zskgke326/files/migration/tr/UNDP-TR-EN- HDR-2019-FAQS-HDI.pdf (Accessed: 1 Feb. 2024). Watts, D. J. and Strogatz, S. H. (1998) ‘Collective dynamics of “small-world”
networks’, Nature, 393, pp. 440–442.
LISTED IN THE AHFE DIGITAL BOOKSTORE CATALOGUE
Explore the complete digital volume
Human Factors in Cybersecurity
Read this individual research paper free through the original publisher, or explore the full digital proceedings book.
ISBN 978-1-964867-03-8
Explore this ISBN in the AHFE Bookstore ↗Listed in the July 2026 bookstore catalogue; search by ISBN to confirm current availability · Digital book purchase optional