Ren-Jieh Kuo, Chih-Wen Shih, Chong-Hao Wang (2023). Sitting posture recognition for smart chair. In: Health Informatics and Biomedical Engineering Applications. AHFE Open Access, vol. 78, pp. 80–87. https://doi.org/10.54941/ahfe1003458
In recent years, the relationship between sitting posture and health has been paid attention to by researchers, since a person spends about 90% of a day sitting except for sleeping time, and the prolonged sitting is one of the important causes of musculoskeletal diseases. Basically, the different sitting postures caused by sitting for a long time will cause different pressure problems on the spine. Thus, this study intends to accurately predict sitting posture to reduce the damage caused by sitting posture using random forest. A smart chair with eight pressure sensors provided by a case company in Taiwan is applied to collect pressure data of various sitting postures in order to develop a prediction model to predict the sitting posture. Since random forest also owns the capability of feature extraction, it is also employed to find unnecessary sensors to reduce the cost of smart chair and further achieve higher prediction accuracy. The results showed that random forest can yield better results for the current problem compared with other methods. In addition, after the feature extraction via random forest, it can be known that there is indeed a sensor that can be eliminated. The accuracy can be enhanced from 90.70% to 91.36%.
A person spends about 90% of a day sitting except for sleeping time, and the prolonged sitting is one of the important causes of musculoskeletal dise- ases (Grandjean and Hünting, 1997; David et al., 2012; Donald et al., 1999; Wong et al., 2010). Consequently, prolonged sitting has become a common cause of diseases associated with the musculoskeletal system. In addition to applying a different amount of pressure to the spine, prolonged sitting also brings a number of health problems, such as lumbar pain, thigh masses, and cardiovascular diseases. In particular, sitting for prolonged periods of time with bad posture, such as sitting hunched over or cross-legged, can lead to lower heart rates and poorer blood circulation, which indirectly affect the lymphatic system, cause lymphatic obstruction in subcutaneous tissue, promote the accumulation of interstitial fluid in subcutaneous tissue, and prevent toxic substances from being effectively removed (Andrew et al., 2018;
Castanharo et al., 2014; Chris et al., 2006; Hadgraft et al., 2016; Pynt et al., 2001). These can then result in chronic diseases such as diabetes and hypertension (Dunstan et al., 2012).
The ergonomic sitting posture, also known as the most ideal sitting posi- tion, is an important goal in the design of every chair. Without helpful devices for support or balance, it is difficult for the body to remain in an upright posture while sitting for long period of time. In the healthiest sitting posi- tion, the torso and the thighs should remain at a 135-degree angle in order to minimize the pressure applied to the intervertebral discs and make the sur- rounding muscles and ligaments more relaxed (Bashir et al., 2006). However, because long-time sitting and working activities cannot be avoided, wrong sitting posture should be reduced.
Thus, this study intends to accurately predict sitting posture to reduce the damage caused by sitting posture using data mining technique, random forest. A smart chair with eight pressure sensors provided by a case company in Tai- wan is applied to collect pressure data of various sitting postures in order to develop a prediction model to predict the sitting posture. Since random forest also owns the capability of feature extraction, it is also employed to find unnecessary sensors to reduce the cost of smart chair and further achieve higher prediction accuracy. This study also collected data on the sitting postu- res of males and females to explore whether the weight of different gender affects the pressure value or not.
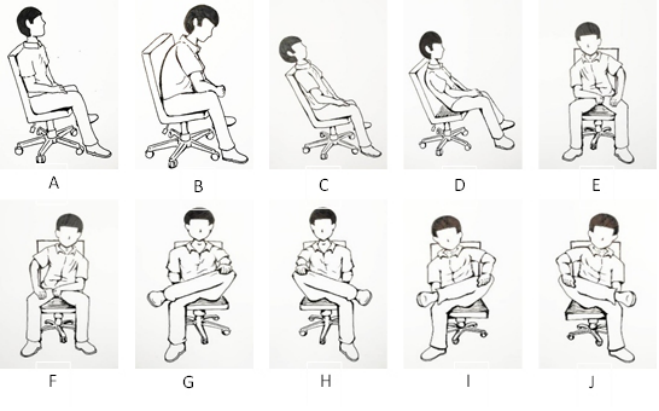
CLASSIFICATION OF SITTING POSTURE USING SMART CHAIR In the current study, a sitting posture recognition framework is presented. It is consisted of (1) data collection, (2) feature selection, and (3) classifica- tion. For data collection, this study compiled 10 sitting postures from existing literature (Martins et al., 2016) including upright (A), leaning forward (B), slouched backward (C), leaning backward (D), leaning left (E), leaning right (F), right leg crossed over left leg (G), left leg crossed over right leg (H), right leg crossed over left leg and torso leaning to the right (I), left leg crossed over right leg and torso leaning to the left (J).
When people sit in a chair for long periods of time, they tend to lean forwards or backwards, such as in postures A, B, C, and D, which applies a different amount of pressure on the spine. Postures E and F are the most common sitting postures. As for crossing one’s legs, statistics show that 21% of people around the world have a habit of crossing their legs, the primary consequence of which is obstructed blood flow in the legs, thereby causing varicose veins. This is also generally accompanied by a deformation in the pelvis, scoliosis, and, in severe cases, herniated discs. Therefore, this study also attached importance to postures G, H, I, and J. Examples of the sitting postures are displayed in Figure 1.
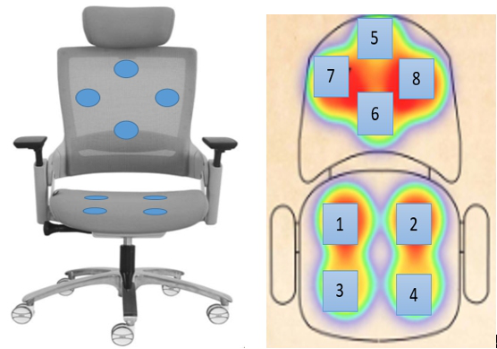
In addition, in the preparation of the smart chair experimental device, this study employed a smart chair manufactured by an ergonomics company in Taiwan. The chair itself has eight sensors. Pressure values were collected from the sensors as participants sat in the ten different postures in the smart chair. The collected data were then sent to a smartphone via an APP. Figure 2
Figure 1: 10 kinds of sitting posture pictures.Figure 2: The smart chair and sensor locations.
shows the locations of the eight sensors and the corresponding sensor values. In response to the pressure, the system displays the pressure values using different colors, including blue, indigo, yellow, orange, and red, with blue indicating the lowest level of pressure and red indicating the highest.
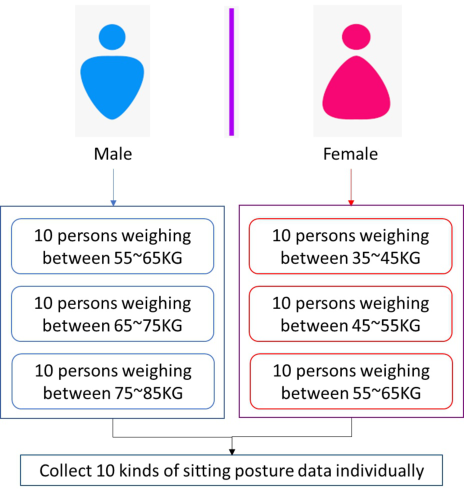
This study collected data using the smart chair, whereby participants had to sit in the ten sitting postures. A total of 600 samples of data were collected in the experiment, including 10 different sitting postures from 30 men and 10 different sitting postures from 30 women. The bone developments of men and women differ, which subject different areas to different pressures in different sitting postures. We also collected the height and weight of each participant. The overall physiques of the participants in this study are shown in Figure 3. The detailed explanations are as follows:
Sitting Posture Recognition for Smart chair 83
Figure 3: Experimental design.
(1) The men and women were tested individually. (2) The men were divided into weight ranges of 55-65, 65-75, and 75–85 kg, whereas the women were divided into weight ranges of 35-45, 45-55, and 55–65 kg. There were 10 participants tested for each weight range. (3) The participants adopted the ten sitting postures mentioned in Section 3.2: upright, leaning forward, slouched backward, leaning backward, leaning left, leaning right, right leg crossed over left leg, left leg crossed over right leg, right leg crossed over left leg and torso leaning to the right, and left leg crossed over right leg and torso leaning to the left. (4) The participants sat in each posture for 30 seconds and then switched to the next posture in the above order. The data from the first 10 seconds were not adopted because the pressure of shifting positions could cause swinging.
This study also conducted the reliability and validity analysis for the par- ticipant data. The results of Cronbach α is 0.751, which means that the collected participant data were reliable and consistent.
For feature selection, it is based on the decision tree result. By using the mean decrease Gini value, we can decide whether a specific feature should be eliminated or not.
Then, after the unimportant features were eliminated, a random forest method was applied to learn the relationship between input features and class labels. This can formulate a sitting posture recognition model. Random forest uses the same basic classifier to generate repeated multiple classes with the
same data and has higher accuracy than other classification algorithms. The implementation process is as follows: (1) Bagging (also known as bootstrap aggregating) was used to generate the training data from the raw data: With 600 samples (30 men and 30 women and 10 sitting postures for each individual) and 8 variables (8 sensors) for each sample, training data comprising several samples could be obtained using random sampling with replacement. A total of 100 samples were generated. (2) For each training data set, different random vectors θn were generated, and three random variables were selected (m<M). Splitting was attem- pted using each variable, and the one with the lowest Gini coefficient was used for splitting to generate a CART (Breiman et al., 1984). (3) Each tree was allowed to grow with no pruning. (4) For the combinations of the results of the n trees, this study performed classification using the collected data and simple majority voting (Ho, 1995; Breiman, 2001).
ANALYSIS AND COMPARISON OF RESULTS This study performed data analysis using classification. Establishing a clas- sification model can give us an understanding of what features the data belonging to each class have. From the classification model established using classification, this study can deduce the rules of the classes. These rules are the factors that influence data classification. Different classification methods work in different ways, and their logic concepts vary as well. Thus, to classify a massive quantity of data, existing data were divided into two groups: trai- ning samples and testing samples. In the first stage, only the training samples were used to establish the model, and the testing samples were left for the second stage to evaluate the accuracy of the classification model. Once the classification model has been established, the testing samples can be used to test whether the classification model can accurately identify to which classes the testing samples belong. The accuracy of the classification model can serve as the evaluation index of this study.
This study has a total of 600 samples for the models to classify. The models include random forest, support vector machine (SVM) (Meyer et al., 2018), BayesNet (Muralidharan and Sugumaran, 2012), and an artificial neural network (ANN). During classification, this study adopted 6-fold cross- validation for the testing samples and training samples. The result showed that the accuracy of random forest when applied to the training samples could reach 96.50%.
Furthermore, this study compared the training samples and testing samples of the male and female participants using random forest. With 300 samples from the men and women, respectively, this study employed 10-fold cross- validation; i.e., this study divided the 300 samples into 10 equal parts. The first part (30 samples) served as the test data for validation in which the means were calculated to obtain the accuracy of the model when applied to the testing samples and the training samples, as shown in Table 1.
Sitting Posture Recognition for Smart chair 85
Table 1. Computational results using random forest for male and female.
Average Accuracy (Training) Average Accuracy (Testing) Random forest 93.16% 90.70% New random forest 93.97% 91.36% SVM 87.67% 85.51% New SVM 88.11% 85.67% BayesNet 88.40% 86.69% New BayesNet 88.77% 86.32% ANN 81.84% 79.34% New ANN 82.96% 79.83%
For comparing random forest, SVM, BayesNet and the ANN, the mean accuracy values are shown in Table 2. The random forest can achieve the highest mean value, which reaches 93.16% and 90.70% for training and testing data, respectively. Besides, it also has the lowest standard deviation of 0.01957, thereby indicating that it has greater stability compared to the other classification models.
For feature selection, according to random forest, we can obtain the vari- able importance using mean decrease Gini values. The mean decrease Gini values for eight sensors are 20.613308, 22.313221, 18.615107, 19.561303, 7.543261, 3.12314, 11.323218, and 13.544102, respectively. So, Sensor 6 is less importance and it can be eliminated. However, if we continue to eliminate sensor 5, then the classification performance become worse. Thus, this study decided to eliminate only one sensor. In Table 2, word “new” means that the model does not use sensor 6. The result shows that eliminating sensor 6 can yield higher accuracy for all the models compared with models which con- sider all 8 sensors. But, random forest is still the best model whose training and testing accuracies are 93.97% and 91.36%, respectively.
CONCLUSION
This study has proposed a sitting posture recognition method by using random forest using smart chair. This study considered that the weight diffe- rences between men and women could influence the pressure values collected by the sensors. In the data analysis results, the mean accuracy of the models when applied to the training samples from the men and women was 94.36% and 93.29%, respectively. Regarding the classification performance, this study found that random forest was indeed more accurate than the other classification methods, both before and after feature extraction, where a cha- racteristic variable was removed from the analysis. For feature extraction
with random forest, this study found that the Gini value of sensor 6, the cha- racteristic variable, was lower than those of the other seven sensors. After data processing, this study used the other seven variables to perform classifi- cation, the results of which showed that random forest was still more accurate than the other classification methods and that the mean accuracy of the data from random forest increased by 2.46% from 96.5% to 98.96%.
In the future works, increasing the diversity of the data may let the model more robust. In addition, more sensor locations can be tested in order to obtain the better recognition performance. Definitely, different classification algorithms can also be tried.
REFERENCES
Andrew, P., Julie, A., Moseley, G. L., & Paul, W. (2018). Different ways to balance the spine in sitting: Muscle activity in specific postures differs between individuals with and without a history of back pain in sitting. Clinical Biomechanics, 52, 25–32. Bashir, W. A., Torio T., Smith F., Takahashi K., & Pope P. (2006). Sitting positions
using whole-body psitional. National Center for Biotechnology Information. Breiman, L., Friedman, J. H., Olshen, R. A., & Stone, C. J. (1984). Review of Classification and Regression Trees. Biometrics, 40(3), 874–874. Breiman, L. (2001). Random forests. Machine Learning, 45(1), 5–32. Castanharo, R., Duarte, M., & McGill, S. (2014). Corrective sitting strategies: An
examination of muscle activity and spine loading. Journal of Electromyography and Kinesiology, 24(1), 114–119. Chris J., Paul, F. G., & Kleinrensink, G. J. (2006). Functional aspects of cross-legged sitting with special attention to piriformis muscles and sacroiliac joints. Clinical Biomechanics, 21(2), 116–121. David, W., Howard, B., Genevieve, N. H., Owen N. (2012). Too much sitting – A
health hazard. Diabetes Research and Clinical Practice, 368–376. Donald, D., Sanghak, O., Arthur, C., Deed, E., & Stephan, J. (1999). Sitting biomechanics Part I: Review of the literature. Journal of Manipulative and Physiological Therapeutics, 22(9), 594–609. Dunstan, D. W., Kingwell, B. A., Larsen, R., Healy, G. N., Cerin, E., Hamilton, M. T.,
& Owen, N. (2012). Breaking up prolonged sitting reduces postprandial glucose and insulin responses. Diabetes Care, 35(5), 976–983. Grandjean, E., & Hünting, W. (1997). Ergonomics of posture—Review of various problems of standing and sitting posture. Applied Ergonomics, 8(3), 135–140. Hadgraft, N. T., Heal, G. H., Owen, H., Elisabeth, A. H., & Lync, B. M. (2016).
Office workers’ objectively assessed total and prolonged sitting time: Individual- level correlates and worksite variations. Preventive Medicine Reports, 4, 184–191. Ho, T. K. (1995). Random decision forests. In Proceedings of 3rd International Conference on Document Analysis and Recognition, 1, 278–282. Martins, L., Ribeiro, B., Almeida, R., Pereira, H., Jesus, A., Quaresma, C., & Vieira,
P. (2016). Optimization of sitting posture classification based on anthropometric data. HEALTHINF, 406–413. Meyer, D., Technikum, F. H., & Austria, W. (2018). Support Vector Machines. Muralidharan, V. & Sugumaran, V. (2012). A comparative study of Naïve Bayes classifier and Bayes net classifier for fault diagnosis of monoblock centrifugal pump using wavelet analysis. Applied Soft Computing, 12(8), 2023–2029.
Sitting Posture Recognition for Smart chair 87
Pynt, J., Higgs, J., & Mackey, M. (2001). Seeking the optimal posture of the seated lumbar spine. Journal of Physical Therapy, 5–21. Bruno. Wong, J., Chau J. Y., van der Ploeg H. P., & Riphagen I. (2010). Occupational
sitting and health risks: a systematic review. National Center for Biotechnology Information, 39(4), 379–88.
LISTED IN THE AHFE DIGITAL BOOKSTORE CATALOGUE
Explore the complete digital volume
Health Informatics and Biomedical Engineering Applications
Read this individual research paper free through the original publisher, or explore the full digital proceedings book.
ISBN 978-1-958651-54-4
Explore this ISBN in the AHFE Bookstore ↗Listed in the July 2026 bookstore catalogue; search by ISBN to confirm current availability · Digital book purchase optional