Atia Bano Memon, Lars-Peter Meyer, Kyrill Meyer, Klaus-Peter Fähnrich (2019). An Insight Survey of Innovation Laboratories Worldwide. In: Advances in The Human Side of Service Engineering. AHFE Open Access, vol. 8. https://doi.org/10.54941/ahfe100259
During the last decades, the drastic changes in market, customer needs, technology and perceptions have stepped the world into an era of innovation, where organizations are continuously striving for an advancement of products, methods or processes to better meet the varying demands of society and keep their edge in a globally competitive environment. The way of innovation is not straight forward and encompasses different obstacles which need to be alleviated in order to design and implement a successful innovation that drives commercial value in the market and brings growth to companies. Subsequently, some dedicated and specialized physical environment is needed to support the innovative activities in a systematic way and minimize the effects of these barriers; this requisite has led to the emergence of innovation laboratories. Currently, a number of innovation laboratories exist around the globe, that are very divergent in terms of capabilities, features and resources; however, this variation and their potential have not been thoroughly investigated. We present the results of a study that identifies the salient features, potential and capabilities of existing innovation laboratories and serves to streamline further research in this domain in order to strengthen their existence and potential, and maximize the use of their innovative services.
Innovation has always been a driving force for growth (Zahra & Covin, 1994), and the challenge is to continually in- novate new technologies and new capabilities. Innovation is about using change to better meet the needs and values (Damanpour, 1991). Different authors have described the concept of innovation in different ways. Some scholars have perceived innovation as a discrete product “a new idea, method or device” (Damanpour & Evan, 1984) and (Kimberly & Evanisko, 1981), while the others see it as a process “the process of introducing something new” (Rogers, 2010). In the literature, it appears that innovation means different things to different people (Damanpour & Schneider, 2006); however, the common thing in all perspectives is the newness or the novelty of the substance. Therefore, innovation can be described as “an idea, a practice, or object perceived as new or improved by an indi- vidual, organization or society” (Damanpour & Gopalakrishnan, 2001).
During the last decades, the drastic changes in market, customer needs, technology and perceptions have stepped the world into an era of innovation, where organizations are continuously striving for an advancement of products, methods or processes to better meet with the varying demands of society and keep their edge in a globally competi- tive environment (Howell & Higgins, 1990), (Ettlie & Reza, 1992). The way of innovation is not straight forward and encompasses different obstacles which need to be alleviated in order to design and implement a successful inno- vation that drives commercial value in the market and brings growth to companies. Subsequently, some dedicated and specialized physical environment is required to support the innovative activities in a systematic way and mini- mize the effects of these barriers; this need has led to the emergence of innovation laboratories.
An innovation laboratory is an emerging phenomenon, that is getting a rapid popularity among all sectors of the world and largely functions as public-private partnerships where firms, academics, public sector authorities, and citi- zens work together for the creation, development and implementation of new products, processes, services and tech- nologies. The term ‘innovation laboratory’ does not have a single definition. By some authors it has been character- ized as dedicated physical environment with collaborative facilities to support and stimulate creative thinking (Mag- adley & Birdi, 2009). Others elaborate the concept a bit further as dedicated facilities to support creative behaviors and innovative activity by providing resources and enabling for reconfiguration of new projects (Lewis & Moultrie, 2005). Later on, Gey summarized that “an innovation laboratory includes two characteristics: a physical environ- ment and a facilitator” (Gey, Meyer, & Thieme 2013). In the broader sense, the term can refer to a methodology, an organization, a system, an arena, environment and/or a systematic innovation approach; however, in the scope of this paper we consider an innovation laboratory as a dedicated physical environment that supports and fosters the in- novation process through the provision of different collaborative services and the resources (equipment, methods and tools).
The innovation laboratories offer great diversity of skills to innovate something in a collaborative physical environ- ment and play a vital role in the successful implementation of innovation in every field of the world. They have helped hundreds of companies around the world to enhance their capacity to innovate and maintain their market leadership. They provide the necessary tools for the generation, discussion and assessment of ideas; the simulation tools and the test environment; to assist the organizations to foresee the future obstacles and reduce the risk factor in implementing the innovative ideas into their businesses without investing too many resources on their own. (Thieme & Meyer, 2011). They lead to the successful innovation by supporting the interaction between the technology push actors (research institutes) and the demand pull actors (companies) (Meyer & Thieme, 2010).
Recently the concept of innovation laboratories, hereafter referred to as InnoLabs, has immensely grown and now a good number of InnoLabs exists around the globe. Owing to the fact that the concept of InnoLabs has been origi- nated only few decades back, little research has been carried out in this area. Since the literature does not show any comprehensive study regarding the worldwide diversity of InnoLabs in terms of features, services and resources; there is a dire need of a systematic study elaborating their capabilities and potential and presenting a complete in- sight of all InnoLabs. The study “An insight survey of Innovation laboratories worldwide” is first study ever of its kind about the InnoLabs and intends to explore their potential and diversity and to establish a snapshot of the Inno- Labs’ capabilities in terms of resources, major ideas, methodologies, typical innovation processes, time frames and so on. The paper is an attempt to streamline the further study on InnoLabs in order to strengthen their existence and maximize the use of their innovative services.
METHODOLOGY
The goal of our research is to construct a comprehensive picture of the state of the art InnoLabs. In order to achieve this objective, the study was conducted in two phases. Initially, a web based study was conducted in order to collect information about various InnoLabs existing worldwide from their official websites. The websites were searched by using different search engines with different keywords. A total of 190 InnoLabs were identified and a preliminary assessment of the offers and potential of the InnoLabs was made (Meyer et al., 2014). In the second phase, an online survey was conducted by means of a questionnaire to better verify and improve the findings through direct contact with the identified InnoLabs. An exploratory analysis of the data was performed to identify the various features, ser- vices and characteristics of the InnoLabs.
Survey Design and Dissemination The survey consisted of an online questionnaire comprising 32 open ended and nominal scale items allowing the re- spondents to provide single or multiple answers for a question depending on the type and nature of the criteria to be assessed. The questionnaire also provided the opportunity for the respondents to supplement their answer with addi- tional information or comments. The questions were organized in seven sections with each section regarding a dif- ferent dimension that was to be assessed about InnoLabs such as, introductory information of the lab, information about the offers provided by lab, innovation processes, methods and tools used in innovation processes, facilities provided by lab, process related statistics, and other supplementary information. The questions were structured and a brief explanation was provided for the complex terms used therein.
Survey Participants’ Demographics Owing to the fact that the term Innovation Laboratory has been coined just recently, the literature does not mention the exact number of InnoLabs existing around the globe. We considered the 190 labs identified by the web-based ex- ploratory research during the first phase of the study. We are aware that more physical spaces providing the innova- tive services also exist, which were not identified by the web-based research. They remain unidentified because ei- ther they are not listed on the web, or are not listed in combination with our search terms and are not linked to other laboratories’ web sites.
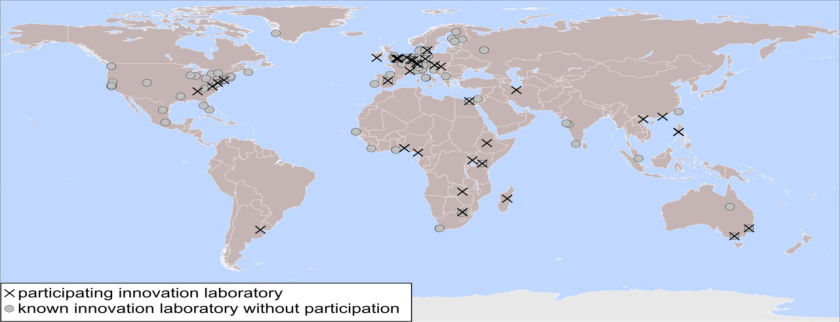
We approached and invited the 190 identified InnoLabs to take part in our online survey through e-mail and a clear consent was provided at the beginning regarding data privacy policy. A few days later, the InnoLabs who did not re- spond to the first invitation were sent a reminder for participation in the survey. At maximum three reminders for participation were sent to the invited InnoLabs with regular intervals. As a result, 35 out of 190 invited InnoLabs, participated in the survey. Out of this more than three fourth of respondents (27 labs) completed the survey while the rest of the InnoLabs (08 labs) answered it only partially. The respondent participants of the survey were found to be located in different regions of the world. Most of them are situated in developed countries while few are in the BRIC countries. We tried to rule out a possible language bias in the list of InnoLabs (Meyer et al., 2014). Figure 1 shows the geographic distribution of participating InnoLabs.
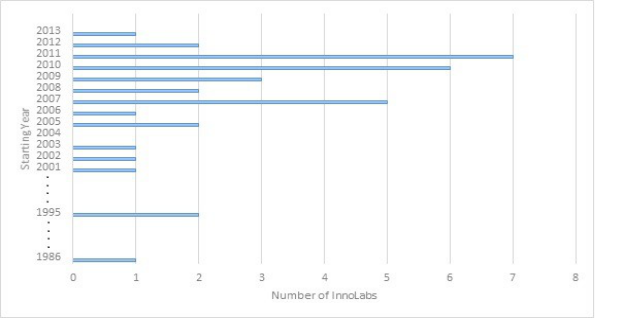
Figure 1: Geographical representation of participating InnoLabs of the survey. (N=35) The participating InnoLabs of this study have originated over the years. More than 74 % of the Innolabs have been established after the year 2007 with only few labs originating earlier. The starting years of our thirty five participat- ing InnoLabs are shown in figure 2. From our data we cannot distinguish if this distribution is due to a short life span of InnoLabs or if the number of InnoLabs founded really increased around 2010.Figure 2: Starting year of the participating InnoLabs of the survey. (N=35)
Data Analysis The software package R, programming for statistical computing (http://www.r-project.org), in version 3.0.1 was used to evaluate the data collected through the questionnaire and to create most of the diagrams presented.
RESULTS
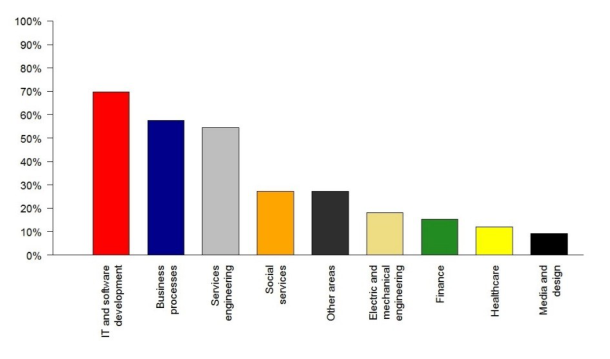
Areas of Knowledge in which the InnoLabs Provide Innovation Support Innovation is needed in nearly every field of the world. Thus, InnoLabs offer the innovative services in various ar- eas. As illustrated in figure 3, the major area wherein the InnoLabs provide innovation support seems to be IT and software development as about 70% of the respondent InnoLabs provide their innovative services in this field. This high level of focus in IT and software development is followed by InnoLabs’ concern with business processes and service engineering. About 58% of the respondent InnoLabs claimed to provide innovative services in business area, and about 55% of the InnoLabs provide their support in the field of service engineering. The innovative services in the field of social services are provided by about 27% of the InnoLabs. The electric and mechanical engineering, fi- nance, healthcare, and media and design areas seem to be focused by only few of the participating InnoLabs. These areas are supported by 18%, 15%, 12% and 9% of the respondent InnoLabs, respectively. In addition, few of the In- noLabs also provide innovative services in other fields such as innovation studies, architecture, logistics, community participation, but, the number of such InnoLabs is small (about 27%).
Figure 3: Areas of knowledge in which the InnoLabs provide innovation support.Equation reproduced from the original PDF.
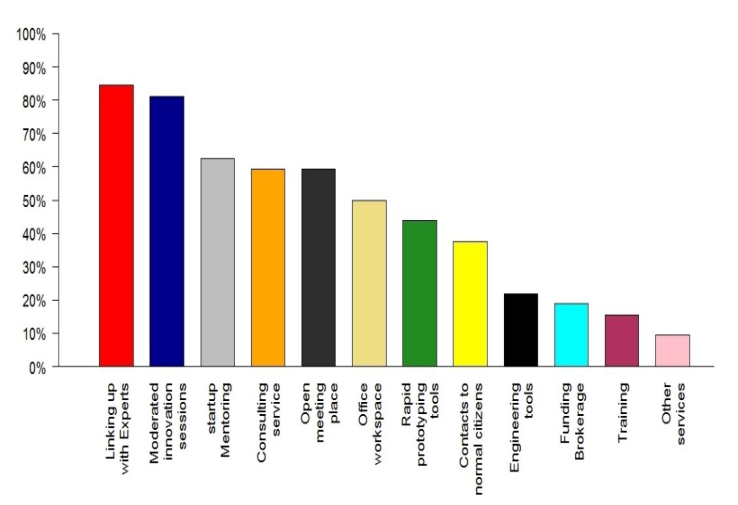
Types of Services Offered by the InnoLabs Innovation is not a single event or activity, but it is a process, which encompasses a number of activities to be sup- ported by InnoLabs. During the web-based study, we generated a list of possible innovative services that an InnoLab may offer (Meyer et al., 2014). The list includes facilitating the customers to get in contact with experts, organizing moderated innovation sessions to transmit valuable experience and know-how from the experts to the customers, providing consulting services, providing physical co-working space and open meeting places, designing rapid proto- typing tools and engineering tools, assistance in finding suitable funding sources for innovative ideas during the business startup, providing the means for contact to the normal citizens, and training. The survey revealed that the most common service provided by the InnoLabs is the provision of linking services with experts and organizing moderated innovation sessions for customers to acquire knowledge regarding innovation opportunities, processes and strategies. The provision of such services suggests that InnoLabs act as intermediaries in the innovation process. Linking services with experts are offered by 84% of the respondent InnoLabs while the provision of moderated in- novation sessions is the second most common service offered by 81% of the participating InnoLabs. About 62% of InnoLabs provide startup mentoring services, while both the consulting services and provision of open meeting place are provided by 59% of the respondent InnoLabs.
Half of the participating InnoLabs provide co-working office space. The development of rapid prototyping tools, es- tablishment of contacts with normal citizens, development of engineering tools, and support for the funding broker- age are provided by 44%, 38%, 22% and 19% of the respondent InnoLabs of the survey, respectively. The training services stay last in the elevator and are provided by only 16% of the InnoLabs. In addition to these services, about 9% of the respondent InnoLabs provide support services in other domains as well including social innovation methodologies, sustainability visions and research and technical tools for animal tracking.
Figure 4: Types of services offered by InnoLabs. (N=32, multiple selections possible)
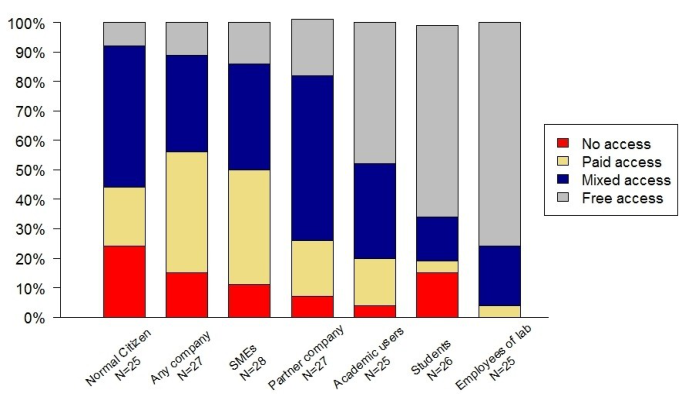
The Access Criteria for users of the InnoLabs Innovative services are required by various users for commercial, educational, research, cultural and political use. The access criterion for the InnoLabs is not uniform across all groups of users and depends on who asks for services. Users may have paid access, free access, mixed access or no access, provided by the InnoLabs. The findings of our survey show that the employees of the InnoLabs, students and academic users can access most of the InnoLabs free of cost. The academic users can access around half of the InnoLabs (48%) free of cost, get a mixed access to 32% of the InnoLabs, paid access to about 16% of the InnoLabs and cannot access 4% of InnoLabs. Subsequently, the stu- dents get free access to about 65% of the InnoLabs, while 15% of InnoLabs provide them mixed access and paid ac- cess is provided by 4% of the InnoLabs. Interestingly, they are restricted to access 15.4% of the InnoLabs. Regard- ing employees of the InnoLab, slightly more than the three fourth of the InnoLabs (76%) provide them free access, 20% InnoLabs provide them mixed access, 4% of the InnoLabs offer paid access and none of the InnoLabs restricts them to access.
In contrast, innovative services for business organizations are mostly available after paying for each service. The SMEs and big companies other than the partner companies of the InnoLabs are only entitled for paid access to most of the InnoLabs. They have free access to very little number of InnoLabs. Any big company gets paid access to 41% of the InnoLabs, and mixed access to one third of the InnoLabs. Interestingly, they are entitled for free access by only 11.1% of the InnoLabs. SMEs have paid access to 39% of the InnoLabs, mixed access to 36% of the InnoLabs and free of cost access to 14% of the InnoLabs. Surprisingly, 11% of the InnoLabs do not allow the SMEs to access them in anyway. In the case of partner companies, slightly more than half of the InnoLabs (56%) provide mixed ac- cess to them while each of paid access and free access is provided by 19% of InnoLabs. They are restricted to access by only few InnoLabs, which amounts to about 7%. The normal citizens tend to have mixed access to a larger num- ber of InnoLabs (nearly half of the InnoLabs) while the number of InnoLabs providing them free access is only 8%. Normal citizens are restricted to access higher number of the InnoLabs (24%) as compared to any other group of customers.
Figure 5: Who and in what way can access the InnoLabs?
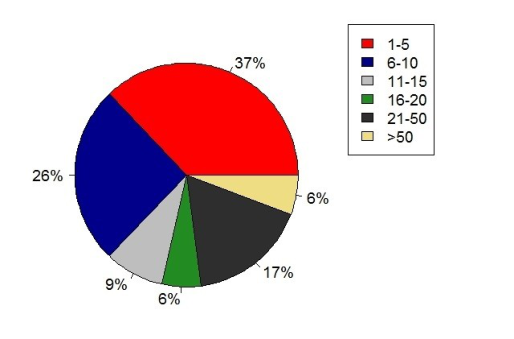
Number of People Working for the InnoLabs Number of people who work for and represent an InnoLab may affect its efficiency and performance. The survey shows that the number of people working for most of the InnoLabs is lower than 10. Slightly more than one third of the respondent InnoLabs (about 37 %) indicated that their employees count up to 5 whereas 26% of the InnoLabs have 5 to 10 employees. The number of InnoLabs having employees more than 10 is very small. Only about 9% of the InnoLabs indicated up to the 15 employees, 6% of the InnoLabs account for up to 20, 17 % of the InnoLabs have up to 50 people and 6% have more than 50 people working for them.
Figure 6: Number of people working for InnoLabs. (N=35) Types and Number of Employees Working for the InnoLabs
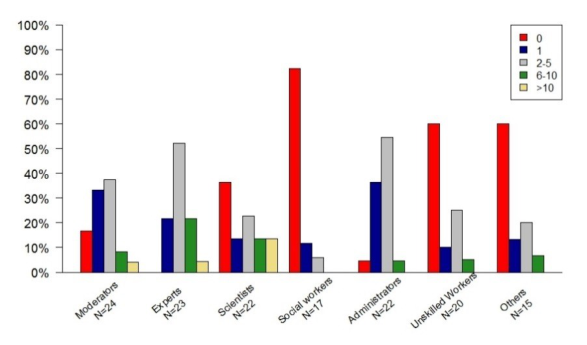
Different types of employees including moderators, experts (engineers, programmers, and designers), scientists, so- cial workers, unskilled workers and administrators can work for an InnoLab. The number of employees of different types working for an InnoLab highly influences the efficiency of the lab. The findings indicate that most of the Inno- Labs either do not hire some of these types of employees or only employ them in very small number. The modera- tors, scientists and the experts seem to be either not employed in most of the InnoLabs or their number is limited up to the 5. As shown in figure 7, about 38% of the respondent InnoLabs of the survey employ 2 to 5 moderators; 33% of the InnoLabs have only one moderator while 17% of the InnoLabs do not have any moderator at all. Only few of the InnoLabs (about 13 %) employ more than 5 moderators. Regarding the experts hired by a lab, slightly more than half of the InnoLabs have 2 to 5 experts. Remarkably, all of the InnoLabs hire at least one expert. The scientists working for the InnoLabs are also fewer. About 14% of the InnoLabs employ a single scientist and 23% InnoLabs employ 2 to 5 scientists while the number of scientists approaching 10 and more than 10 is reported by 14% of the
InnoLabs, each. Most surprisingly, 36% of the respondent InnoLabs do not have any scientist working for them. Most of the InnoLabs do not have any social worker working for them as well, which amount to about 82% of the survey participating InnoLabs. The remaining InnoLabs only have up to 5 social workers. The number of InnoLabs reporting the absence of an unskilled worker is also high (about 60% of the InnoLabs). About 10% of the InnoLabs have a single unskilled worker, and 25% of the InnoLabs have 2 to 5 unskilled workers. Few of the InnoLabs (5%) have slightly more unskilled workers but the number does not exceed by 10 anywhere. The administrators in an In- noLab are also limited up to 10. About 36% of the InnoLabs reported only one administrator, more than half of the InnoLabs (54.5%) indicated 2 to 5 administrators, 5% of the InnoLabs have up to 10 administrators. Surprisingly, some of the InnoLabs (5 %) do not have any administrator at all. Some of the InnoLabs (40%) also claimed to have some other types of employees numbering up to 10.
Figure 7: Types and number of employees working for the InnoLabs.
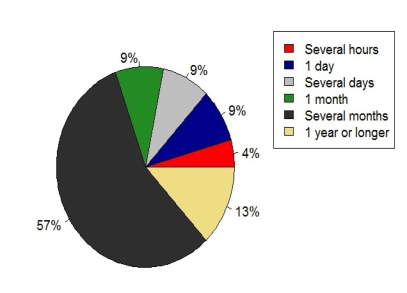
Time interval of a Whole Typical InnoLab Process A complete innovation process encompasses a number of activities such as, identification of problem and opportuni- ties, consultation and requirement analysis, design of the solution, implementation and maintenance etc. The time taken by InnoLabs to complete an innovation process is variable and depends on the type of innovation project. As shown in the figure 8, more than half of the InnoLabs (57%) take several months to accomplish an innovation process, while 13% of the InnoLabs take even longer time, about one year or more. Only few of the InnoLabs re- ported innovation process time up to one month. The innovation process time period of exactly one month, several days, or one day was reported by 9% of the InnoLabs, each. Only 4% of the respondent InnoLabs claim to complete an innovation process within several hours.
Fi
gure 8: Time interval of a whole typical InnoLab
Figure 9: Typical accumulated InnoLab time spent together with a customer for the whole process. (N=23) InnoLab process. (N=21)
Typical Accumulated Innolab Time Spent Together with a Customer for a Whole Typical Innovation Lab Process Customers who ask for innovation services are the main component of the innovation process and the InnoLabs pro- vide the services in close connection with them. However, customers only spend some time of the whole innovation process in the InnoLabs. This amount of time depends on the innovation project and the type of support asked for. As shown in figure 9, most of the InnoLabs reported this consultation time as up to one month. About 48% of the In- noLabs spend several days with the customer, while 5% of the InnoLabs take one day and 10% of the InnoLabs take several hours of consultation with the customer. The time of InnoLab spent with customer approaches to several months in case of 33% of the InnoLabs and 5% of the respondent InnoLabs of the survey take even longer time ap - proaching to one year or more.
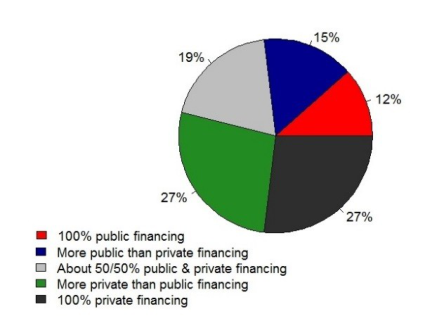
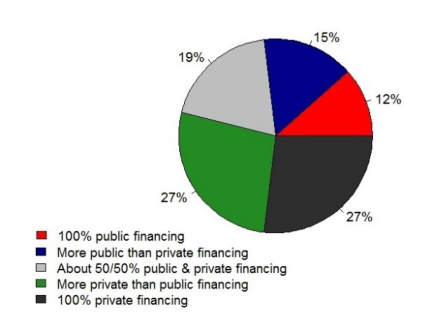
Extent of Utilization of Different Sources of Funding by the InnoLabs Funding is the fuel on which InnoLabs run and provide their services to the community. An InnoLab can take differ- ent avenues to attain funding, and more than one option can be used. The performance and efficiency of InnoLabs depends on the type and amount of money they have. In terms of finance the sources for the InnoLabs may vary from 100 percent public funding to 100 percent private funding. As shown in figure 10, the survey revealed that most of the InnoLabs utilize private funding. Interestingly, more than the three fourth of the InnoLabs (83%) utilize the private funding to some extent, of which about 27% depend only on private funding while another 27% of the InnoLabs have acquired some public finance as well but private sources constitute the major portion of financing. In contrast, only 12% of the InnoLabs have acquired 100 percent public finance while about 15% of the InnoLabs use the combination of both sources, however the public funding makes the bigger part of the financing. An equal uti- lization of both sources (public and private funding) is reported by 19% of the InnoLabs.
Figure 10: Utilization of different fundingFigure 11: Connection of InnoLabs to research sources by the InnoLabs. (N=26) institutions. (N=25)
The Connection of InnoLab and Research Institution Innovative services are not steadfast and require research to be conducted regarding the different aspects of develop- ing and implementing the successful and sustainable innovative products, processes or technologies; therefore, Inno- Labs may be affiliated with research institutes such as a university etc. The survey results revealed that InnoLabs usually have some connection to research institutes, either they are being managed by research institutes or having partnerships with them. As shown in figure 11, about 84% of the respondent InnoLabs reported a connection to some research institute, out of which 44% are managed by some research institute while the remaining 40% have re- search institutes as their partners. Only few of the respondent InnoLabs (16%) work in isolation from any research institute.
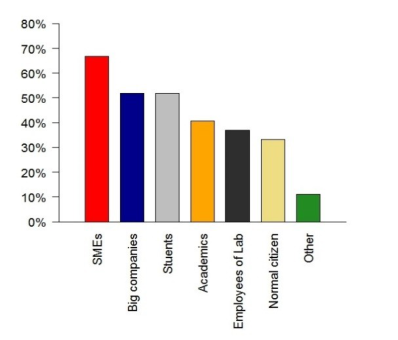
Typical Customer of the InnoLabs As illustrated in figure 12, Small and medium enterprises constitute the most common user group of the 67% of the respondent InnoLabs of the survey whereas big companies and students are most common users of the 52% of the InnoLabs, each. The academic customers, employees of the InnoLab owner, and normal citizens are regarded as typ- ical customers by 41%, 37%, and 33% of the InnoLabs, respectively. Other types of customers make up the common user group of only 11% of InnoLabs.
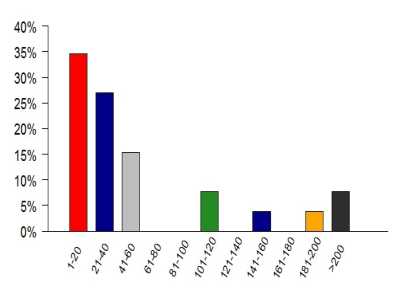
Figure 13: Recommended capacity for customers in the InnoLab. (N=26)Figure 12: Typical customer or user of the Inno- Labs. (N=27, multiple selections possible)
Recommended Participant Capacity in the InnoLabs The study shows that the maximum number of participants that a particular InnoLabs can accommodate lies under 60 for most of the InnoLabs. As shown in figure 13, about 35% of the InnoLabs can accommodate up to 20 partici - pants, 27% can facilitate up to 40 participants and only few InnoLabs (about 15 %) reported the capacity for 60 par - ticipants. The number of InnoLabs accommodating more than 60 participants is very small.
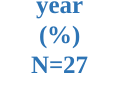
Process Related Statistics of the InnoLabs: a. Number of InnoLab processes started per year: The number of processes that InnoLabs initiate per year is limited to the maximum of 15. The survey shows that one third of the respondent InnoLabs start 5 projects per year. Slightly fewer InnoLabs (30%) start up to 10 processes while only 11% start up to 15 processes annually. The number of InnoLabs initiating more than 15 processes per year is very small. Only 4% of In- noLabs claimed to start about 16 to 20 processes yearly. The number of processes in the range of 26 and 30, or 36 and 40, or more than 50 per year is initiated by 7% of the respondent InnoLabs.
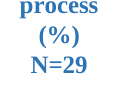
b. Number of people involved in a typical InnoLab process: The number of people including employees, partners and customers involved in a particular innovation process seems to be up to 15 for most of the In- noLabs. The maximum number of InnoLabs reported between 6 and 10 people involved in a process. Re- ferring to table 1, about 21% of the InnoLabs involve up to 5 people in a typical innovation process, 35% of the InnoLabs engage 6 to 10 people while 21% of the InnoLabs reported 11 to 15 people per process. The number of InnoLabs involving more than 15 people in a project is small.
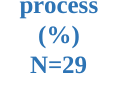
c. Number of employees involved in a typical InnoLab process: The employees only constitute a portion of all the people involved in the innovation projects of the InnoLabs. A number of up to 10 employees in- volved in a typical innovation process were reported by most of the InnoLabs. About 69% of the respon- dent InnoLabs of the survey involve up to 5 employees only whereas 24% indicated 10 employees per process. The InnoLabs incorporating more than 10 employees is very small.
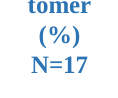
d. Number of projects for which the typical customer uses an InnoLab: A particular customer may under- take a number of projects in an innovation lab. Most of the labs indicated that the number of projects that a customer undertakes with them is limited up to 5. About 82% of the InnoLabs reported the project count per customer within this limit, 12% of InnoLabs reported 6 to 10 projects per customer while only 6% of the InnoLabs indicated 16 to 20 projects per customer. The number of projects beyond 20 was not reported by any participating InnoLab.
e. Number of maximum projects for which one customer uses an InnoLab: The InnoLabs reported the num- ber of projects that one customer undertake. The number of maximum projects taken by the best customer for most of the InnoLabs (70%) is up to 5. The count between 6 and 10, or between 11 and 15, each was observed in 10% of the InnoLabs. About 5% of the InnoLabs account for each, 16 to 20, or 36 to 40 maxi- mum projects per customer.
People per
Employees per
Projects per
Count (Processes/
Processes started per
process
process
typical cus-
Maximum projects per
year
tomer
customer
people/ employees/
Equation reproduced from the original PDF.Equation reproduced from the original PDF.
projects)
Equation reproduced from the original PDF.Equation reproduced from the original PDF.
Table 1: Process related statistics of the innovation laboratories. A dash (“–“) indicates zero percent.
Use of Methods and Tools by the InnoLabs: Innovation development, implementation and realization requires a number of technical tools and methods. Almost all of the InnoLabs (93%) agreed with the utilization of a wide variety of tools and methods to support innovation processes whereas the remaining InnoLabs have shown a neutral response. The various methods that InnoLabs use include service blueprinting, brainstorming sessions, collaboration, prototyping, business model canvas and others. In addition, most of the InnoLabs (89%) agree that a good methodology is very important for the success of an inno- vation laboratory while the other respondent InnoLabs of the survey indicated a neutral response. Most of the Inno- Labs also agree with the use of the loops/iterations in a typical innovation process (about 73%). The various tools used by InnoLabs include modeling and simulation tools, moderation tools, software development tools, designing and presentation tools and others.
Equation reproduced from the original PDF.Table 2: Use of methods and tools by the innovation laboratories. A dash (“–“) indicates zero percent.
Table available in the original PDF paper.
DISCUSSION
The 21st century has seen the drastic evolution in innovative products and processes. In the past, many organizations have been able to survive even with very limited innovation; they used to focus on providing quality products and simply update them to a level that maintains their competitiveness in the market. Nowadays, it is not enough for the organizations to just provide quality products; instead the changes in market, customers and technology have made it obligatory for organizations to innovate at very high levels. Thus, day by day more customers seem to utilize the ser- vices of InnoLabs in order to integrate innovative products and services into their businesses. InnoLabs support the design and deployment of innovations by providing the collaborative physical environment for the customers. They support the human activities involved in the innovation process by assisting the customers in determining market needs, finding new opportunities, evaluating the feasibility of proposed innovative ideas and implementing them through the provision of various innovative sessions, training and experts’ opinions.
The divergent nature of the various InnoLabs existing worldwide enables them to offer numerous innovative ser- vices in almost every field of the world including industry or technology areas that are deemed to have a significant cross-cutting economic and social impact such as ICT, service engineering and business; and the fields that are key to the substantial existence of the society (e.g. finance, healthcare, media and design) at the rate the world is chang- ing. The range of services that InnoLabs provide to customers including individuals and business organization is very wide. They help their customers with the actual realization of innovation in their businesses through various means of establishing their contact with experts to equip them with proper guidance regarding the analysis of oppor- tunities, development of efficient and improved methods and tools, innovation management strategies and other in- novation related tasks. InnoLabs are mostly free to access for academic, research or educational use, while their ser- vices for business organizations are usually available on paid basis. However, few InnoLabs also entitle business customers for free access thus providing an opportunity for the business organization with limited resources avail- able to afford the integration of innovation in their products and services, despite of the risk associated with intro- ducing something new.
The adoption of a specific approach to innovation development and the array of instruments that goes with it is a major step towards the successful innovation. As the demands of market, customers and organizations are very dy- namic in behavior, a variety of methods, strategies and tools for innovation are also required to meet these divergent demands. InnoLabs utilize a wide array of methods and tools at different phases of innovative processes and work in close connection to some research institute in order to explore the ways and ideas for more advanced or improved methodologies, and the design and implementation of a set of methods and tools by taking full advantage of the ben- efits of new technologies. InnoLabs carry out various innovative projects per year of different time frames and man- ners by utilizing the different sources of funding (public, private, or combination of both).
Limitations of the Study The quantitative analysis of the study is restricted to the data obtained from the thirty five survey respondents and can be more validated and solidified by increasing the number of responses. The sample size seems to be small and InnoLabs responded to the survey voluntarily, thus making a random sample that does not represent the whole popu- lation accurately. Only the InnoLabs identified by the prior web-based study were invited via email for the participa- tion in the survey and the alternate means of identifying more InnoLabs were not used. Furthermore, the study de- picts a worldwide summary of InnoLabs and the geographical biasing was not taken into consideration.
CONCLUSIONS
The InnoLabs have evolved considerably in last years and there are obvious gains in innovation. The InnoLabs serve as catalyst for enhancing the innovative capability and potential of the individual and business customers and enable people to better meet the requirements of innovation imposed by the changes in market, society and customer per- ceptions. In the scope of this paper, we have presented the divergent nature of InnoLabs existing around the globe in terms of major concern areas for innovation support, the different innovative services offered, the access options for different groups of customers, the types and statistics of employees, typical customers, size, innovation process counts and time durations, funding sources, research connection, and use of methods and tools in design, implemen- tation and actual realization of the innovations. The study lays the foundation brick toward the further categorization of the InnoLabs.
ACKNOWLEDGEMENT
This study was supported by a grant from the German Federal Ministry of Education and Research (grant no. FKZ 01XZ12002).
REFERENCES
Damanpour, F. (1991). Organizational innovation: A meta-analysis of effects of determinants and moderators. Academy of management journal, 34(3), 555–590. Damanpour, F., & Evan, W. M. (1984). Organizational innovation and performance: the problem of" organizational lag. Adminis-
trative science quarterly, 392–409. Damanpour, F., & Gopalakrishnan, S. (2001). The dynamics of the adoption of product and process innovations in organizations.
Journal of Management Studies, 38(1), 45–65. Damanpour, F., & Schneider, M. (2006). Phases of the adoption of innovation in organizations: Effects of environment, organization and top Managers1. British Journal of Management, 17(3), 215–236. Ettlie, J. E., & Reza, E. M. (1992). Organizational integration and process innovation. Academy of management journal, 35(4),
795–827. Gey, R.; Meyer, L.-P.; Thieme, M. (2013). A Conceptual Framework for Describing the Phenomenon Innovation Laboratory: A Structurational Viewpoint. Proceedings of the XXIII International RESER Conference, Aix en Provence, France, 19–21. Sep- tember 2013. Howell, J. M., & Higgins, C. A. (1990). Champions of technological innovation. Administrative science quarterly, 317–341. Kimberly, J. R., & Evanisko, M. J. (1981). Organizational innovation: The influence of individual, organizational, and contextual
factors on hospital adoption of technological and administrative innovations. Academy of management journal, 24(4), 689– 713. Lewis, M., & Moultrie, J. (2005). The organizational innovation laboratory. Creativity and innovation management, 14(1), 73–
83. Magadley, W., & Birdi, K. (2009). Innovation labs: an examination into the use of physical spaces to enhance organizational creativity. Creativity and innovation management, 18(4), 315–325. Meyer, K., & Thieme, M. (2010). Activating the Innovation Potential of SME: The Bottom-Up-Approach. In ISSS/BPSC (pp. 3–
16). Meyer, L.-P. Schultz, J., Foradi, M., Thieme, M., Meyer, K. (2014). Innovation Laboratories Worldwide – Insights gathered through the analysis of the representation in the World Wide Web. To appear. Preliminary version at http://bis.infor- matik.uni-leipzig.de/LarsPeterMeyer Rogers, E. M. (2010). Diffusion of innovations: Simon and Schuster. Thieme, M.; Meyer, K. (2011). Innovation through collaboration: a case-study based strategy to connect research institutions and
enterprises, SRII, pp.622–629, 2011 Annual SRII Global Conference, 2011 DOI: 10.1109/SRII.2011.68, ISBN: 978–0-7695– 4371–0/11. Zahra, S. A., & Covin, J. G. (1994). The financial implications of fit between competitive strategy and innovation types and sources. The Journal of High Technology Management Research, 5(2), 183–211.
LISTED IN THE AHFE DIGITAL BOOKSTORE CATALOGUE
Explore the complete digital volume
Advances in The Human Side of Service Engineering
Read this individual research paper free through the original publisher, or explore the full digital proceedings book.
ISBN 978-1-4951-2091-6
Explore this ISBN in the AHFE Bookstore ↗Listed in the July 2026 bookstore catalogue; search by ISBN to confirm current availability · Digital book purchase optional